. 2016 Jul 1;25(13):2681-2697.
doi: 10.1093/hmg/ddw127. Epub 2016 Apr 28.

Increased expression of the frontotemporal dementia risk factor TMEM106B causes C9orf72-dependent alterations in lysosomes

Affiliations

Increased expression of the frontotemporal dementia risk factor TMEM106B causes C9orf72-dependent alterations in lysosomes

Johanna I Busch et al. Hum Mol Genet. .

Abstract

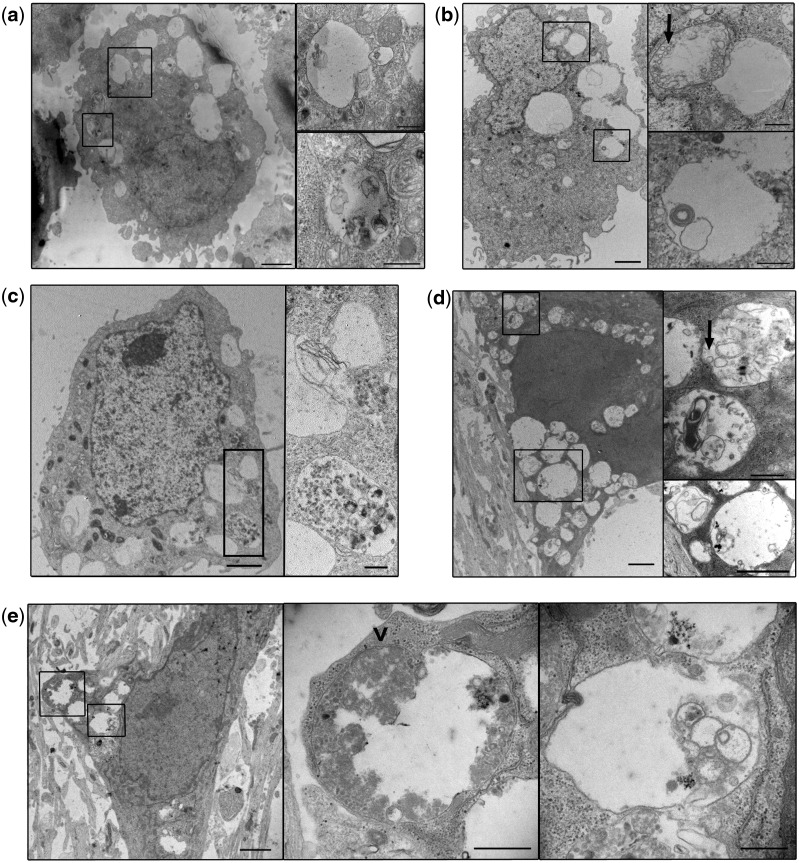
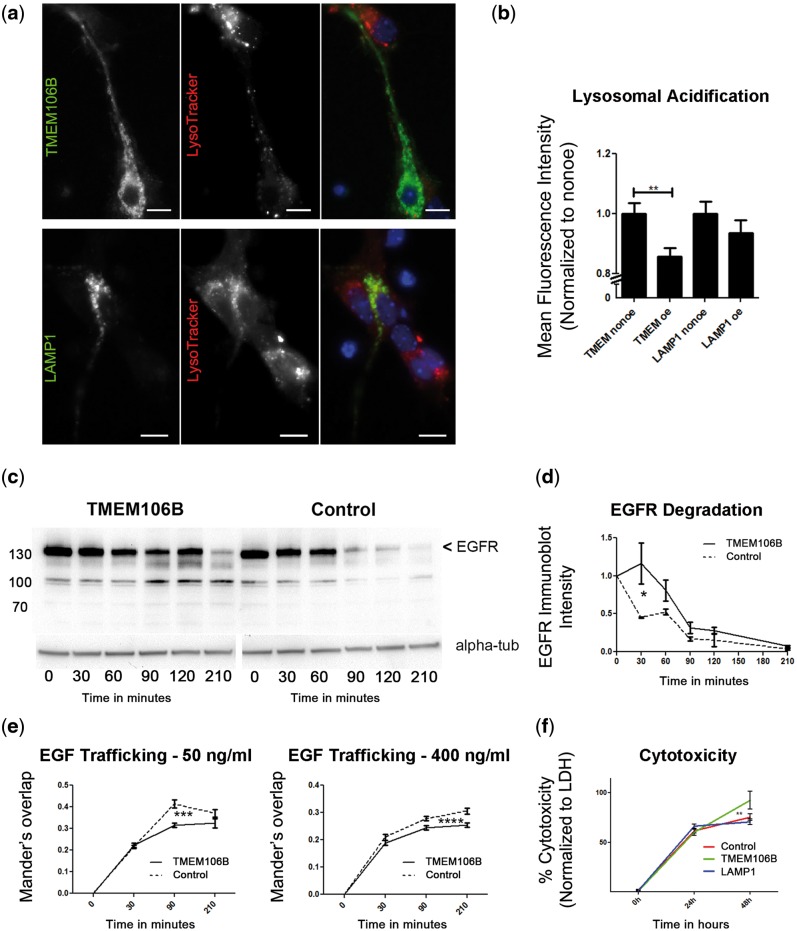
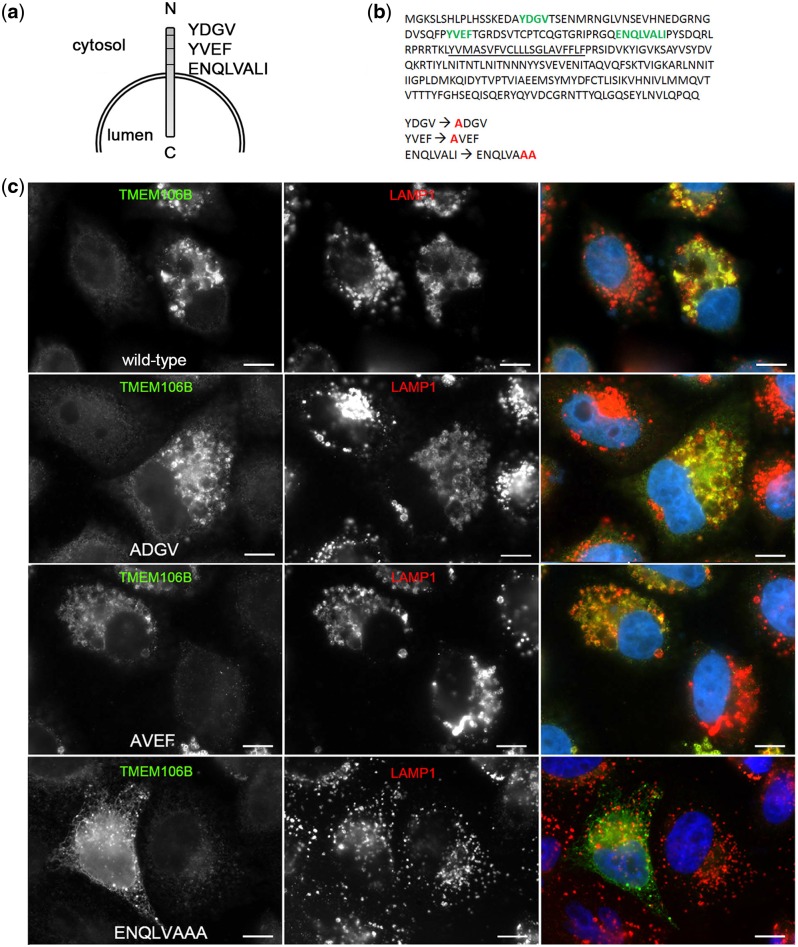
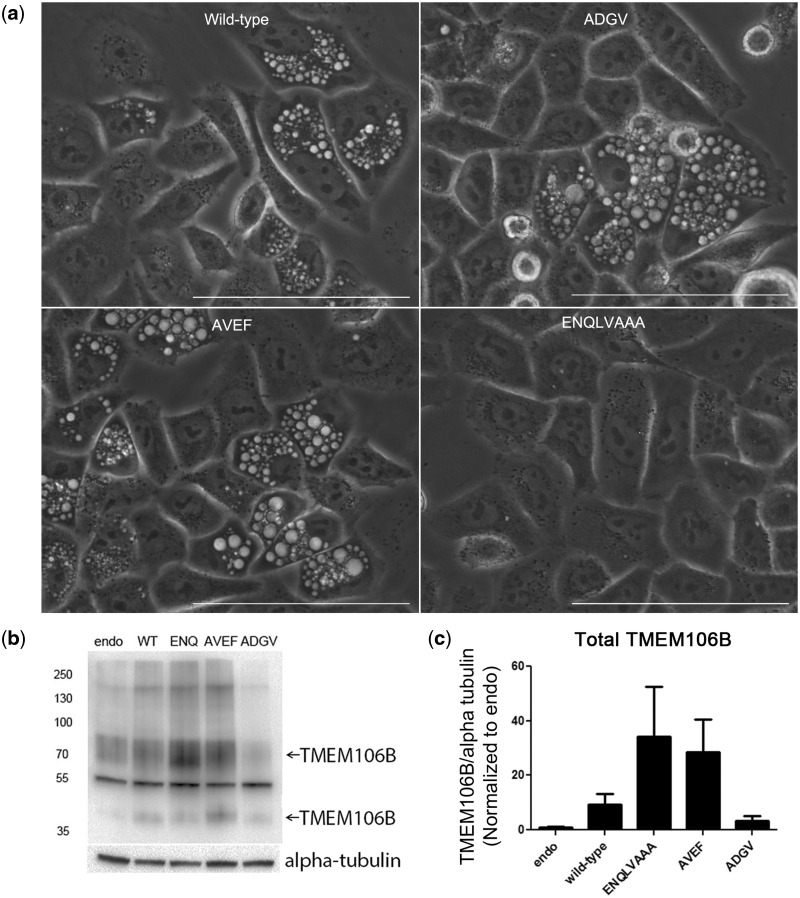
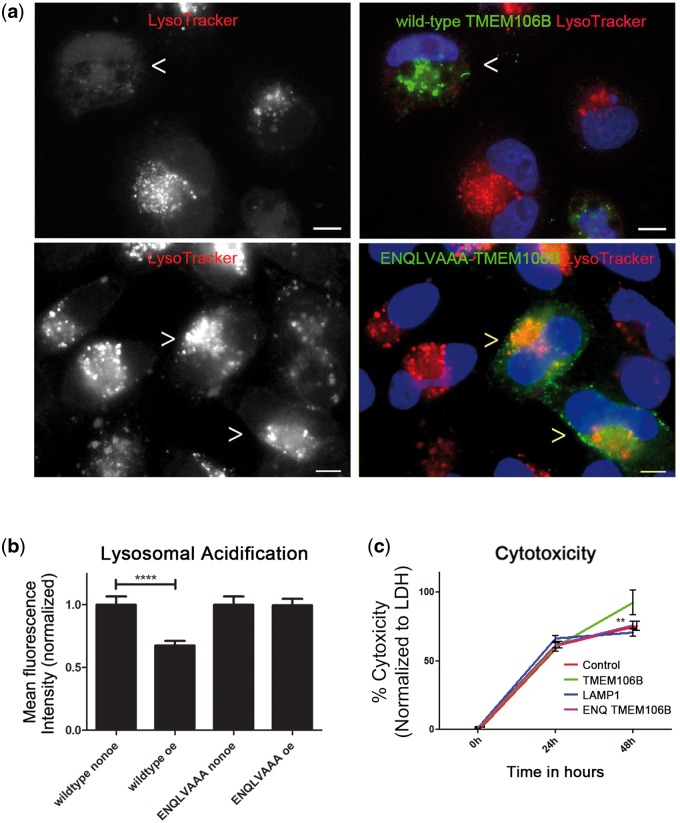
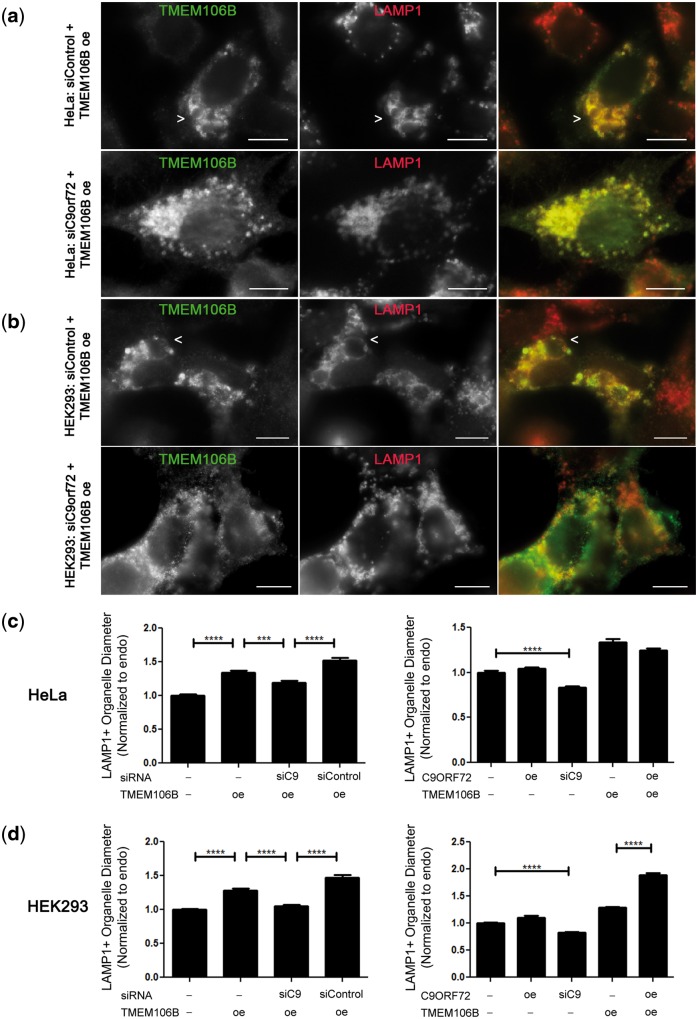
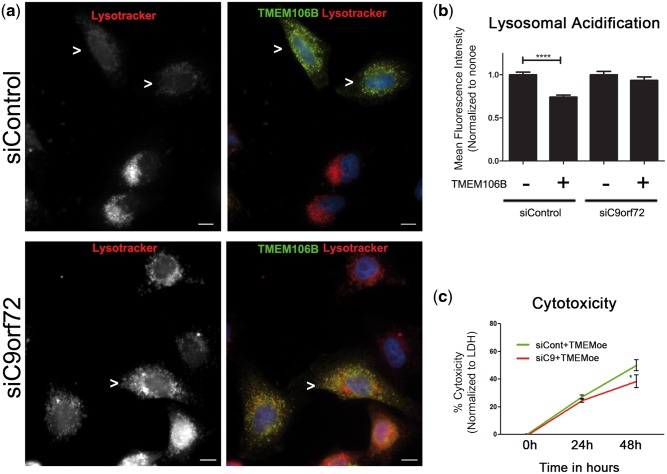
Frontotemporal lobar degeneration with TDP-43 inclusions (FTLD-TDP) is an important cause of dementia in individuals under age 65. Common variants in the TMEM106B gene were previously discovered by genome-wide association to confer genetic risk for FTLD-TDP (p = 1 × 10-11, OR = 1.6). Furthermore, TMEM106B may act as a genetic modifier affecting age at onset and age at death in the Mendelian subgoup of FTLD-TDP due to expansions of the C9orf72 gene. Evidence suggests that TMEM106B variants increase risk for developing FTLD-TDP by increasing expression of Transmembrane Protein 106B (TMEM106B), a lysosomal protein. To further understand the functional role of TMEM106B in disease pathogenesis, we investigated the cell biological effects of increased TMEM106B expression. Here, we report that increased TMEM106B expression results in the appearance of a vacuolar phenotype in multiple cell types, including neurons. Concomitant with the development of this vacuolar phenotype, cells over-expressing TMEM106B exhibit impaired lysosomal acidification and degradative function, as well as increased cytotoxicity. We further identify a potential lysosomal sorting motif for TMEM106B and demonstrate that abrogation of sorting to lysosomes rescues TMEM106B-induced defects. Finally, we show that TMEM106B-induced defects are dependent on the presence of C9orf72, as knockdown of C9orf72 also rescues these defects. In sum, our results suggest that TMEM106B exerts its effects on FTLD-TDP disease risk through alterations in lysosomal pathways. Furthermore, TMEM106B and C9orf72 may interact in FTLD-TDP pathophysiology.


Figures

Figure 1.
Figure 1.
Increased expression of TMEM106B results in a vacuolar phenotype. (a) Live image of HeLa cells transfected with GFP-TMEM106B or GFP-LAMP1. Expression of TMEM106B resulted in the appearance of enlarged vacuolar structures (left) visible by fluorescence or brightfield microscopy. This phenotype was not observed upon expression of GFP-LAMP1, another transmembrane lysosomal protein (right). (b) In primary mouse hippocampal neurons nucleofected with GFP-TMEM106B, the enlarged vacuolar structures demonstrate co-localization of TMEM106B (green) and the lysosomal marker LAMP1 (red). The two right panels show the merged images, which are shown in monochrome in the first and second panels. Scale bar for images excluding magnified right panel = 10 µm. (c) Primary mouse hippocampal neurons nucleofected with GFP-TMEM106B (left) exhibit enlarged >2–3 µm vacuolar structures, whereas neurons nucleofected with GFP-LAMP1 (right) do not. Scale bar = 10 µm. (d) The diameter of LAMP1+ organelles in TMEM106B over-expressing neurons is significantly larger than that of neighboring neurons not over-expressing TMEM106B. p < 0.001 for four replicate experiments.
Figure 2.
Figure 2.
Ultrastructural characterization of TMEM106B-induced vacuolar phenotype. (a) HeLa cells transfected with TMEM106B exhibit multiple large electron-lucent, single-membraned organelles. These organelles often contain cytosolic components in varying states of degradation and multilamellar structures (see insets), an ultrastructural phenotype consistent with late autophagic vacuoles (autolysosomes or amphisomes). (b) COS-7 cells transfected with TMEM106B also display a similar phenotype, with intraluminal vesicles (ILVs, arrow) and multilamellar structures within the enlarged vacuoles (see insets). (c) HEK293 cells transfected with TMEM106B also display the enlarged vacuoles, some containing components in varying states of degradation (see inset). (d, e) Primary mouse hippocampal neurons nucleofected with TMEM106B display the same ultrastructural phenotype. The organelle depicted in the middle panel of (e) demonstrates a small area of still visible double membrane (arrowhead), consistent with identification as a late autophagic vacuole (double membrane-autophagosome fusing with a lysosome, resulting in degradation of the inner membrane). Occasional internal ILVs are similarly noted as well (arrow in top inset for (d)). In all panels, right panels show insets of the lower-power view in each set of images. Scale bars = 2 µm for the lower-power view, and 0.5 µm for the insets.
Figure 3.
Figure 3.
Increased expression of TMEM106B results in lysosomal dysfunction. (a) Expression of GFP-TMEM106B (top three panels) in DIV4 primary mouse hippocampal neurons results in an apparent decrease in intensity of LysoTracker, a pH-sensitive dye that fluoresces intensely at low pH and weakly at higher pH. Expression of GFP-LAMP1 (bottom three panels) does not affect LysoTracker intensity. In each set of three panels, the right-most panel shows the merged images, with LysoTracker in red, and TMEM106B or LAMP1 in green. Cells over-expressing TMEM106B or LAMP1 fluoresce brightly in green compared to non-over-expressing neighbors. (b) Quantification of lysosomal acidification data combined from seven replicates performed on 4 days in primary neurons. GFP-TMEM106B over-expressing neurons demonstrate a significant decrease in MFI of LysoTracker, compared with neighboring non-over-expressers (Mann–Whitney p=0.002). Over-expression of GFP-LAMP1 does not significantly affect LysoTracker MFI. (c, d) Addition of EGF in the presence of cycloheximide results in rapid EGFR lysosomal degradation in vector-transfected cells (right immunoblot). EGFR degradation in TMEM106B-transfected cells, however, was impaired (left immunoblot). EGFR is indicated by the arrowhead; other bands are non-specific. Shown are representative immunoblots of EGFR and an alpha-tubulin loading control (alpha-tub) (c) and quantification of four replicates (d) (two-way ANOVA p = 0.011). (e) The endolysosomal trafficking of EGF to LAMP1+ organelles is delayed in TMEM106B over-expressing cells, as demonstrated by decreased co-localization between EGF and LAMP1 under TMEM106B over-expressing conditions, compared with neighboring control cells. Two different concentrations of EGF were tested, as the lower concentration (left) is internalized via EGFR-mediated endocytosis, while the higher concentration (right) may also utilize other internalization mechanisms. Co-localization was quantified by Mander’s overlap (two-way ANOVA p = 0.001 for 50 ng/ml EGF, p < 0.0001 for 400 ng/ml EGF). (f) Increased expression of TMEM106B results in cytotoxicity. Cytotoxicity was quantified in HeLa cells over-expressing TMEM106B or controls (LAMP1, 5TO vector) using measurements of LDH release (which accompanies loss of cell membrane integrity); data are combined for 18 replicates performed on 3 days. Over a 48-h time-course, TMEM106B over-expression (green) resulted in significantly greater cytotoxicity than over-expression of LAMP1 (blue, two way ANOVA p < 0.001) or 5TO vector control (5TO in red, two-way ANOVA p = 0.026).
Figure 4.
Figure 4.
ENQLVALI is a potential lysosomal sorting motif for TMEM106B. (a) Three potential classical lysosomal targeting motifs—two tyrosine motifs and one isoleucine/dileucine motif—were identified in the N-terminal domain of TMEM106B. (b) The primary amino acid sequence of TMEM106B, with potential lysosomal targeting motifs depicted in green, is shown. Specific residues were individually mutated to alanine residues, with mutated residues indicated in red. (c) Double-label immunofluorescence microscopy demonstrates that wild-type TMEM106B (top row), ADGV-TMEM106B (second row) and AVEF-TMEM106B (third row) continue to co-localize strongly with LAMP1. In contrast, ENQLVAAA-TMEM106B (bottom row) appears diffusely throughout the cytoplasm of HeLa cells and exhibits decreased co-localization with LAMP1. For all constructs, the right-most panel shows merged channels for TMEM106B (green) and LAMP1 (red), with individual channels shown in monochrome in the left and middle panels. Scale bars = 10 µm. TMEM106B is detected by N2077 antibody.
Figure 5.
Figure 5.
The vacuolar phenotype induced by TMEM106B expression depends on proper localization of TMEM106B to lysosomes. (a) Live imaging of HeLas over-expressing either wild-type TMEM106B or lysosomal motif mutants by bright-field microscopy demonstrates loss of the vacuolar phenotype in cells expressing the ENQLVAAA-TMEM106B mutant. In contrast, cytoplasmic vacuoles ranging in size were readily seen in cells expressing wild-type, ADGV-, or AVEF-TMEM106B. Scale bar = 100 µm. (b, c) Lysosomal motif mutants all exhibit expression levels that are comparable to, or higher than, wild-type TMEM106B, with the ENQLVAAA-TMEM106B construct expressing at the highest levels in HeLa cells. Endo=endogenous TMEM106B, WT = wild-type TMEM106B, ENQ = ENQLVAAA-TMEM106B, AVEF = AVEF-TMEM106B, and ADGV = ADGV-TMEM106B. In the example immunoblot (b), two bands (arrows) for TMEM106B at 70 kDa (dimer) and 40 kDa (monomer) are detected (N2077 antibody), and alpha-tubulin is shown as a loading control. Quantification of TMEM106B protein expression levels for four replicate experiments is shown in (c), normalized in each blot to the endogenous condition (mean ± SEM).
Figure 6.
Figure 6.
The effects of increased TMEM106B expression depend on proper localization of TMEM106B to lysosomes. (a, b) While expression of wild-type TMEM106B (FLAG-TMEM106B construct) in HeLa cells impairs lysosomal acidification (as demonstrated by decreased LysoTracker MFI, top row, arrowhead indicates TMEM106B over-expressing cell), expression of ENQLVAAA-TMEM106B does not significantly alter organelle acidification as compared with neighboring non-over-expressers (bottom row, arrowheads indicate ENQLVAAA-TMEM106B over-expressing cells). Representative images are shown in (a), and means ± SEM for six replicates performed on 3 days are shown in (b). Scale bars = 10 µm. Wild-type TMEM106B and ENQLVAAA-TMEM106B are detected by their FLAG tags in (a). (c) Cytotoxicity is rescued by mutation of critical residues within the potential dileucine lysosomal sorting motif (ENQLVALI to ENQLVAAA) in TMEM106B. While wild-type TMEM106B expression in HeLa cells induces cytotoxicity by 48 h (TMEM106B, green line), the loss of lysosomal localization (ENQ TMEM106B, pink) rescues this cytotoxicity to levels seen with transfection of vector only (control, red line, almost entirely overlapped by pink line). Cytotoxicity seen with expression LAMP1 (blue line) is also shown for comparison purposes; the LAMP1 data is repeated from Figure 3f. Beyond the 48-h time point, wild-type TMEM106B-expressing cells are largely lost from the culture medium due to cell death. % cytotoxicity is calculated in comparison to the maximal LDH release induced by treatment with Triton X as described in Materials and Methods section. Data are combined for six replicates performed on three different days. **p < 0.01. ****p < 0.0001.
Figure 7.
Figure 7.
Knockdown of C9orf72 rescues TMEM106B-induced vacuolar phenotype. (a, b) In HeLa cells (a) and in HEK293 cells (b), treatment with control siRNA does not affect the LAMP1+ vacuolar phenotype seen in TMEM106B over-expressing cells (arrows, top row), but siRNA knockdown of C9orf72 mitigates the phenotype (bottom row). For all panels, the right panel shows the merged channels for TMEM106B (green) and LAMP1 (red); individual channels are shown in monochrome in the left and middle panels. Scale bars = 10 µm. TMEM106B detected by N2077 antibody. (c, d) The diameter of LAMP1+ organelles was quantified in HeLa (c) and HEK293 (d) cells. In the left graph for both cell types, LAMP1+ diameter was assessed under endogenous conditions (first column), TMEM106B over-expression (second column), TMEM106B over-expression with C9orf72 knockdown (third column), and TMEM106B over-expression with control siRNA knockdown (fourth column). In the right graph, LAMP1+ diameter is quantified under endogenous conditions (first column), C9orf72 over-expression (second column), C9orf72 knockdown alone (third column), TMEM106B over-expression alone (fourth column), and TMEM106B and C9orf72 concomitant over-expression (fifth column). All values are normalized to the endogenous condition (first column) and means ± SEM from nine replicates performed on three separate days are shown. In both HeLa (c) and HEK293 (d) cells, TMEM106B over-expression significantly increased LAMP1+ organelle size (p < 0.0001, left graph, compare first and second columns). In both cell types, however, knockdown of C9orf72 abrogated the effects of TMEM106B over-expression, resulting in a return of LAMP1+ organelle size toward that of the endogenous baseline (p < 0.001, left graph, comparing third column with second and fourth columns). ****p < 0.0001, ***p < 0.001.
Figure 8.
Figure 8.
Knockdown of C9orf72 mitigates TMEM106B-induced acidification defects and cytotoxicity. (a, b) Expression of wild-type TMEM106B in HeLa cells impairs lysosomal acidification, as demonstrated by decreased LysoTracker MFI. Concomitant siRNA knockdown of C9orf72 rescues this defect (bottom row). In contrast, treatment with control siRNA does not rescue this defect (top row). Representative images are shown in (a), and means ± SEM for eight replicates performed on 3 days are shown in (b). Myc-TMEM106B construct is expressed and detected by its myc tag. Cells over-expressing TMEM106B are highlighted by arrowheads. ****p < 0.0001. Scale bars = 10 μm. (c) TMEM106B over-expression induces cytotoxicity in HeLa cells, as quantified by LDH release over a 48-h time-course. Concomitant siRNA knockdown of C9orf72 abrogates cytotoxicity, whereas treatment with control siRNA does not. Means ± SEM for >12 replicates performed on 3 days shown, and cytotoxicity compared by two-way ANOVA. *p < 0.05.

References

    1. Neary D., Snowden J., Mann D. (2005) Frontotemporal dementia. Lancet Neurol., 4, 771–780. - PubMed
    1. Ratnavalli E., Brayne C., Dawson K., Hodges J.R. (2002) The prevalence of frontotemporal dementia. Neurology, 58, 1615–1621. - PubMed
    1. Baborie A., Griffiths T.D., Jaros E., McKeith I.G., Burn D.J., Richardson A., Ferrari R., Moreno J., Momeni P., Duplessis D, et al. (2011) Pathological correlates of frontotemporal lobar degeneration in the elderly. Acta Neuropathol., 121, 365–371. - PubMed
    1. DeJesus-Hernandez M., Mackenzie I.R., Boeve B.F., Boxer A.L., Baker M., Rutherford N.J., Nicholson A.M., Finch N.A., Flynn H., Adamson J, et al. (2011) Expanded GGGGCC hexanucleotide repeat in noncoding region of C9ORF72 causes chromosome 9p-linked FTD and ALS. Neuron, 72, 245–256. - PMC - PubMed
    1. Renton A.E., Majounie E., Waite A., Simon-Sanchez J., Rollinson S., Gibbs J.R., Schymick J.C., Laaksovirta H., van Swieten J.C., Myllykangas L, et al. (2011) A hexanucleotide repeat expansion in C9ORF72 is the cause of chromosome 9p21-linked ALS-FTD. Neuron, 72, 257–268. - PMC - PubMed

Publication types

MeSH terms