. 2016 Apr 29:7:11457.
doi: 10.1038/ncomms11457.

Asparagine promotes cancer cell proliferation through use as an amino acid exchange factor

Affiliations

Asparagine promotes cancer cell proliferation through use as an amino acid exchange factor

Abigail S Krall et al. Nat Commun. .

Abstract

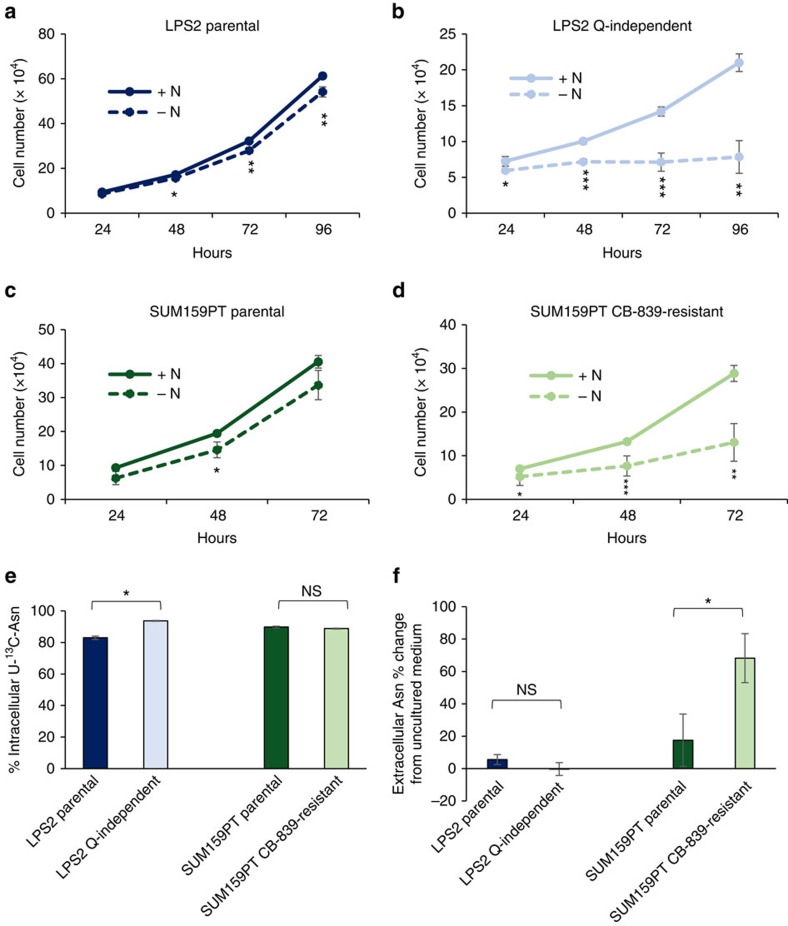
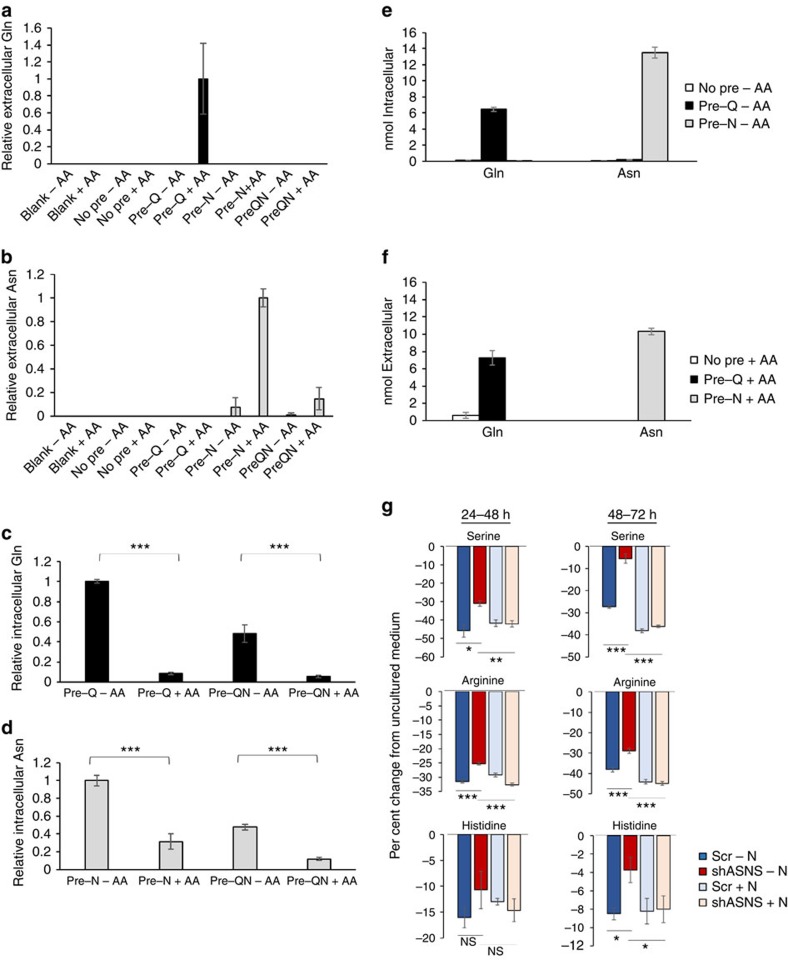
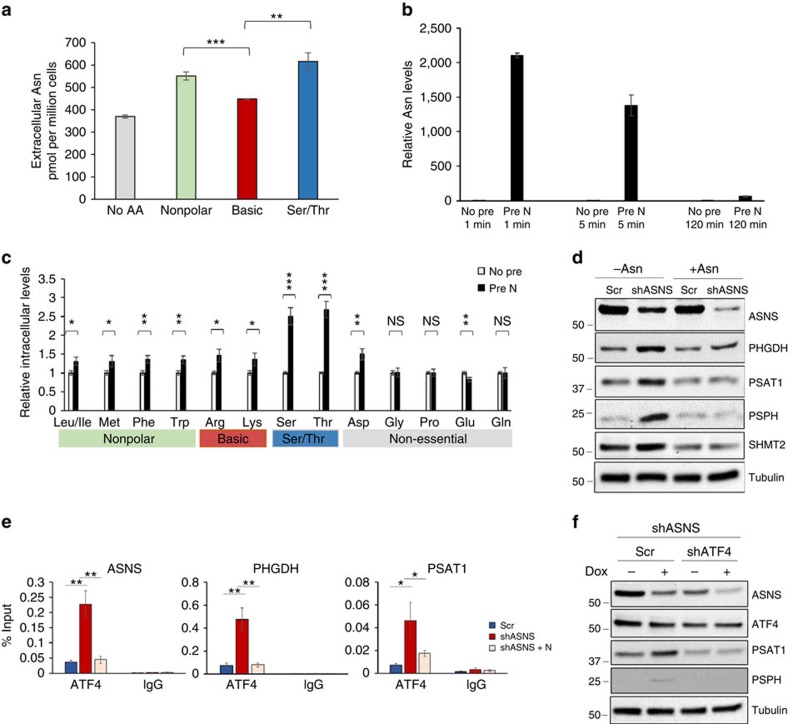
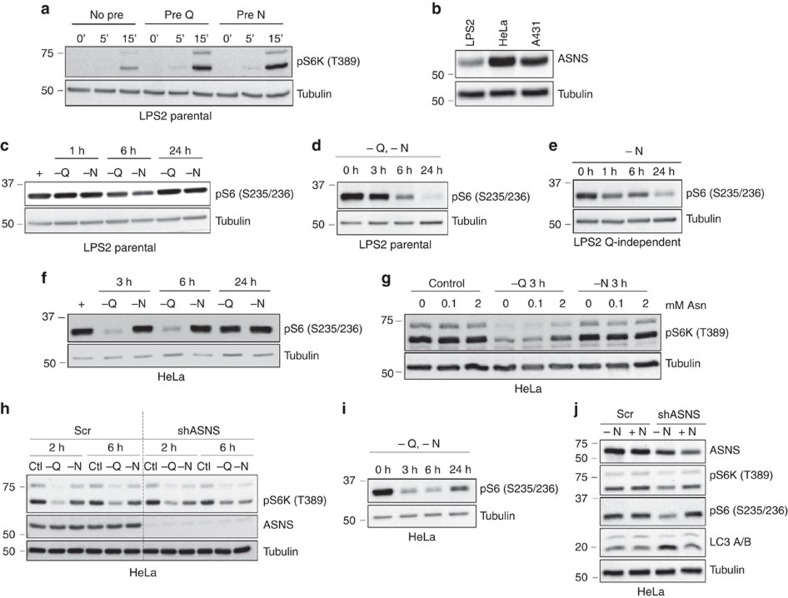
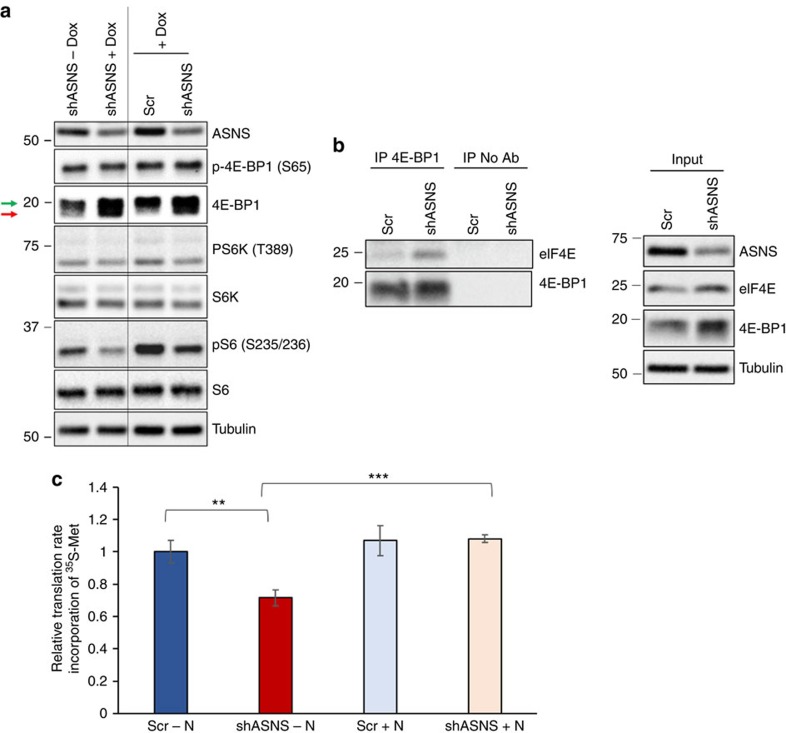
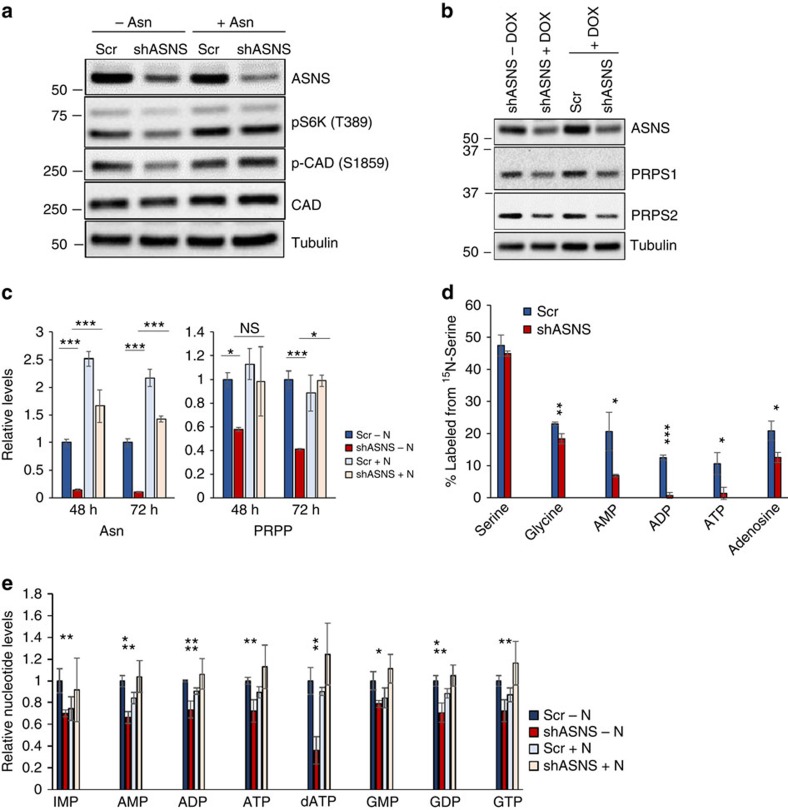
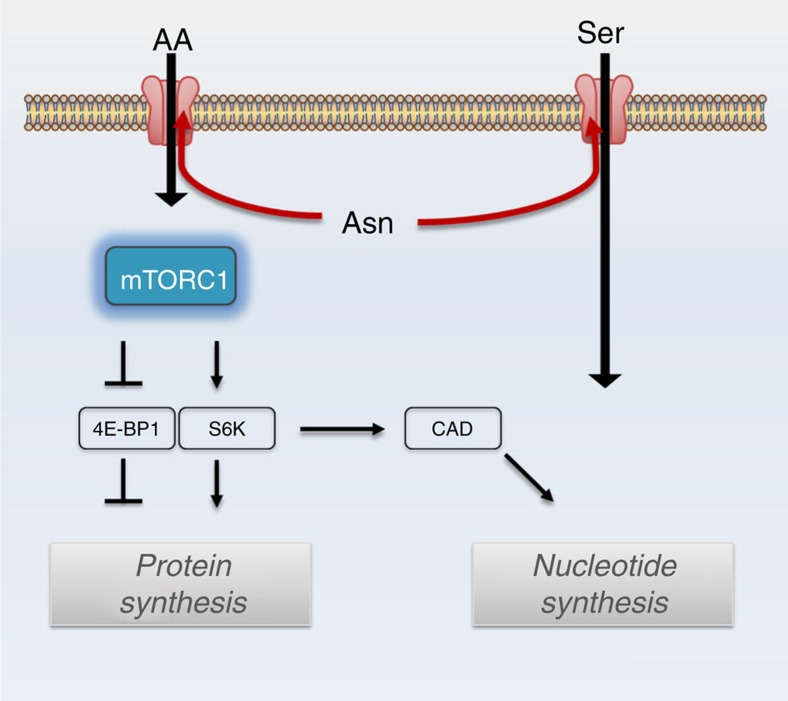
Cellular amino acid uptake is critical for mTOR complex 1 (mTORC1) activation and cell proliferation. However, the regulation of amino acid uptake is not well-understood. Here we describe a role for asparagine as an amino acid exchange factor: intracellular asparagine exchanges with extracellular amino acids. Through asparagine synthetase knockdown and altering of media asparagine concentrations, we show that intracellular asparagine levels regulate uptake of amino acids, especially serine, arginine and histidine. Through its exchange factor role, asparagine regulates mTORC1 activity and protein synthesis. In addition, we show that asparagine regulation of serine uptake influences serine metabolism and nucleotide synthesis, suggesting that asparagine is involved in coordinating protein and nucleotide synthesis. Finally, we show that maintenance of intracellular asparagine levels is critical for cancer cell growth. Collectively, our results indicate that asparagine is an important regulator of cancer cell amino acid homeostasis, anabolic metabolism and proliferation.


Figures

Figure 1
Figure 1. Resistance to glutamine withdrawal or glutaminase inhibition causes cellular asparagine dependence.
(ad) Proliferation curves of LPS2 parental, LPS2 glutamine (Q)-independent, SUM159PT parental and SUM159PT CB-839-resistant cells in the presence or absence of 0.1 mM asparagine (N) in the medium. (e) Percentages of intracellular 13C-labelled asparagine in LPS2 parental and glutamine-independent, as well as SUM159PT parental and CB-839-resistant cells labelled with U-13C-asparagine in the medium for 24 h, as determined by LC-MS. (f) The per cent change in medium asparagine levels as determined by LC-MS after 24-h incubation time for the indicated cells or for medium in an empty tissue culture plate (blank). Error bars denote s.d. of the mean (n=3). P values were calculated by the Student's t-test: *P<0.05; **P<0.01; ***P<0.001; NS, not significant.
Figure 2
Figure 2. Asparagine levels regulate cell proliferation.
(a) Relative growth rates of cancer cell lines stably expressing scrambled shRNA (Scr) or ASNS shRNA. Growth rates are normalized to the scrambled shRNA control for each cell line. (b) Immunoblot showing ASNS protein levels on stable expression of scrambled (Scr) or ASNS shRNA in cell lines shown in a. (c) Relative growth rates of HeLa cells stably expressing scrambled shRNA (Scr) or ASNS shRNA in the presence or absence of 0.1 mM asparagine. (d) Reaction catalysed by ASNS. Aspartate (Asp) and glutamine (Gln) are converted to asparagine (Asn) and glutamate (Glu). Error bars denote s.d. of the mean (n=3). P values were calculated by the Student's t-test: ***P<0.001; NS, not significant.
Figure 3
Figure 3. Asparagine is an amino acid exchange factor.
Relative glutamine (a) and asparagine (b) levels in the medium from LPS2 cells, as measured by LC-MS, before and after amino acid (AA) stimulation following pre-loading of the cells with glutamine (Q) and/or asparagine (N). Serum- and amino acid-starved LPS2 cells were pre-loaded with 2 mM glutamine, 2 mM asparagine or 2 mM glutamine and 2 mM asparagine for 60 min prior to stimulation for 30 min with an amino acid mixture (AA medium) lacking glutamine and asparagine. ‘Blank' indicates measurements from plates lacking cells. ‘No Pre' indicates measurements from plates of LPS2 cells not pre-loaded with glutamine or asparagine. Relative intracellular glutamine (c) and asparagine (d) levels as measured by LC-MS in glutamine- and/or asparagine-pre-loaded cells before and after amino acid stimulation. (e) Absolute quantification of intracellular glutamine and asparagine in pre-loaded cells prior to amino acid stimulation. (f) Absolute quantification of extracellular glutamine and asparagine following amino acid stimulation. (g) Changes in extracellular amino acid levels during a 24-h incubation with HeLa cells. The 24-h incubation began either 24 h (left panels) or 48 h (right panels) post doxycycline-induced expression of a scrambled shRNA (Scr) or ASNS shRNA. Values are shown as per cent change from amino acid measurements from identical medium incubated on plates lacking cells, with negative bars indicating cellular consumption and positive bars indicating production. For af, error bars denote s.d. of the mean (n=3). For g, error bars denote s.e.m. (n=6). P values were calculated by the Student's t-test: *P<0.05; **P<0.01; ***P<0.001. NS, not significant.
Figure 4
Figure 4. Asparagine levels regulate serine uptake and serine metabolism gene expression.
(a) Asparagine levels in the media, measured by LC-MS, from serum- and amino acid-starved LPS2 cells pre-loaded with asparagine (Pre N) and unstimulated (No AA) or stimulated with different amino acid sub-categories: non-polar, basic or Ser/Thr. Non-polar amino acids include leucine, isoleucine, methionine, tryptophan and phenylalanine; basic amino acids include lysine, arginine and histidine; Ser/Thr includes serine and threonine. (b) Relative intracellular asparagine levels in amino acid-starved glutamine-independent LPS2 cells as measured by LC-MS following 1-, 5- or 120-min stimulation with complete glutamine-free medium. Prior to stimulation, cells were either pre-loaded with asparagine (Pre N) or starve medium (No pre). Declining intracellular asparagine levels over time indicates exchange with extracellular amino acids. (c) Relative intracellular amino acid levels in amino acid-starved glutamine-independent LPS2 cells as measured by LC-MS following 5-min stimulation with complete glutamine-free medium. Prior to stimulation, cells were either pre-loaded with asparagine (Pre N) or starve medium (No pre). (d) Immunoblot showing serine synthesis pathway protein levels in HeLa cells, 48 h post doxycycline induction of scrambled shRNA or ASNS shRNA expression in the presence or absence of 0.1 mM exogenous asparagine. (e) Levels of ATF4 binding to the indicated gene by ChIP–qPCR in HeLa cells 48 h post doxycycline induction of scrambled shRNA or ASNS shRNA expression in the presence or absence of 0.1 mM exogenous asparagine. Chromatin was immunoprecipitated using anti-ATF4 antibody or IgG as a negative control. Values indicate amount of immunoprecipitated DNA as a percentage of input chromatin. (f) Immunoblot showing ASNS, ATF4, PSAT1 and PSPH protein levels with or without a 48-h doxycycline induction of ASNS shRNA in HeLa cells stably expressing scrambled or ATF4 shRNA. Error bars denote s.d. of the mean (n=3). P values were calculated by the Student's t-test: *P<0.05; **P<0.01; ***P<0.001. NS, not significant.
Figure 5
Figure 5. Asparagine regulates mTORC1 activation and autophagy.
(a) Immunoblotting of lysates from serum- and amino acid-starved LPS2 parental cells pre-loaded with starve medium (No pre), glutamine (Pre Q) or asparagine (Pre N), followed by amino acid stimulation for 0, 5 or 15 min. Lysates were probed with a phospho-specific antibody towards the mTOR target S6K at T389 and with anti-tubulin. (b) Immunoblot comparing ASNS levels in lysates from LPS2, HeLa and A431 cells under non-starved conditions. (c) Immunoblot showing phosphorylation of downstream mTOR effector S6 ribosomal protein (S235/236) following starvation of LPS2 parental cells of glutamine (−Q) or asparagine (−N) for the indicated times. ‘+' indicates no starvation. (d) Immunoblot showing S6 ribosomal protein phosphorylation (S235/236) following glutamine and asparagine starvation of LPS2 parental cells for the indicated times. (e) Immunoblot showing S6 ribosomal protein phosphorylation (S235/236) following asparagine starvation of LPS2 glutamine-independent cells for the indicated times. (f) Immunoblot showing S6 ribosomal protein phosphorylation (S235/236) following starvation of HeLa cells of glutamine (−Q) or asparagine (−N) for the indicated times. Prior to withdrawal, the medium contained 2 mM glutamine and 0.1 mM asparagine. (g) Immunoblot showing S6K phosphorylation (T389) following starvation of HeLa cells of glutamine (−Q) or asparagine (−N) for 3 h. Prior to starvation, cells were cultured for 7 days in DMEM supplemented with the indicated asparagine concentration. (h) Immunoblot showing phosphorylation of S6K (T389) in HeLa cells stably expressing scrambled shRNA or ASNS shRNA with and without (Ctl) starvation of glutamine (−Q) or asparagine (−N) for the indicated times. (i) Immunoblot showing S6 ribosomal protein phosphorylation (S235/236) following glutamine and asparagine starvation of HeLa cells for the indicated times. (j) Immunoblot of HeLa lysates 48 h post doxycycline-induced expression of scrambled shRNA or ASNS shRNA in asparagine-free DMEM (−N) or DMEM supplemented with 0.1 mM asparagine (+N). Lysates were immunoblotted for autophagy marker LC3-II (bottom band), mTOR activity markers pS6K and pS6, and tubulin.
Figure 6
Figure 6. Asparagine levels regulate mRNA translation.
(a) Immunoblot of HeLa lysates with (shASNS+Dox) and without (shASNS−Dox) a 48-h induction of ASNS shRNA expression and HeLa lysates 48 h after doxycycline induction of scrambled shRNA (Scr) or ASNS shRNA (shASNS). Lysates were immunoblotted for ASNS, phospho-4E-BP1 (S65), total 4E-BP1, phospho-S6K (T389), total S6K, phospho-S6 (S235/236), total S6 and tubulin. Green arrow indicates phosphorylated form of 4E-BP1; red arrow indicates unphosphorylated form. (b) Immunoblot showing levels of eIF4E and 4E-BP1 immunoprecipitated with anti-4E-BP1 antibody (left panels) and in the input lysate (right panels) from HeLa cells 48 h after doxycycline induction of scrambled shRNA (Scr) or ASNS shRNA (shASNS). (c) Relative rates of 35S-methionine incorporation into newly synthesized protein in HeLa cells 72 h after doxycycline induction of scrambled shRNA (Scr) or ASNS shRNA (shASNS). Error bars denote s.d. of the mean (n=3). P values were calculated by the Student's t-test: **P<0.01; ***P<0.001.
Figure 7
Figure 7. Asparagine levels regulate nucleotide synthesis.
(a) Immunoblot of HeLa lysates 48 h post doxycycline-induced expression of scrambled shRNA or ASNS shRNA in asparagine-free DMEM (−Asn) or DMEM supplemented with 0.1 mM asparagine (+Asn). Lysates were immunoblotted for mTOR activity marker pS6K, phospho-CAD (S1859), total CAD and tubulin. (b) Immunoblot of HeLa lysates with (shASNS+Dox) and without (shASNS−Dox) a 48-h induction of ASNS shRNA expression and HeLa lysates 48 h after doxycycline induction of scrambled shRNA (Scr) or ASNS shRNA (shASNS). Lysates were immunoblotted for ASNS, PRPS1, PRPS2 and tubulin. (c) Relative levels of asparagine and PRPP extracted from HeLa cells 48 and 72 h after doxycycline induction of scrambled shRNA (Scr) or ASNS shRNA expression as measured by LC-MS. (d) Percentages of the indicated metabolites labelled with 15 N extracted from HeLa cells labelled with exogenous 15 N-serine (50:50 15 N:14 N) for 24 h at 24 h post induction of scrambled shRNA (Scr) or ASNS shRNA expression. (e) Relative levels of the indicated intracellular metabolites extracted from HeLa cells 72 h after doxycycline induction of scrambled shRNA (Scr) or ASNS shRNA expression as measured by LC-MS. Error bars denote s.d. of the mean (n=3). P values were calculated by the Student's t-test: *P<0.05; **P<0.01; ***P<0.001. NS, not significant.
Figure 8
Figure 8. Asparagine coordinates protein and nucleotide synthesis.
Model illustrating asparagine contribution to protein synthesis and nucleotide synthesis. Intracellular asparagine exchanges with extracellular amino acids (AA), including serine (Ser), to coordinate protein and nucleotide synthesis.

References

    1. DeBerardinis R. J. et al. Beyond aerobic glycolysis: transformed cells can engage in glutamine metabolism that exceeds the requirement for protein and nucleotide synthesis. Proc. Natl Acad. Sci. USA 104, 19345–19350 (2007). - PMC - PubMed
    1. Chan W. K. et al. The glutaminase activity of L-asparaginase is not required for anticancer activity against ASNS-negative cells. Blood 123, 3596–3606 (2014). - PMC - PubMed
    1. Lorenzi P. L. et al. Asparagine synthetase is a predictive biomarker of L-asparaginase activity in ovarian cancer cell lines. Mol. Cancer Ther. 7, 3123–3128 (2008). - PMC - PubMed
    1. Holleman A. et al. Gene-expression patterns in drug-resistant acute lymphoblastic leukaemia cells and response to treatment. N. Engl. J. Med. 351, 533–542 (2004). - PubMed
    1. Zhang J. et al. Asparagine plays a critical role in regulating cellular adaptation to glutamine depletion. Mol. Cell 56, 205–218 (2014). - PMC - PubMed

Publication types

MeSH terms