. 2016 Oct;27(10):3051-3062.
doi: 10.1681/ASN.2015080886. Epub 2016 Apr 28.

Sex Differences in Renal Proximal Tubular Cell Homeostasis

Affiliations

Sex Differences in Renal Proximal Tubular Cell Homeostasis

Thomas Seppi et al. J Am Soc Nephrol. 2016 Oct.

Abstract

Studies in human patients and animals have revealed sex-specific differences in susceptibility to renal diseases. Because actions of female sex hormones on normal renal tissue might protect against damage, we searched for potential influences of the female hormone cycle on basic renal functions by studying excretion of urinary marker proteins in healthy human probands. We collected second morning spot urine samples of unmedicated naturally ovulating women, postmenopausal women, and men daily and determined urinary excretion of the renal tubular enzymes fructose-1,6-bisphosphatase and glutathione-S-transferase-α Additionally, we quantified urinary excretion of blood plasma proteins α1-microglobulin, albumin, and IgG. Naturally cycling women showed prominent peaks in the temporal pattern of urinary fructose-1,6-bisphosphatase and glutathione-S-transferase-α release exclusively within 7 days after ovulation or onset of menses. In contrast, postmenopausal women and men showed consistently low levels of urinary fructose-1,6-bisphosphatase excretion over comparable periods. We did not detect changes in urinary α1-microglobulin, albumin, or IgG excretion. Results of this study indicate that proximal tubular tissue architecture, representing a nonreproductive organ-derived epithelium, undergoes periodical adaptations phased by the female reproductive hormone cycle. The temporally delimited higher rate of enzymuria in ovulating women might be a sign of recurring increases of tubular cell turnover that potentially provide enhanced repair capacity and thus, higher resistance to renal damage.

Keywords: nonreproductive functions, urinary marker proteins, Fructose-1,6-bisphosphatase, menstrual cycle; renal proximal tubule cell, sex and gender difference, sex hormones.


Figures

Figure 1.
Figure 1.
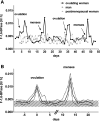
Sex and hormone status–specific differences in the time course of urinary F-1,6-BPase enzyme excretion. (A) Exemplary data series. Second morning urinary samples were collected daily and analyzed for F-1,6-BPase enzyme activity. A time course representative of ovulating women, men, and postmenopausal women is shown. F-1,6-BPase enzyme activity was normalized to urinary creatinine followed by correction for total body creatinine and expressed as units per hour. Ovulation days are labeled by arrows (ovulation) as indicated by the woman on the basis of basal body temperature charting combined with fertile cervical mucus observations. The days marked by arrows as menses were the recorded first days of menstrual flow. (B) Aligned F-1,6-BPase excretion profile. Urinary F-1,6-BPase excretion (units per hour) of ovulating women was measured daily and aligned to the days of the F-1,6-BPase peak maxima associated with ovulation or menses. Peak maxima in the F-1,6-BPase time course were identified as the two maximal values within one cycle length not within 4 days. The analysis window was then shifted over the entire dataset, allowing the identification of F-1,6-BPase peaks within uncompleted menstrual cycles at the beginning or the end of the data series as well. Day 0 was designated as the day of the F-1,6-BPase peak maximum associated with ovulation. The menstrual F-1,6-BPase peaks were aligned to day 13, accounting for the median distance of ovulatory to menstrual F-1,6-BPase peaks (range =10–16). The graph represents the median (solid line) and the 25th and 75th percentiles (dashed lines) of the aligned datasets. The range between the 25th and 75th percentiles of urinary F-1,6-BPase excretion from postmenopausal women and men is shown as the hatched area.
Figure 2.
Figure 2.
Frequency of F-1,6-BPase peak detection on each day of the menstrual cycle. (A) Relation between days of F-1,6-BPase peak maxima and the day of ovulation. Daily second morning urinary samples of ovulating women were analyzed for F-1,6-BPase enzyme activity normalized to urinary creatinine. F-1,6-BPase peak maxima were defined as the two maxima within a menstrual cycle length, shifting the analysis window over the dataset. The F-1,6-BPase peak days were aligned to the day of ovulation (day 0). The graph represents the count of F-1,6-BPase peak maxima identified on the respective days after ovulation. The dashed line (day 14) represents the median start day of the next cycle marked by the beginning of menstrual flow. (B) Relation between all days within F-1,6-BPase peaks and the day of ovulation. Peak maxima were identified as described in A. The same data series as in A is represented, with the difference that days in addition to the peak maxima were defined as peak days if the next highest F-1,6-BPase values in the analysis window preceded or followed the peak maxima. Thus, not only peak maxima but all of the days within an F-1,6-BPase peak are represented. The dashed line (day 14) represents the median start day of the next cycle marked by the beginning of menstrual flow.
Figure 3.
Figure 3.
F-1,6-BPase peak distances and follicular/luteal phase lengths. (A) Analysis of the distance between consecutive F-1,6-BPase peak maxima in ovulating women. F-1,6-BPase peak maxima were defined as the two maxima within a menstrual cycle length in the time course profiles of urinary F-1,6-BPase excretion obtained from ovulating women, shifting the analysis window over the dataset. Peak distance was defined as days between consecutive F-1,6-BPase peaks, excluding the peak days themselves. Ovulation to menses–associated F-1,6-BPase peak distance (ov-menses) and menses to ovulation–associated F-1,6-BPase peak distance (menses-ov) are shown. The box plots represent the medians and 25th and 75th percentiles, with outliers showing maximal and minimal values. (B) Correlation of the F-1,6-BPase peak maxima distances and the follicular or luteal phase lengths of ovulating women. The distance between consecutive F-1,6-BPase peak maxima of ovulating women was determined as described in A (x axis). The corresponding follicular or luteal phase length is shown on the y axis. The individual data points and the least square linear regression line (solid line) with the 95% confidence bands of the best fit line (dashed lines) are shown. A Pearson correlation analysis was performed, revealing a significant correlation at P<0.05 shown by the correlation coefficient r marked by an asterisk.
Figure 4.
Figure 4.
Quantitative comparison of maximal and basal F-1,6-BPase excretion in urines of ovulating women, postmenopausal women, and men. Daily second morning urinary samples were analyzed for F-1,6-BPase enzyme activity normalized to urinary creatinine followed by correction for total body creatinine and expressed as units per hour. F-1,6-BPase maxima were defined as the two maxima within a menstrual cycle length in ovulating women or 29 days in postmenopausal women or men. Urinary F-1,6-BPase enzymatic activity measured on maxima was compared between ovulating women, postmenopausal women, and men (left panel). Basal excretion rates were obtained from datasets excluding maxima ±3 days (right panel). Data are represented as box plots with medians and 25th and 75th percentiles; outliers show maximal and minimal values. Groups were compared by the nonparametric Kruskal–Wallis test followed by the Dunn post-test. Postmenopausal women were defined as the reference group. *Statistically significant differences to this group (P<0.05).
Figure 5.
Figure 5.
Urinary excretion of GSTα, α1-microglobulin, albumin, and IgG on F-1,6-BPase peak and nonpeak days in ovulating women. Urinary protein concentrates from ovulating women obtained by ultrafiltration were grouped into peak and nonpeak according to their time profile of urinary F-1,6-BPase enzyme activity. F-1,6-BPase peak maxima (peak) were defined as the two maxima within a menstrual cycle length. Days outside the F-1,6-BPase peaks (±3 days) were designated nonpeak. The thus–identified peak and nonpeak samples were used to measure GSTα, α1-microglobulin, albumin, and IgG. Proteins are expressed as micrograms per hour or milligrams per hour obtained by referencing urinary creatinine followed by correction with the proband–specific creatinine excretion rate. The data are represented as box plots with medians and 25th and 75th percentiles, with the outliers showing maximal and minimal values. *Statistically significant differences (P<0.05) between measurements on peak and nonpeak days were determined by the nonparametric Mann–Whitney test.
Figure 6.
Figure 6.
Hypothetical model. (A and B) Daily urinary estrone-3-glucuronide and pregnanedione-3-glucuronide profile in ovulating women. Daily second morning urinary sample sets of two ovulating women encompassing six menstrual cycles were analyzed for estrone-3-glucuronide and pregnanedione-3-glucuronide concentrations normalized to urinary creatinine followed by correction for total body creatinine. The medians (solid lines) and 25th and 75th percentiles (dashed lines) of estrone-3-glucuronide and pregnanedione-3-glucuronide measurements (nanomoles per hour) are shown in A and B, respectively. The results match published urinary estrone-3-glucuronide and pregnanedione-3-glucuronide profiles of ovulating women without reproductive impairment, which were shown to correlate with the respective plasma concentrations of the active hormones. Ovulation day is set as day 0. Day 14 represents the median first day of menstrual flow, marking the beginning of the next menstrual cycle. The hatched areas represent the two time windows, in which the F-1,6-BPase peaks were exclusively detected. Both phases are characterized by a preceding drop of the estrogen level. (C) The graph represents a hypothetical model developed to provide a potential explanation for the observed increase of urinary F-1,6-BPase in correlation with ovulation and menses. The schematic represents the proximal tubular epithelium with cells linked through junctional complexes. F-1,6-BPase within the cells represents intracellular cytoplasmatic expression of F-1,6-BPase, which is released into the urine on plasma membrane damage. Because estrogen was proposed to act as a proproliferative and antiapoptotic factor on tubular epithelium,,, a decline of the estrogen level even if partial—might lead to an increased cell death rate, restoring original cell numbers again.
Figure 7.
Figure 7.
Enzyme release from renal proximal tubular LLC-PK1 monolayers after a proliferative stimulus in vitro. Renal proximal tubular LLC-PK1 cells were cultivated in vitro in FBS-containing medium until confluence. After a day in serum-free medium, the cells were treated with 100 ng/ml EGF, which induced an additional proliferative boost within the monolayer. Cells in S phase were increased (12.6%±1.6%) after 24 hours of EGF treatment versus time-matched controls without EGF treatment (4.8%±1.3%) shown by us in a previous publication. Release of intracellular enzymes by dead cells was quantified by measuring the enzymatic activity of LDH in the cell culture supernatant medium. Medium was collected before starting EGF treatment (before), during EGF treatment (during), and 1 or 2 days after EGF treatment (1 day after and 2 days after, respectively). Controls were exposed to the same medium without EGF for the same time. Data are expressed as fold over time-matched controls. Means±SDs of data measured in duplicates from five cell culture wells are shown. *Statistically significant difference to time-matched control at P<0.05 determined by an unpaired t test.

Comment in

References

    1. Committee on Understanding the Biology of Sex and Gender Differences : Board on Health Sciences Policy: Exploring the Biological Contributions to Human Health: Does Sex Matter?, Washington, DC, National Academies Press, 2001 - PubMed
    1. Anonymous: Putting gender on the agenda. Nature 465: 665, 2010 - PubMed
    1. Anonymous: NIH Policy and Guidelines on the Inclusion of Women and Minorities as Subjects in Clinical Research, 2001. Available at: http://grants.nih.gov/grants/funding/women_min/guidelines_amended_10_200.... Accessed May 4, 2015
    1. United States Renal Data System: 2014 USRDS Annual Data Report: An Overview of the Epidemiology of Kidney Disease in the United States, 2014. Available at: http://www.usrds.org. Accessed November 30, 2014
    1. Kramer A, Stel V, Zoccali C, Heaf J, Ansell D, Grönhagen-Riska C, Leivestad T, Simpson K, Pálsson R, Postorino M, Jager K ERA-EDTA Registry : An update on renal replacement therapy in Europe: ERA-EDTA Registry data from 1997 to 2006. Nephrol Dial Transplant 24: 3557–3566, 2009 - PubMed

LinkOut - more resources