

Transcriptome response to temperature stress in the wolf spider Pardosa pseudoannulata (Araneae: Lycosidae)
- PMID: 27127612
- PMCID: PMC4842027
- DOI: 10.1002/ece3.2142
Transcriptome response to temperature stress in the wolf spider Pardosa pseudoannulata (Araneae: Lycosidae)
Abstract
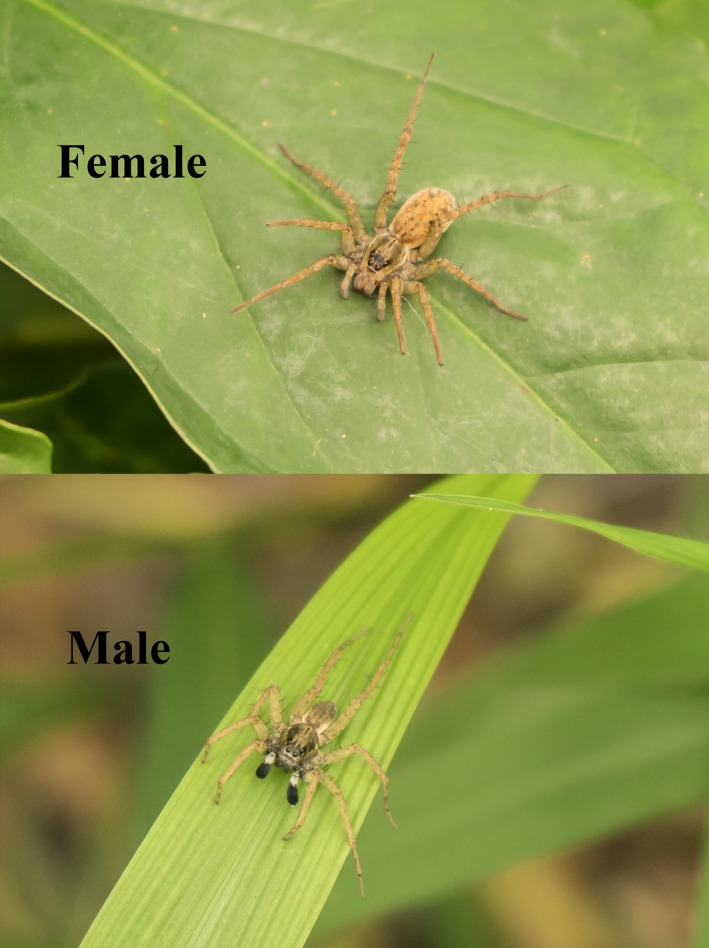
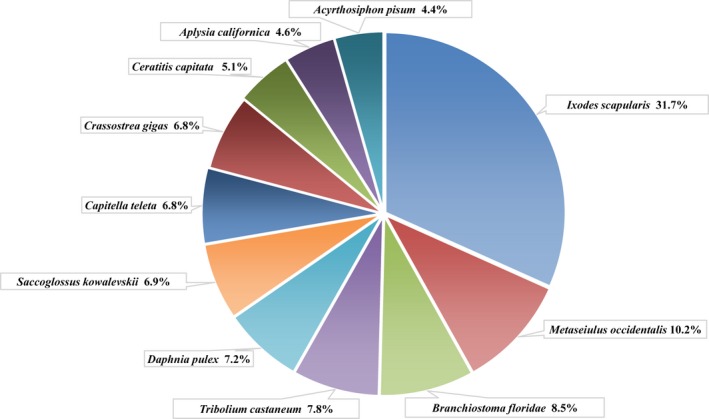
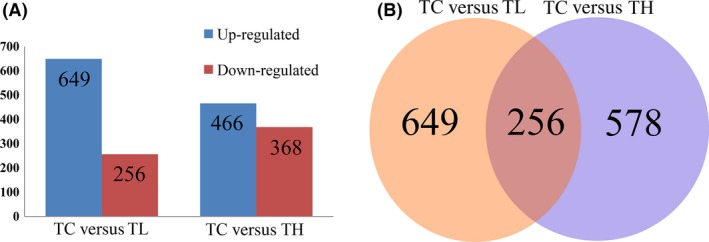
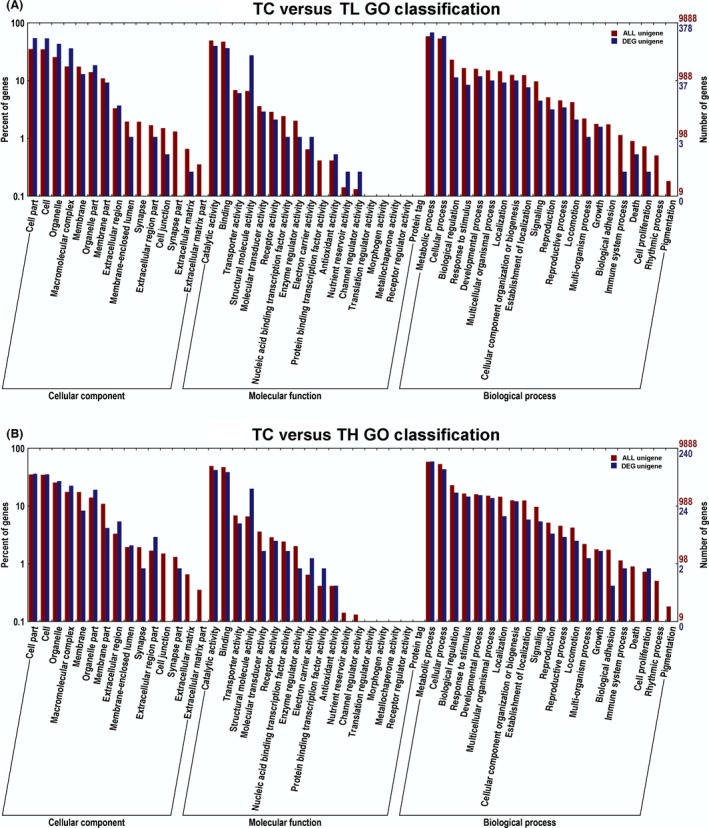
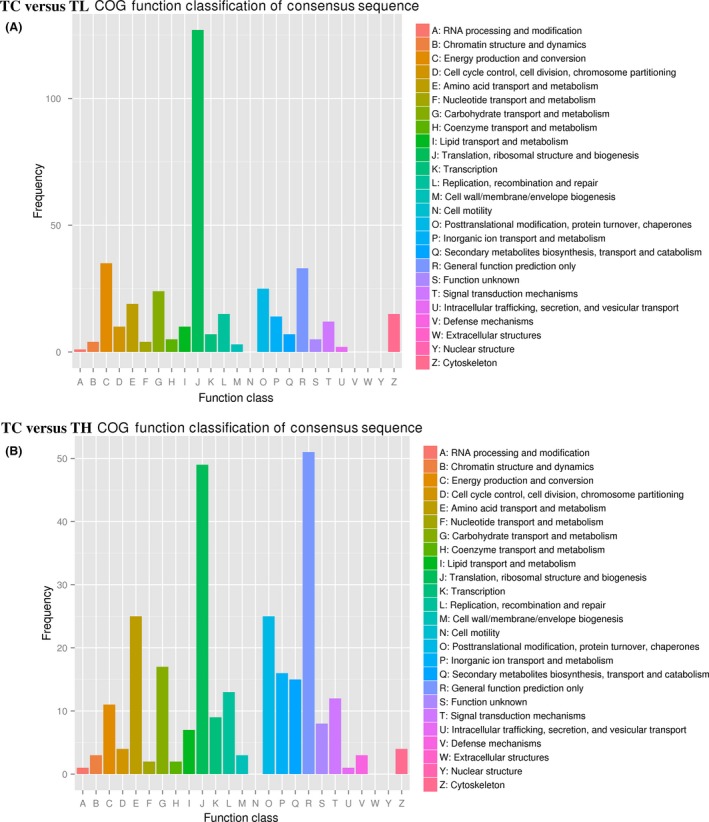
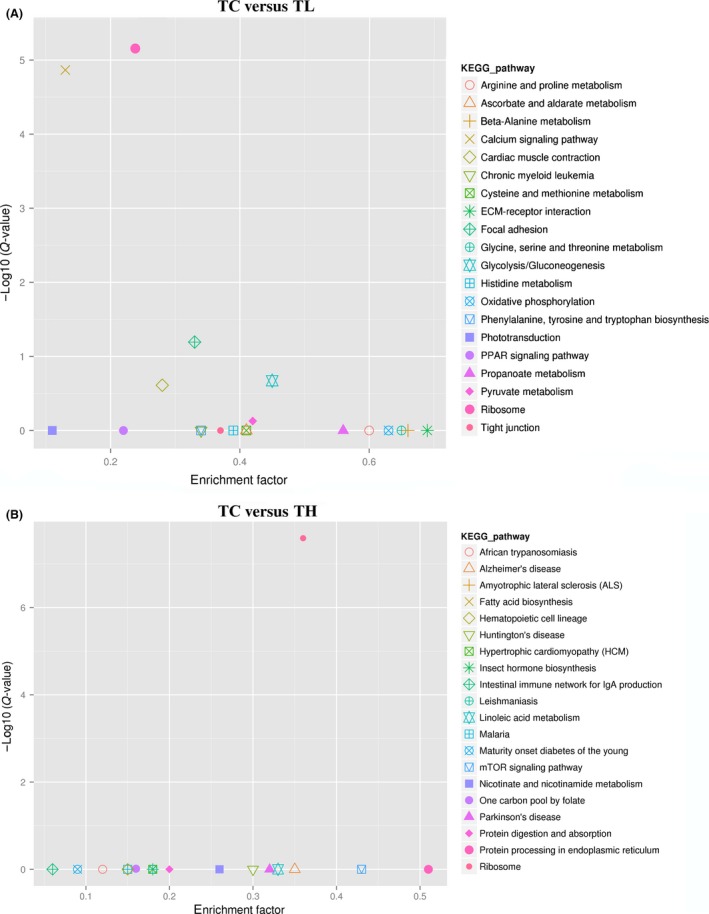
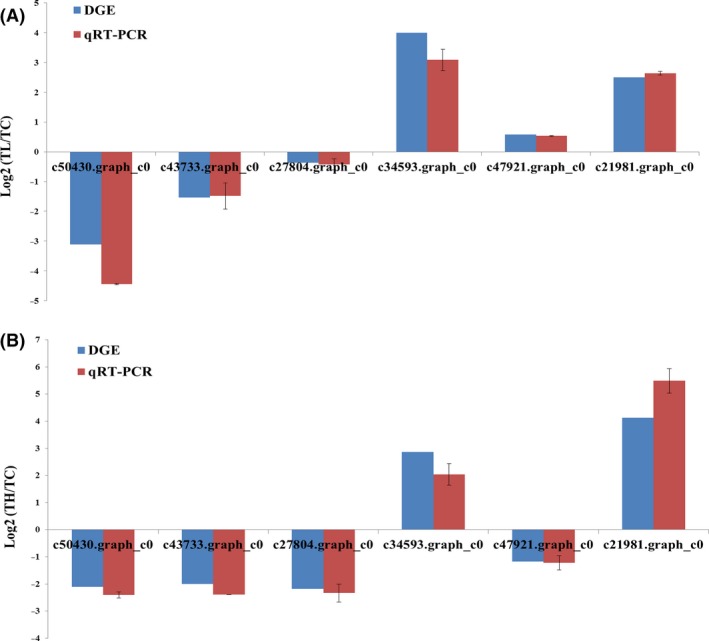
The wolf spider Pardosa pseudoannulata is a dominant predator in paddy ecosystem and an important biological control agent of rice pests. Temperature represents a primary factor influencing its biology and behavior, although the underlying molecular mechanisms remain unknown. To understand the response of P. pseudoannulata to temperature stress, we performed comparative transcriptome analyses of spider adults exposed to 10°C and 40°C for 12 h. We obtained 67,725 assembled unigenes, 21,765 of which were annotated in P. pseudoannulata transcriptome libraries, and identified 905 and 834 genes significantly up- or down-regulated by temperature stress. Functional categorization revealed the differential regulation of transcription, signal transduction, and metabolism processes. Calcium signaling pathway and metabolic pathway involving respiratory chain components played important roles in adapting to low temperature, whereas at high temperature, oxidative phosphorylation and amino acid metabolism were critical. Differentially expressed ribosomal protein genes contributed to temperature stress adaptation, and heat shock genes were significantly up-regulated. This study represents the first report of transcriptome identification related to the Araneae species in response to temperature stress. These results will greatly facilitate our understanding of the physiological and biochemical mechanisms of spiders in response to temperature stress.
Keywords: Gene regulation; Pardosa pseudoannulata; temperature stress; transcriptome; wolf spider.
Figures
Similar articles
-
Impact of triclocarban exposure on development and gene expression in the wolf spider, Pardosa pseudoannulata (Araneae: Lycosidae).Comp Biochem Physiol Part D Genomics Proteomics. 2025 Jun;54:101413. doi: 10.1016/j.cbd.2025.101413. Epub 2025 Jan 10. Comp Biochem Physiol Part D Genomics Proteomics. 2025. PMID: 39817944
-
The complete mitogenome of the pond wolf spider Pardosa pseudoannulata, with phylogenetic implications for the Lycosidae.Mitochondrial DNA B Resour. 2024 Apr 10;9(4):475-478. doi: 10.1080/23802359.2024.2337791. eCollection 2024. Mitochondrial DNA B Resour. 2024. PMID: 38617814 Free PMC article.
-
Transcriptome Profiling Analysis of Wolf Spider Pardosa pseudoannulata (Araneae: Lycosidae) after Cadmium Exposure.Int J Mol Sci. 2016 Dec 3;17(12):2033. doi: 10.3390/ijms17122033. Int J Mol Sci. 2016. PMID: 27918488 Free PMC article.
-
Transcriptome assembly and expression profiling of the molecular responses to cadmium toxicity in cerebral ganglia of wolf spider Pardosa pseudoannulata (Araneae: Lycosidae).Ecotoxicology. 2018 Mar;27(2):198-208. doi: 10.1007/s10646-017-1885-1. Epub 2018 Jan 3. Ecotoxicology. 2018. PMID: 29299797 Free PMC article.
-
Three Heat Shock Protein Genes and Antioxidant Enzymes Protect Pardosa pseudoannulata (Araneae: Lycosidae) from High Temperature Stress.Int J Mol Sci. 2022 Oct 24;23(21):12821. doi: 10.3390/ijms232112821. Int J Mol Sci. 2022. PMID: 36361611 Free PMC article.
Cited by
-
Ecdysteroid responses to urban heat island conditions during development of the western black widow spider (Latrodectus hesperus).PLoS One. 2022 Apr 28;17(4):e0267398. doi: 10.1371/journal.pone.0267398. eCollection 2022. PLoS One. 2022. PMID: 35482802 Free PMC article.
-
Comparative transcriptome analysis of Glyphodes pyloalis Walker (Lepidoptera: Pyralidae) reveals novel insights into heat stress tolerance in insects.BMC Genomics. 2017 Dec 19;18(1):974. doi: 10.1186/s12864-017-4355-5. BMC Genomics. 2017. PMID: 29258441 Free PMC article.
-
Genetic Constraints, Transcriptome Plasticity, and the Evolutionary Response to Climate Change.Front Genet. 2020 Sep 18;11:538226. doi: 10.3389/fgene.2020.538226. eCollection 2020. Front Genet. 2020. PMID: 33193610 Free PMC article.
-
The critical role of arachidonic acid on molting in spiders.Curr Zool. 2024 Sep 24;71(3):373-380. doi: 10.1093/cz/zoae056. eCollection 2025 Jun. Curr Zool. 2024. PMID: 40620588 Free PMC article.
-
The effects of prey lipid on female mating and reproduction of a wolf spider.Curr Zool. 2022 Feb 3;68(6):726-733. doi: 10.1093/cz/zoac003. eCollection 2022 Dec. Curr Zool. 2022. PMID: 36743223 Free PMC article.
References
-
- Addo‐Bediako, A. , Chown S. L., and Gaston K. J.. 2002. Metabolic cold adaptation in insects: a large‐scale perspective. Funct. Ecol. 16:332–338.
-
- Alexa, A. , Rahnenführer J., and Lengauer T.. 2006. Improved scoring of functional groups from gene expression data by decorrelating GO graph structure. Bioinformatics 22:1600–1607. - PubMed
-
- Barrion, A. T. , and Litsinger J. A.. 1995. Riceland spiders of south and Southeast Asia. International Rice Research Institute, Los Baños, Philippines.
-
- Benjamini, Y. , and Hochberg Y.. 1995. Controlling the false discovery rate: a practical and powerful approach to multiple testing. J. R. Stat. Soc. Series B Stat. Methodol. 57:289–300.
-
- Chang, Z. 2009. Posttranslational modulation on the biological activities of molecular chaperones. Sci. China, Ser. C Life Sci. 52:515–520. - PubMed
LinkOut - more resources
Full Text Sources
Other Literature Sources
