Review
. 2016 Apr 7:5:F1000 Faculty Rev-599.
doi: 10.12688/f1000research.7134.1. eCollection 2016.

Advances in understanding - genetic basis of intellectual disability

Affiliations
Review

Advances in understanding - genetic basis of intellectual disability

Pietro Chiurazzi et al. F1000Res. .

Abstract

Intellectual disability is the most common developmental disorder characterized by a congenital limitation in intellectual functioning and adaptive behavior. It often co-occurs with other mental conditions like attention deficit/hyperactivity disorder and autism spectrum disorder, and can be part of a malformation syndrome that affects other organs. Considering the heterogeneity of its causes (environmental and genetic), its frequency worldwide varies greatly. This review focuses on known genes underlying (syndromic and non-syndromic) intellectual disability, it provides a succinct analysis of their Gene Ontology, and it suggests the use of transcriptional profiling for the prioritization of candidate genes.


Conflict of interest statement

Competing interests: The authors declare that they have no competing interests.

No competing interests were disclosed.

Figures

Figure 1.
Figure 1.. Bar graph illustrating the number of publications per year from 2007 to 2015 obtained with the PubMed search “(intellectual disability OR mental retardation) AND (next-generation sequencing OR exome sequencing)”.
Figure 2.
Figure 2.. Schematic representation of neurodevelopmental stages, related to genetic and environmental factors and their time window.
*For genetic factors, the onset of symptoms or time of detection is shown. Modified from .
Figure 3.
Figure 3.. Counts of the major terms describing impaired development of cognitive functions in OMIM.
The largest number indicated in black on the upper left of each term is the total number of counts without any limits, whereas the number of entries with the term specified in the Clinical Synopsis is indicated in blue on the lower left. To the right of each term are the counts of entries containing the term linked to at least one gene (upper right with a pound prefix [#], in black) and all entries containing the term in their Clinical Synopsis AND being linked to at least one gene (lower right with a pound prefix [#], in red). OMIM, Online Mendelian Inheritance in Man.
Figure 4.
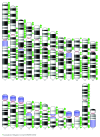
Figure 4.. Mapping of the intellectual disability genes on the human karyogram (G-banded) using the Genome Decoration page at National Center for Biotechnology Information.
See website at http://www.ncbi.nlm.nih.gov/genome/tools/gdp. Please note that genes causing ID tend to concentrate in G-negative bands, like all other genes. CI, cognitive impairment; DD, developmental delay; ID, intellectual disability; MR, mental retardation.
Figure 5.
Figure 5.. Distribution of intellectual disability genes per chromosome and comparison with the total amount of protein-coding and non-coding genes located on each chromosome.
longnc, long non-coding; Mb, megabase; miscnc, miscellaneous non-coding; MR/ID, known mental retardation/intellectual disability genes; shortnc, short non-coding.
Figure 6.
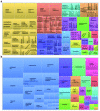
Figure 6.. REViGO tree analysis of over-represented Gene Ontology terms obtained with DAVID and associated with the 818 intellectual disability genes.
Panel ( a) shows Biological Process terms and panel ( b) shows Cellular Component terms. DAVID, Database for Annotation, Visualization, and Integrated Discovery; REViGO, Reduce + Visualize Gene Ontology.
Figure 7.
Figure 7.. REViGO tree analysis of over-represented Gene Ontology (GO) terms obtained with DAVID.
Panel ( a) shows GO (Biological Process) terms associated with the 86 intellectual disability (ID) genes with a Brain ratio of 2 or more, while panel ( b) shows GO (Biological Process) terms associated with the 64 ID genes with a Fetal Brain ratio of 2 or more. DAVID, Database for Annotation, Visualization, and Integrated Discovery; REViGO, Reduce + Visualize Gene Ontology.

References

    1. Maulik PK, Harbour CK: Epidemiology of Intellectual Disability. In: JH Stone, M Blouin, editors. International Encyclopedia of Rehabilitation2010. Reference Source
    1. Beange H, Taplin JE: Prevalence of intellectual disability in northern Sydney adults. J Intellect Disabil Res. 1996;40(Pt 3):191–197. 10.1046/j.1365-2788.1996.769769.x - DOI - PubMed
    1. Leonard H, Petterson B, Bower C, et al. : Prevalence of intellectual disability in Western Australia. Paediatr Perinat Epidemiol. 2003;17(1):58–67. 10.1046/j.1365-3016.2003.00469.x - DOI - PubMed
    1. Carey JC: Abbreviations and terminology surrounding autism spectrum disorders and intellectual disability. Am J Med Genet A. 2011;155A(12):2905. 10.1002/ajmg.a.34319 - DOI - PubMed
    1. Chiurazzi P: Mental retardation: is naming the real issue? Am J Med Genet A. 2011;155A(5):974–975. 10.1002/ajmg.a.33950 - DOI - PubMed

LinkOut - more resources