. 2016 Jun 7;7(23):34630-42.
doi: 10.18632/oncotarget.8969.

S100A4 drives non-small cell lung cancer invasion, associates with poor prognosis, and is effectively targeted by the FDA-approved anti-helminthic agent niclosamide

Affiliations

S100A4 drives non-small cell lung cancer invasion, associates with poor prognosis, and is effectively targeted by the FDA-approved anti-helminthic agent niclosamide

Rachel L Stewart et al. Oncotarget. .

Abstract

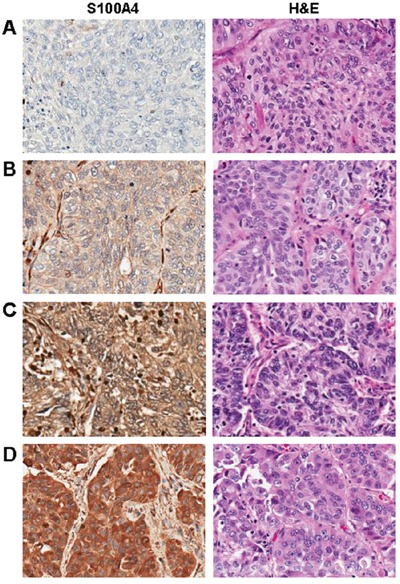
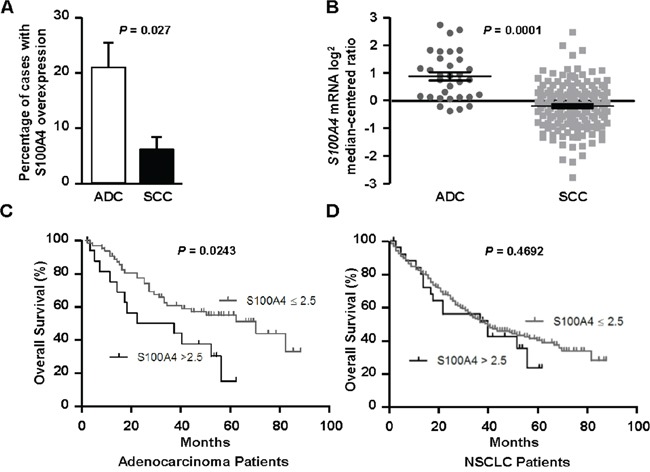
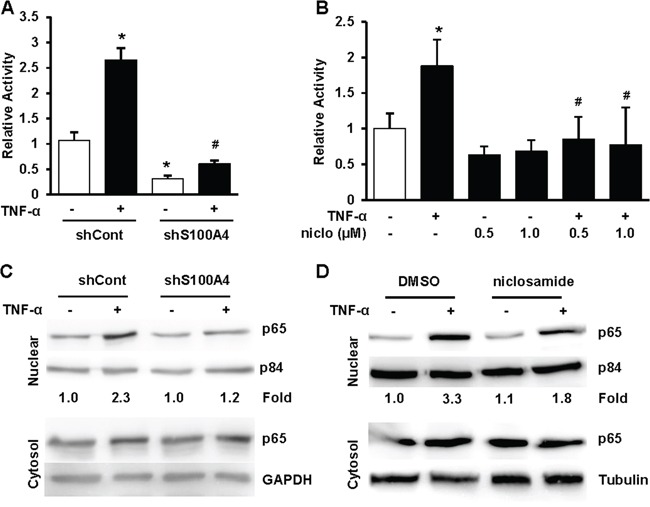
S100A4 (metastasin-1), a metastasis-associated protein and marker of the epithelial to mesenchymal transition, contributes to several hallmarks of cancer and has been implicated in the progression of several types of cancer. However, the impacts of S100A4 signaling in lung cancer progression and its potential use as a target for therapy in lung cancer have not been properly explored. Using established lung cancer cell lines, we demonstrate that S100A4 knockdown reduces cell proliferation, invasion and three-dimensional invasive growth, while overexpression of S100A4 increases invasive potential. In patient-derived tissues, S100A4 is preferentially elevated in lung adenocarcinoma. This elevation is associated with lymphovascular invasion and decreased overall survival. In addition, depletion of S100A4 by shRNA inhibits NF-κB activity and decreases TNFα-induced MMP9 expression. Furthermore, inhibition of the NF-κB/MMP9 axis decreases lung carcinoma invasive potential. Niclosamide, a reported inhibitor of S100A4, blocks expression and function of S100A4 with a reduction in proliferation, invasion and NF-κB-mediated MMP9 expression. Collectively, this study highlights the importance of the S100A4/NF-κB/MMP9 axis in lung cancer invasion and provides a rationale for targeting S100A4 to combat lung cancer.

Keywords: FSP-1; MMP9; NF-κB; NSCLC; metastasin-1.


Conflict of interest statement

The authors have no conflicts of interest to declare.

Figures

Figure 1
Figure 1. S100A4 drives the invasive potential of lung cancer cells
A and B. Lung cancer cells as indicated were lysed in RIPA buffer, total cell lysates (80μg) were subjected to 15% SDS-PAGE, transferred and immunoblotted with rabbit anti-S100A4 antibody (A). RNA was isolated from cells and quantitative real time PCR (Q-PCR) was used to assess S100A4 expression levels (B). C-G. A549 cells with stable knockdown of S100A4 by shRNA targeting S100A4 (shS100A4) or expressing a non-targeting control (shCont) were generated. S100A4 expression was assessed by immunoblot analysis (C) and Q-PCR (D). Cell proliferation in standard (2D) culture was assessed by MTT (E). Cells were grown in 3D Matrigel for 5 days and representative phase contrast images for control and knockdown cells are shown (F). The diameter of 70-120 colonies from randomly chosen fields was measured, quantified for average colony volume and presented in (G). H-J. H1299 cells, stably transfected with pIRES-GFP-S100A4 (GFP-S100A4) or pIRES-GFP alone (GFP), were assessed for S100A4 expression by immunoblot analysis (H) or for invasion toward 1% FBS overnight (I) or grown in 3D Matrigel for 5 days (J). Representative data from at least three independent experiments are shown. Error bars represent the SEM of the mean in (G) and the SD of the mean from at least three replicates in (B, D, E and I). Arrows indicate invasive growth. Scale bar in (F and J) = 50μm. * indicates p<0.05.
Figure 2
Figure 2. S100A4 expression patterns in non-small cell lung carcinoma
A-D. Examples of negative (A), weak (B), moderate (C), and strong (D) S100A4 expression in non-small cell lung cancers (left panels), with corresponding hematoxylin and eosin stained (H&E) sections (right panels). Magnification = 200X for all images.
Figure 3
Figure 3. S100A4 is overexpressed in lung adenocarcinoma, where it associates with decreased overall survival
A-D. Using semi-quantitative IHC data from our TMA, we found that S100A4 levels were significantly elevated in adenocarcinoma (ADC) when compared to squamous cell carcinoma (SCC, A), which was confirmed using an external gene expression dataset (B). In patients with lung adenocarcinoma, elevated expression of S100A4 (>2.5) correlated with shorter median survival (C). A significant relationship between elevated S100A4 expression and overall survival was not identified when examining all histologic subtypes (NSCLC) combined (D).
Figure 4
Figure 4. Niclosamide decreases S100A4 expression, lung cancer cell proliferation, invasion and invasive growth
A and B. A549 cells were treated with niclosamide at the indicated concentrations for 72 hrs, and S100A4 expression was assessed by Q-PCR (A) or immunoblotting analysis (B). C and D. Cells were treated with varied concentrations of niclosamide for 1-5 days and then cell number assessed by either direct cell count (C, H358) or MTT assay at various time intervals (D, A549). E. A549 cells were treated with niclosamide at the indicated concentrations for 3 days, trypsinized and assessed for EGF-stimulated (5 ng/ml) Matrigel invasion in the presence or absence of niclosamide. F, G. A549 cells were cultured in 3D Matrigel with or without 1 μM niclosamide for 6 days. Representative phase contrast images are shown (F). The diameter of 70-120 colonies from randomly chosen fields was measured, quantified for average individual colony volume (G). Representative data from at least three independent experiments are shown. Error bars represent the SEM of the mean in (G) and the SD of the mean from at least three replicates in (A, C, D and E). Scale bar in (F) = 100 μm. * indicates p<0.005. ** indicates p<0.0001.
Figure 5
Figure 5. Inhibition of S100A4 decreases NF-κB activity
A and B. A549 shCont and shS100A4 cells (A) or A549 parental cells (B) were transfected with NF-κB firefly luciferase reporter and TK-renilla luciferase control, treated with 5 ng/ml TNF-α with or without niclosamide at indicated concentrations for 24 hrs before harvesting for Dual luciferase activity assays. C. A549 shCont and shS100A4 cells (C) were serum starved overnight, then stimulated with 5 ng/ml TNF-α for 4 hrs before harvesting for cell fractionation. D. A549 parental cells were treated with 0.5 μM niclosamide for 48 hrs, serum starved in the presence or absence of niclosamide overnight, then stimulated with 5 ng/ml TNF-α for 4 hrs before harvesting for cell fractionation. Nucleic and cytosolic proteins were separated by SDS-PAGE, transferred and probed for p65, p84 and GAPDH. Representative data from at least three independent experiments are shown. Error bars represent the SD of the mean from three replicates. (*) and (#) in (A) indicate p<0.05 compared to control and TNF-α treated shCont cells, respectively. (*) and (#) in (B) indicate p<0.001 compared to control and TNF-α treated cells, respectively.
Figure 6
Figure 6. The S100A4/NF-κB/MMP9 axis is critical to the invasive capacity of lung cancer cells
A-C. Cells were exposed to a variety of experimental conditions and then TNF- α was added for an additional 24 hrs prior to assessment of MMP9 expression by Q-PCR. A549 shCont and shS100A4 cells treated with 5 ng/ml TNF-α for 24 hrs (A), or parental A549 cells were pretreated with 1μM niclosamide for 48 hrs (B), or parental A549 cells treated with 10 μM and 50 μM Wedelolactone (WEL) for 24 hrs (C). D-E. A549 shCont and shRelA cells were treated with 5 ng/ml TNF-α for 24 hrs, then harvested and assessed for MMP9 (D) and RelA (E) expression by Q-PCR. F. Parental A549 cells were pretreated with 10 μM Wedelolactone or 100 μM MMP2/9 inhibitor I for 24 hrs, trypsinized, rinsed and assessed for Matrigel invasion toward 5 ng/ml TNF-α or 5 ng/ml EGF overnight in the presence or absence of the respective inhibitors. Representative data from at least three independent experiments are shown. Error bars represent the SD of the mean from three replicates.* indicates p<0.05, ** indicates p<0.01.

References

    1. Robbins SL, Kumar V, Cotran RS. Philadelphia, PA: Saunders/Elsevier; 2010. Robbins and Cotran pathologic basis of disease.
    1. Remon J, Moran T, Majem M, Reguart N, Dalmau E, Marquez-Medina D, Lianes P. Acquired resistance to epidermal growth factor receptor tyrosine kinase inhibitors in EGFR-mutant non-small cell lung cancer: A new era begins. Cancer treatment reviews. 2014;40:93–101. - PubMed
    1. Kaneda H, Yoshida T, Okamoto I. Molecularly targeted approaches herald a new era of non-small-cell lung cancer treatment. Cancer management and research. 2013;5:91–101. - PMC - PubMed
    1. Kalluri R, Weinberg RA. The basics of epithelial-mesenchymal transition. The Journal of clinical investigation. 2009;119:1420–1428. - PMC - PubMed
    1. Lo JF, Yu CC, Chiou SH, Huang CY, Jan CI, Lin SC, Liu CJ, Hu WY, Yu YH. The epithelial-mesenchymal transition mediator S100A4 maintains cancer-initiating cells in head and neck cancers. Cancer research. 2011;71:1912–1923. - PubMed

MeSH terms