

Predicting Dengue Fever Outbreaks in French Guiana Using Climate Indicators
- PMID: 27128312
- PMCID: PMC4851397
- DOI: 10.1371/journal.pntd.0004681
Predicting Dengue Fever Outbreaks in French Guiana Using Climate Indicators
Abstract
Background: Dengue fever epidemic dynamics are driven by complex interactions between hosts, vectors and viruses. Associations between climate and dengue have been studied around the world, but the results have shown that the impact of the climate can vary widely from one study site to another. In French Guiana, climate-based models are not available to assist in developing an early warning system. This study aims to evaluate the potential of using oceanic and atmospheric conditions to help predict dengue fever outbreaks in French Guiana.
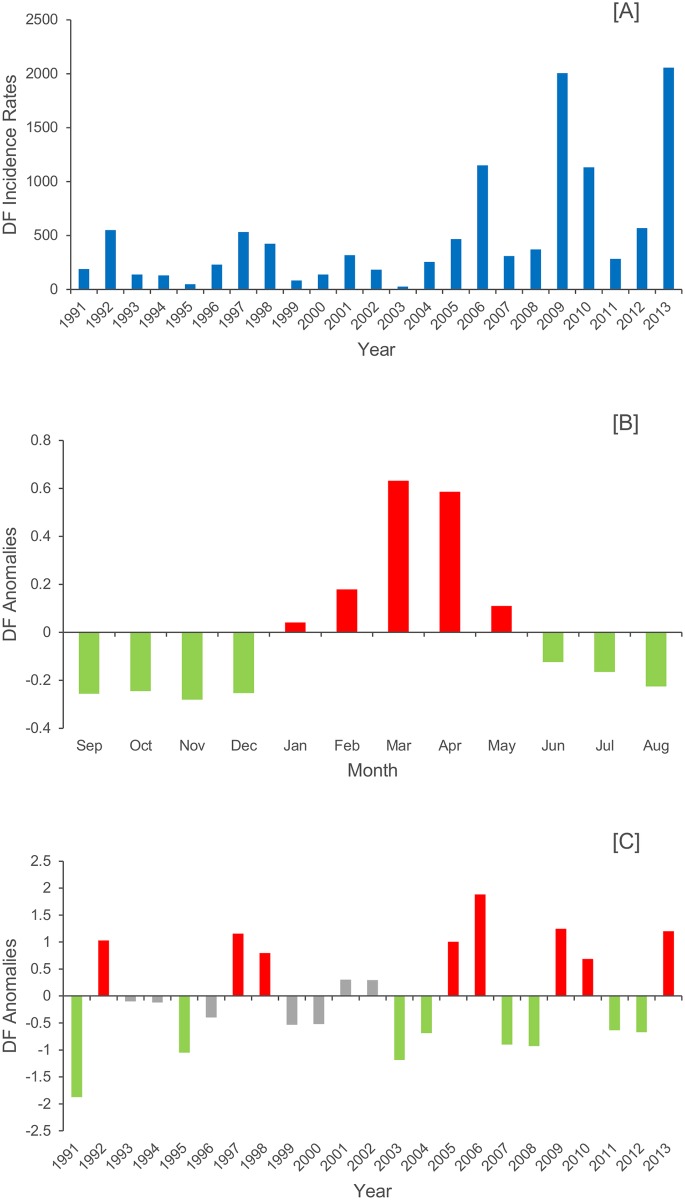
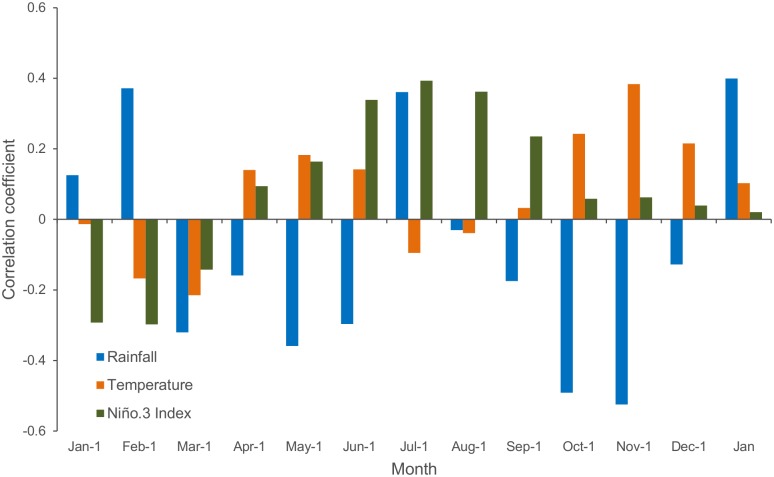
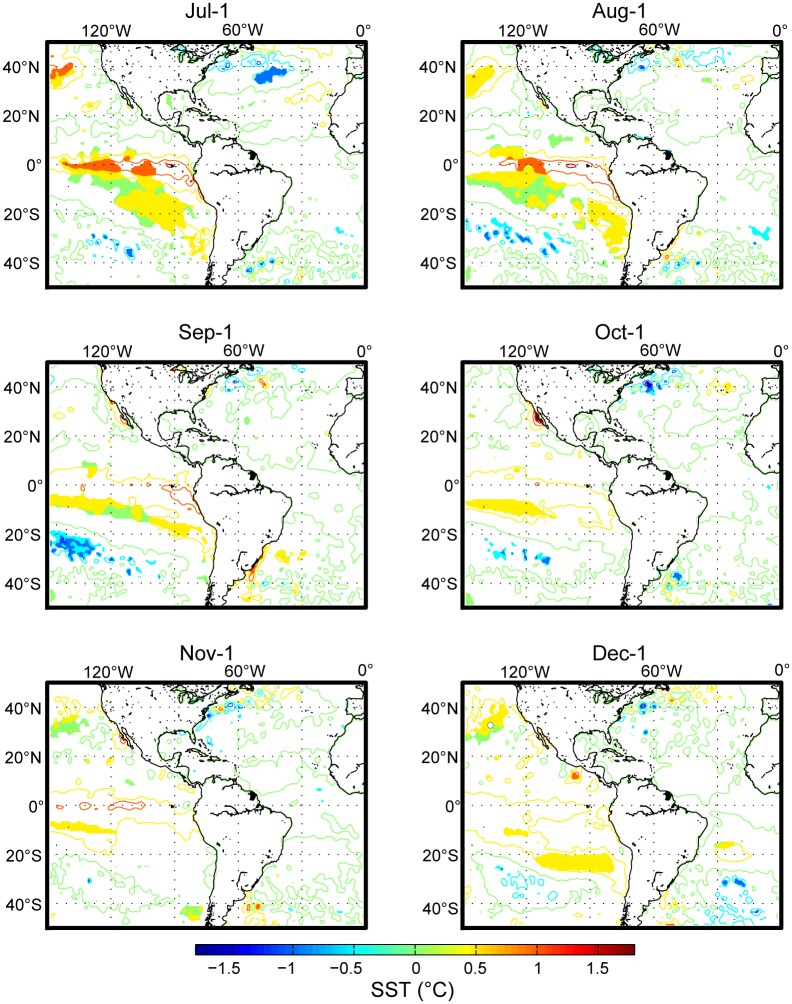
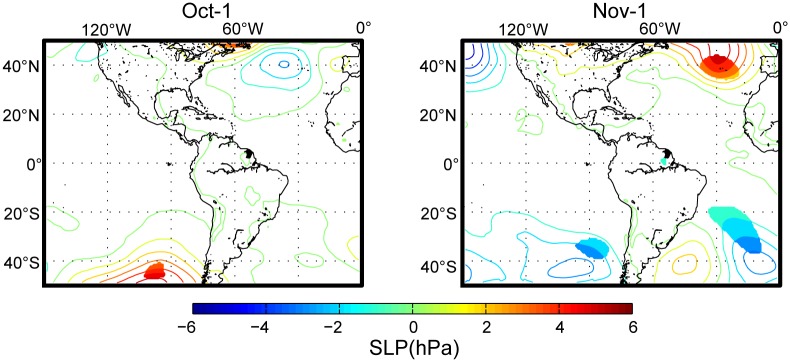
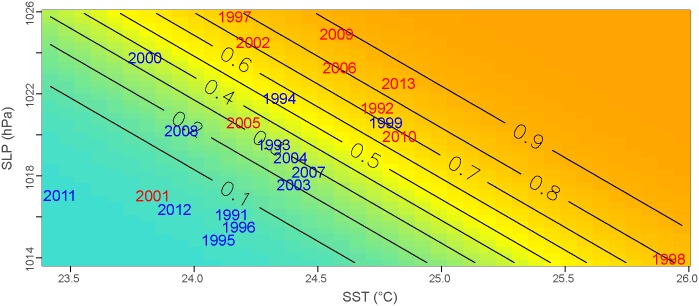
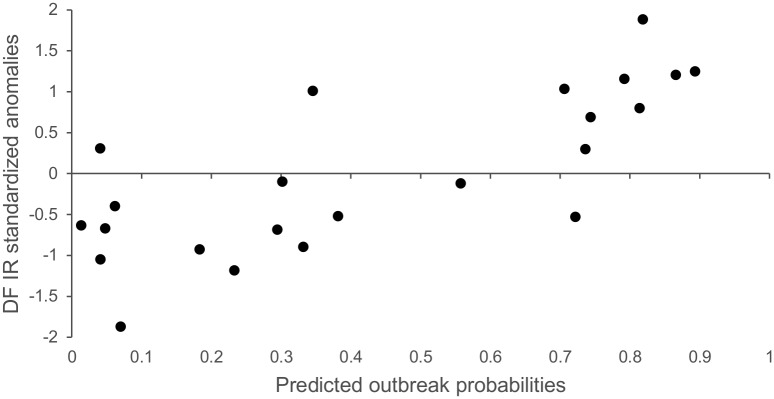
Methodology/principal findings: Lagged correlations and composite analyses were performed to identify the climatic conditions that characterized a typical epidemic year and to define the best indices for predicting dengue fever outbreaks during the period 1991-2013. A logistic regression was then performed to build a forecast model. We demonstrate that a model based on summer Equatorial Pacific Ocean sea surface temperatures and Azores High sea-level pressure had predictive value and was able to predict 80% of the outbreaks while incorrectly predicting only 15% of the non-epidemic years. Predictions for 2014-2015 were consistent with the observed non-epidemic conditions, and an outbreak in early 2016 was predicted.
Conclusions/significance: These findings indicate that outbreak resurgence can be modeled using a simple combination of climate indicators. This might be useful for anticipating public health actions to mitigate the effects of major outbreaks, particularly in areas where resources are limited and medical infrastructures are generally insufficient.
Conflict of interest statement
The authors have declared that no competing interests exist.
Figures
Similar articles
-
Mining local climate data to assess spatiotemporal dengue fever epidemic patterns in French Guiana.J Am Med Inform Assoc. 2014 Oct;21(e2):e232-40. doi: 10.1136/amiajnl-2013-002348. Epub 2014 Feb 18. J Am Med Inform Assoc. 2014. PMID: 24549761 Free PMC article.
-
Climate-based models for understanding and forecasting dengue epidemics.PLoS Negl Trop Dis. 2012;6(2):e1470. doi: 10.1371/journal.pntd.0001470. Epub 2012 Feb 14. PLoS Negl Trop Dis. 2012. PMID: 22348154 Free PMC article.
-
Re-assess Vector Indices Threshold as an Early Warning Tool for Predicting Dengue Epidemic in a Dengue Non-endemic Country.PLoS Negl Trop Dis. 2015 Sep 14;9(9):e0004043. doi: 10.1371/journal.pntd.0004043. eCollection 2015. PLoS Negl Trop Dis. 2015. PMID: 26366874 Free PMC article.
-
Development of data-driven machine learning models and their potential role in predicting dengue outbreak.J Vector Borne Dis. 2024 Oct-Dec 01;61(4):503-514. doi: 10.4103/0972-9062.393976. Epub 2024 Nov 26. J Vector Borne Dis. 2024. PMID: 38238798 Review.
-
[Aedes aegypti in French Guiana. Some aspects of history, general ecology and vertical transmission of the dengue virus].Bull Soc Pathol Exot. 1996;89(2):115-9. Bull Soc Pathol Exot. 1996. PMID: 8924768 Review. French.
Cited by
-
Empirical model for estimating dengue incidence using temperature, rainfall, and relative humidity: a 19-year retrospective analysis in East Delhi.Epidemiol Health. 2016 Nov 27;38:e2016052. doi: 10.4178/epih.e2016052. eCollection 2016. Epidemiol Health. 2016. PMID: 27899025 Free PMC article.
-
Knowledge, Attitude and Practices of Vector-Borne Disease Prevention during the Emergence of a New Arbovirus: Implications for the Control of Chikungunya Virus in French Guiana.PLoS Negl Trop Dis. 2016 Nov 1;10(11):e0005081. doi: 10.1371/journal.pntd.0005081. eCollection 2016 Nov. PLoS Negl Trop Dis. 2016. PMID: 27802275 Free PMC article.
-
Prediction model for dengue fever based on interactive effects between multiple meteorological factors in Guangdong, China (2008-2016).PLoS One. 2019 Dec 9;14(12):e0225811. doi: 10.1371/journal.pone.0225811. eCollection 2019. PLoS One. 2019. PMID: 31815950 Free PMC article.
-
The Impact of Climate on Human Dengue Infections in the Caribbean.Pathogens. 2024 Sep 3;13(9):756. doi: 10.3390/pathogens13090756. Pathogens. 2024. PMID: 39338947 Free PMC article.
-
Early warning systems (EWSs) for chikungunya, dengue, malaria, yellow fever, and Zika outbreaks: What is the evidence? A scoping review.PLoS Negl Trop Dis. 2021 Sep 16;15(9):e0009686. doi: 10.1371/journal.pntd.0009686. eCollection 2021 Sep. PLoS Negl Trop Dis. 2021. PMID: 34529649 Free PMC article.
References
-
- WHO (World Health Organization). 2013. Dengue and severe dengue Factsheet No. 117. Geneva: World Health Organization; 2013. Available: http://www.who.int/mediacentre/factsheets/fs117/en/. Accessed 30 October 2015.
Publication types
MeSH terms
LinkOut - more resources
Full Text Sources
Other Literature Sources
Medical
