

Proteotranscriptomic Analysis Reveals Stage Specific Changes in the Molecular Landscape of Clear-Cell Renal Cell Carcinoma
- PMID: 27128972
- PMCID: PMC4851420
- DOI: 10.1371/journal.pone.0154074
Proteotranscriptomic Analysis Reveals Stage Specific Changes in the Molecular Landscape of Clear-Cell Renal Cell Carcinoma
Abstract
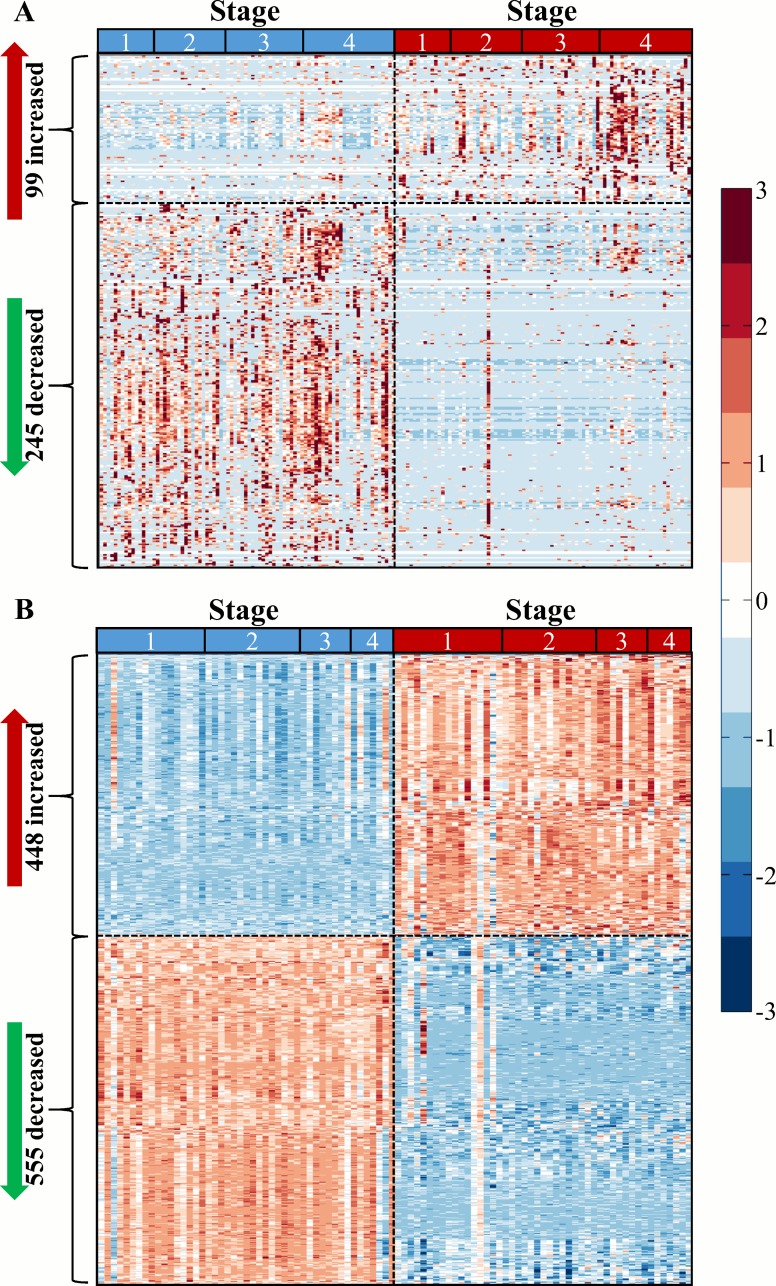
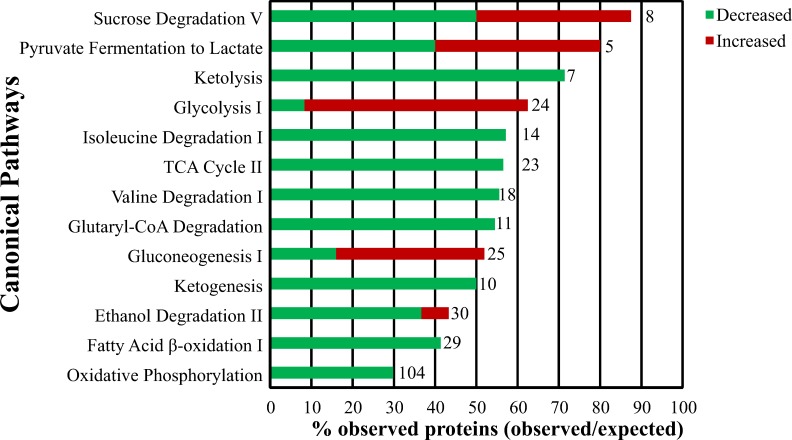
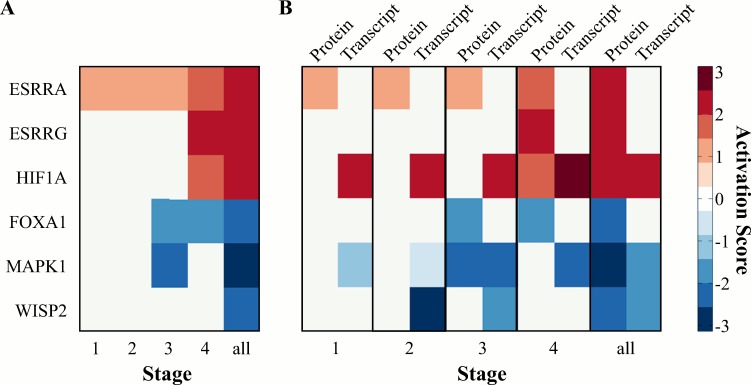
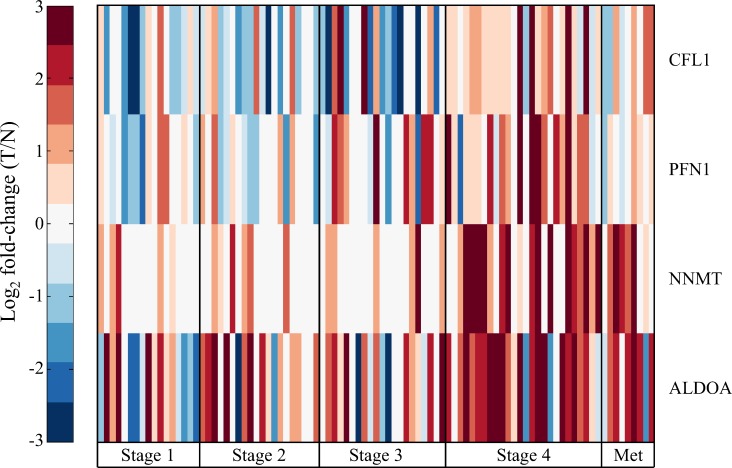
Renal cell carcinoma comprises 2 to 3% of malignancies in adults with the most prevalent subtype being clear-cell RCC (ccRCC). This type of cancer is well characterized at the genomic and transcriptomic level and is associated with a loss of VHL that results in stabilization of HIF1. The current study focused on evaluating ccRCC stage dependent changes at the proteome level to provide insight into the molecular pathogenesis of ccRCC progression. To accomplish this, label-free proteomics was used to characterize matched tumor and normal-adjacent tissues from 84 patients with stage I to IV ccRCC. Using pooled samples 1551 proteins were identified, of which 290 were differentially abundant, while 783 proteins were identified using individual samples, with 344 being differentially abundant. These 344 differentially abundant proteins were enriched in metabolic pathways and further examination revealed metabolic dysfunction consistent with the Warburg effect. Additionally, the protein data indicated activation of ESRRA and ESRRG, and HIF1A, as well as inhibition of FOXA1, MAPK1 and WISP2. A subset analysis of complementary gene expression array data on 47 pairs of these same tissues indicated similar upstream changes, such as increased HIF1A activation with stage, though ESRRA and ESRRG activation and FOXA1 inhibition were not predicted from the transcriptomic data. The activation of ESRRA and ESRRG implied that HIF2A may also be activated during later stages of ccRCC, which was confirmed in the transcriptional analysis. This combined analysis highlights the importance of HIF1A and HIF2A in developing the ccRCC molecular phenotype as well as the potential involvement of ESRRA and ESRRG in driving these changes. In addition, cofilin-1, profilin-1, nicotinamide N-methyltransferase, and fructose-bisphosphate aldolase A were identified as candidate markers of late stage ccRCC. Utilization of data collected from heterogeneous biological domains strengthened the findings from each domain, demonstrating the complementary nature of such an analysis. Together these results highlight the importance of the VHL/HIF1A/HIF2A axis and provide a foundation and therapeutic targets for future studies. (Data are available via ProteomeXchange with identifier PXD003271 and MassIVE with identifier MSV000079511.).
Conflict of interest statement
Figures

Similar articles
-
Prognostic significance of VHL, HIF1A, HIF2A, VEGFA and p53 expression in patients with clear‑cell renal cell carcinoma treated with sunitinib as first‑line treatment.Int J Oncol. 2019 Aug;55(2):371-390. doi: 10.3892/ijo.2019.4830. Epub 2019 Jun 25. Int J Oncol. 2019. PMID: 31268155 Free PMC article.
-
Overexpression of placenta specific 8 is associated with malignant progression and poor prognosis of clear cell renal cell carcinoma.Int Urol Nephrol. 2017 Jul;49(7):1165-1176. doi: 10.1007/s11255-017-1578-y. Epub 2017 Mar 27. Int Urol Nephrol. 2017. PMID: 28349447
-
SERPINH1 overexpression in clear cell renal cell carcinoma: association with poor clinical outcome and its potential as a novel prognostic marker.J Cell Mol Med. 2018 Feb;22(2):1224-1235. doi: 10.1111/jcmm.13495. Epub 2017 Dec 14. J Cell Mol Med. 2018. PMID: 29239102 Free PMC article.
-
The biological roles and clinical implications of microRNAs in clear cell renal cell carcinoma.J Cell Physiol. 2018 Jun;233(6):4458-4465. doi: 10.1002/jcp.26347. Epub 2017 Dec 26. J Cell Physiol. 2018. PMID: 29215721 Review.
-
Epigenome Aberrations: Emerging Driving Factors of the Clear Cell Renal Cell Carcinoma.Int J Mol Sci. 2017 Aug 16;18(8):1774. doi: 10.3390/ijms18081774. Int J Mol Sci. 2017. PMID: 28812986 Free PMC article. Review.
Cited by
-
The CCN axis in cancer development and progression.J Cell Commun Signal. 2021 Dec;15(4):491-517. doi: 10.1007/s12079-021-00618-2. Epub 2021 Apr 20. J Cell Commun Signal. 2021. PMID: 33877533 Free PMC article. Review.
-
Challenges and opportunities in the proteomic characterization of clear cell renal cell carcinoma (ccRCC): A critical step towards the personalized care of renal cancers.Semin Cancer Biol. 2019 Apr;55:8-15. doi: 10.1016/j.semcancer.2018.06.004. Epub 2018 Jul 25. Semin Cancer Biol. 2019. PMID: 30055950 Free PMC article. Review.
-
Cofilin-2 Acts as a Marker for Predicting Radiotherapy Response and Is a Potential Therapeutic Target in Nasopharyngeal Carcinoma.Med Sci Monit. 2018 Apr 17;24:2317-2329. doi: 10.12659/msm.909832. Med Sci Monit. 2018. PMID: 29664897 Free PMC article.
-
[Quantitative and comparative proteomics analysis in clear cell renal cell carcinoma and adjacent noncancerous tissues by 2-D DIGE].Nan Fang Yi Ke Da Xue Xue Bao. 2017 Nov 20;37(11):1517-1522. doi: 10.3969/j.issn.1673-4254.2017.11.15. Nan Fang Yi Ke Da Xue Xue Bao. 2017. PMID: 29180334 Free PMC article. Chinese.
-
Peroxisome-Deficiency and HIF-2α Signaling Are Negative Regulators of Ketohexokinase Expression.Front Cell Dev Biol. 2020 Jul 8;8:566. doi: 10.3389/fcell.2020.00566. eCollection 2020. Front Cell Dev Biol. 2020. PMID: 32733884 Free PMC article.
References
-
- Rini BI, Campbell SC, Escudier B. Renal cell carcinoma. Lancet (London, England). 2009;373(9669):1119–32. - PubMed
-
- Moch H. Kidney Cancer In: Stewart BW, Wild CP, editors. World Cancer Report 2014. Lyon, France: International Agency for Research on Cancer; 2014. p. 436–43.
Publication types
MeSH terms
Substances
Supplementary concepts
Grants and funding
LinkOut - more resources
Full Text Sources
Other Literature Sources
Medical
Molecular Biology Databases
Miscellaneous
