Randomized Controlled Trial
. 2016 Jun 7;7(23):33901-18.
doi: 10.18632/oncotarget.8983.

Neoadjuvant tamoxifen synchronizes ERα binding and gene expression profiles related to outcome and proliferation

Affiliations
Randomized Controlled Trial

Neoadjuvant tamoxifen synchronizes ERα binding and gene expression profiles related to outcome and proliferation

Tesa M Severson et al. Oncotarget. .

Abstract

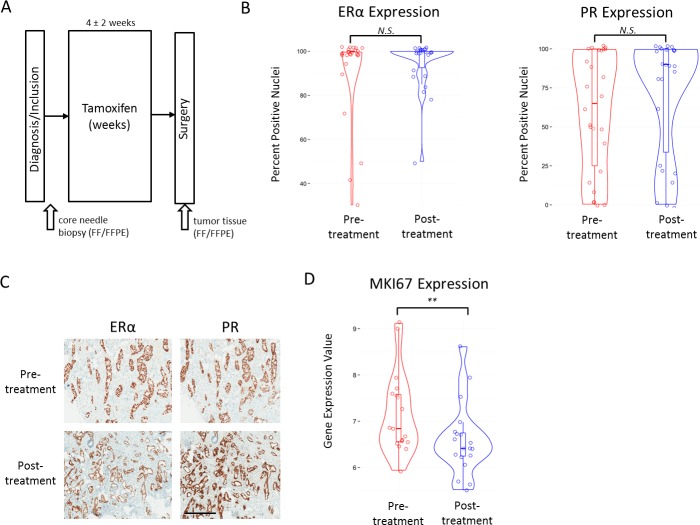
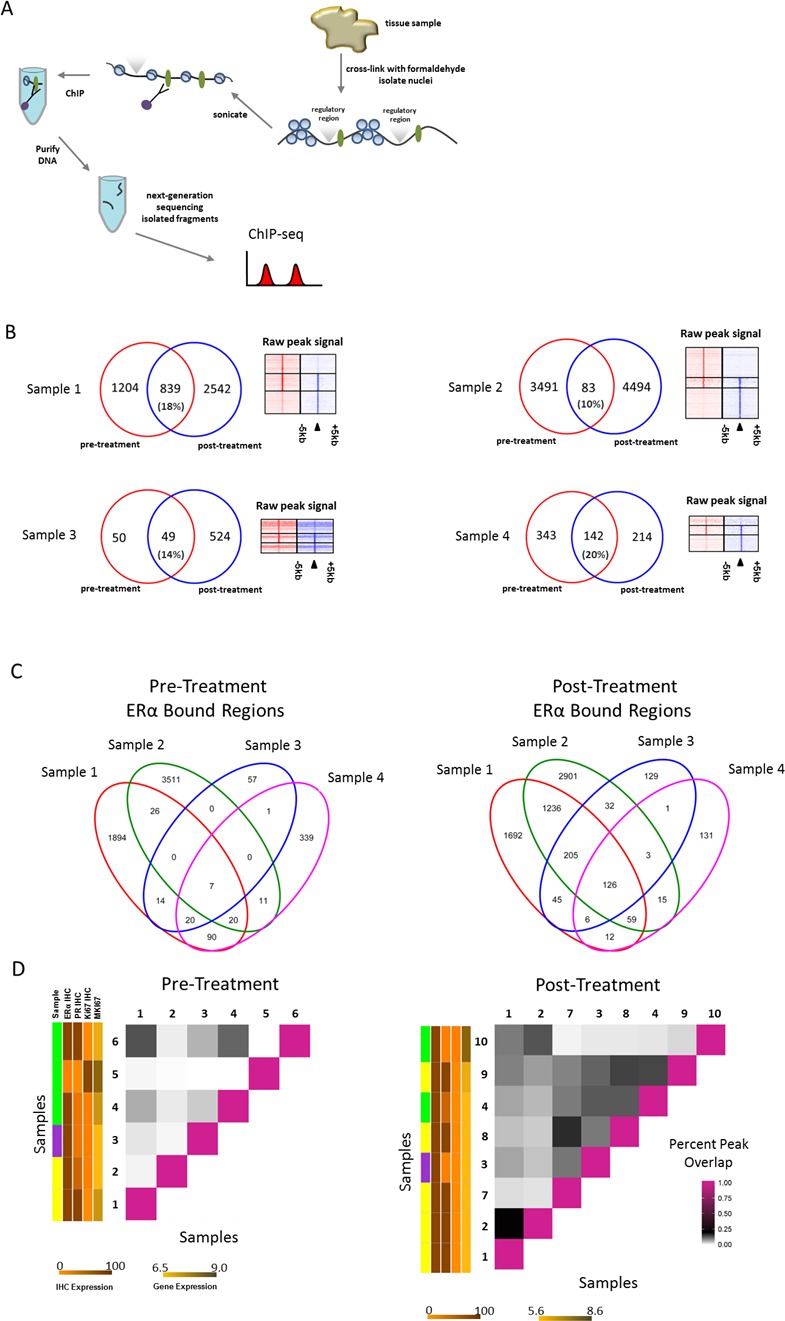
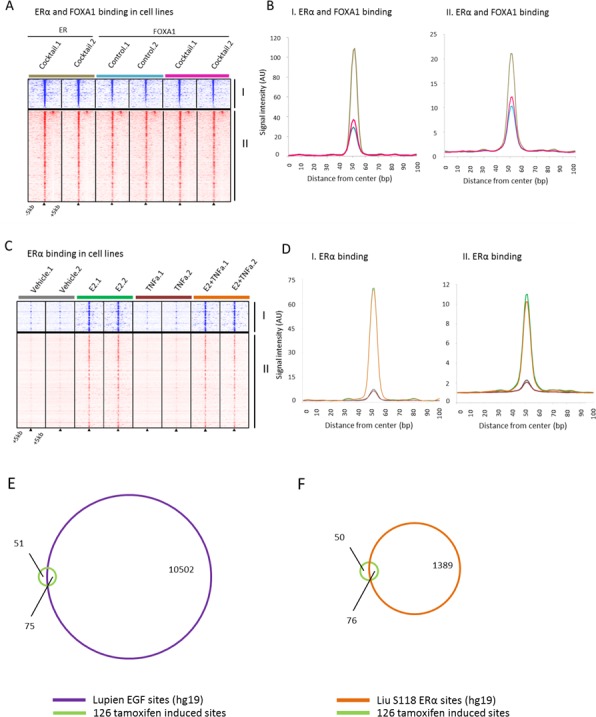
Estrogen receptor alpha (ERα)-positive breast cancers are frequently treated with tamoxifen, but resistance is common. It remains elusive how tamoxifen resistance occurs and predictive biomarkers for treatment outcome are needed. Because most biomarker discovery studies are performed using pre-treatment surgical resections, the effects of tamoxifen therapy directly on the tumor cell in vivo remain unexamined. In this study, we assessed DNA copy number, gene expression profiles and ERα/chromatin binding landscapes on breast tumor specimens, both before and after neoadjuvant tamoxifen treatment. We observed neoadjuvant tamoxifen treatment synchronized ERα/chromatin interactions and downstream gene expression, indicating that hormonal therapy reduces inter-tumor molecular variability. ERα-synchronized sites are associated with dynamic FOXA1 action at these sites, which is under control of growth factor signaling. Genes associated with tamoxifen-synchronized sites are capable of differentiating patients for tamoxifen benefit. Due to the direct effects of therapeutics on ERα behavior and transcriptional output, our study highlights the added value of biomarker discovery studies after neoadjuvant drug exposure.

Keywords: ChIP-seq; endocrine therapy; estrogen receptor; gene expression analysis; neoadjuvant therapy.


Conflict of interest statement

The authors declare no conflict of interest.

Figures

Figure 1
Figure 1. Study collection and clinical marker values
A., Schematic representation of the AFTER study patient and material collection. B., Violin plots with boxplot overlay of IHC scores (Y-axis) for ERα (left panel) and PR (right panel) in pre- and post-treatment samples. N.S. indicates a p-value that is not significant at 0.05 level. C., Example of IHC staining of ERα and PR in a pre- and post-treatment sample. Black bar indicates 400μm. D., Violin plots with boxplot overlay of MKI67 gene expression values in pre- and post-treatment samples. ** indicates P < 0.01.
Figure 2
Figure 2. ERα binding events before and after neoadjuvant tamoxifen treatment
A., Schematic representation of ChIP-seq process. ERα bound to the DNA is depicted as green ovals; regulatory regions are depicted above the DNA strand as grey triangles. B., Venn diagrams depicting the overlap of ERα bound regions (peaks) in both pre-(red) and post-(blue) treatment pairs. Heatmaps on the right show ERα binding events at the center of the peak and the surrounding ±5kb for the pre-treatment sample only peaks (top), overlapping peaks (middle) and post-treatment sample only peaks (bottom). C., Venn diagrams depicting all overlapping peaks for pre- and post-treatment pair samples separately. D., Matrix to visualize percent of overlapping peaks (of total peaks in each pair combination) for both pre- and post-treatment samples separately. Vertical colored side bars indicate patient menopausal-status (sample) and ERα IHC, PR IHC, Ki67 IHC and MKI67 values respectively. Patient menopausal-status is shown in yellow (post-menopausal), green (pre-menopausal) and purple (male). Separate scale bars are shown below the plot for expression levels corresponding to sidebars. IHC expression scale bar for both panels indicates percentage staining nuclei. Gene expression scale bar for both panels indicates normalized gene expression values.
Figure 3
Figure 3. Binding profiles of 126 tamoxifen-synchronized regions (I) and unique pre-treatment regions (II)
A., Venn diagrams depicting overlapping peaks (paired samples) for both post-treatment tamoxifen synchronized sites (I) and unique pre-treatment sites (II). B., Heatmap showing binding peak intensity for ERα binding events in I and II sites (± 5kb) in primary tumors (green) and metastases (purple).C., Normalized average signal intensity of ERα binding events from panel B. Line colors match B. D., Heatmap showing binding peak intensity for C for ERα binding events in I and II sites (± 5kb) in MCF7 cell lines deprived of hormones for three days and then given vehicle (grey), estradiol ((E2), brown), tamoxifen ((TAM), blue) and full medium ((ER.full), red). PR binding in MCR7 cell lines deprived of hormones for three days and then given full medium is shown in orange (PR.full). TAMR cell lines deprived of hormones for three days and then given vehicle (green) and TAM (purple) are also depicted. E., Normalized average signal intensity of ERα binding events from D. Line colors match D. F., Heatmap showing binding peak intensity for ERα and FOXA1 binding events in I and II sites (± 5kb) in MCF7 cell lines deprived of hormones for three days and then given vehicle (blue), E2 (red) and TAM (green). G., H., Normalized average signal intensity of ERα (left) and FOXA1 (right) binding events from panel F. Line colors match F.
Figure 4
Figure 4. Binding profiles of 126 tamoxifen synchronized regions (I) and unique pre-treatment regions (II) under mitogen conditions
A., Heatmap showing binding peak intensity for ERα/FOXA1 binding events in I and II sites (± 5kb) in MCF7 cells, cultured under control conditions (blue) or in presence of a mitogen cocktail containing EGF, IGF-1, TNFα and IL-6 (brown for ERα and pink for FOXA1). B., Normalized average signal intensity of ERα/FOXA1 binding events from panel B. Line colors match B. C., Heatmap showing binding peak intensity for ERα binding events in I and II sites (± 5kb) in MCF7 cell lines deprived of hormones for three days and then given vehicle (brown), E2 (green), TNFα (burgundy), or the combination of both (orange). D., Normalized average signal intensity of ERα binding events from panel C. Line colors match D. E., Venn diagram depicting overlap of the 126 tamoxifen-induced bindings sites with EGF-induced ERα sites. F., Venn diagram depicting the overlap of tamoxifen-induced binding sites with estradiol induced S118-ER sites.
Figure 5
Figure 5. 96 genes survival analyses
A., Venn diagram depicting overlapping peaks (paired samples) for post-treatment tamoxifen synchronized sites (I) and an unsupervised hierarchical clustering heatmap depicting gene expression in our series of those genes. Top row indicates pre-treatment samples (red) and post-treatment samples (blue). B., Kaplan Meier survival curves of distant metastasis-free survival for tamoxifen treated datasets (left panels) and non-endocrine therapy treated datasets (right panels).

References

    1. Ferlay J, Soerjomataram I, Dikshit R, Eser S, Mathers C, Rebelo M, Parkin DM, Forman D, Bray F. Cancer incidence and mortality worldwide: sources, methods and major patterns in GLOBOCAN 2012. Int J Cancer J Int Cancer. 2015 Mar 1;136:E359–86. - PubMed
    1. Fox MS. On the diagnosis and treatment of breast cancer. JAMA J Am Med Assoc. 1979 Feb 2;241:489–94. - PubMed
    1. Hedenfalk I, Duggan D, Chen Y, Radmacher M, Bittner M, Simon R, Meltzer P, Gusterson B, Esteller M, Kallioniemi OP, Wilfond B, Borg A, Trent J, et al. Gene-expression profiles in hereditary breast cancer. N Engl J Med. 2001 Feb 22;344:539–48. - PubMed
    1. Perou CM, Sørlie T, Eisen MB, van de Rijn M, Jeffrey SS, Rees CA, Pollack JR, Ross DT, Johnsen H, Akslen LA, Fluge O, Pergamenschikov A, Williams C, et al. Molecular portraits of human breast tumours. Nature. 2000 Aug 17;406:747–52. - PubMed
    1. Sørlie T, Perou CM, Tibshirani R, Aas T, Geisler S, Johnsen H, Hastie T, Eisen MB, van de Rijn M, Jeffrey SS, Thorsen T, Quist H, Matese JC, et al. Gene expression patterns of breast carcinomas distinguish tumor subclasses with clinical implications. Proc Natl Acad Sci U S A. 2001 Sep 11;98:10869–74. - PMC - PubMed

Publication types

MeSH terms