. 2016 Jun 17;291(25):13243-56.
doi: 10.1074/jbc.M115.712067. Epub 2016 Apr 25.

How Aromatic Compounds Block DNA Binding of HcaR Catabolite Regulator

Affiliations

How Aromatic Compounds Block DNA Binding of HcaR Catabolite Regulator

Youngchang Kim et al. J Biol Chem. .

Abstract

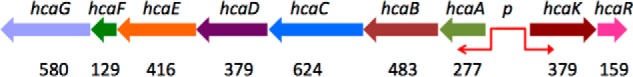
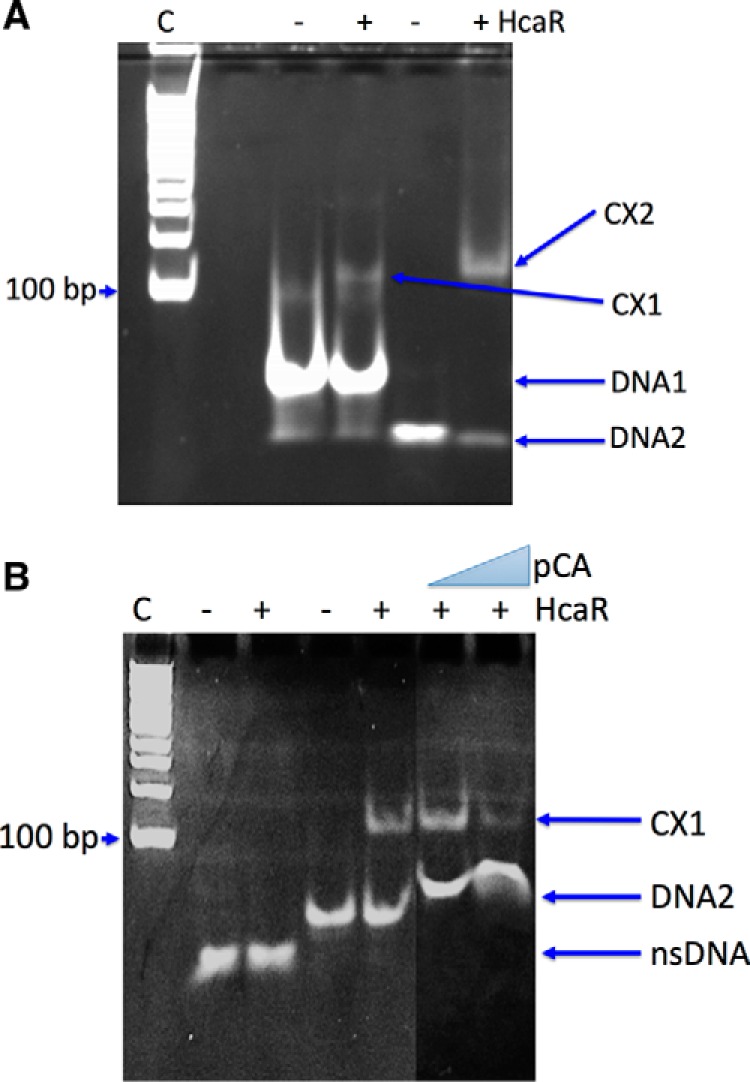
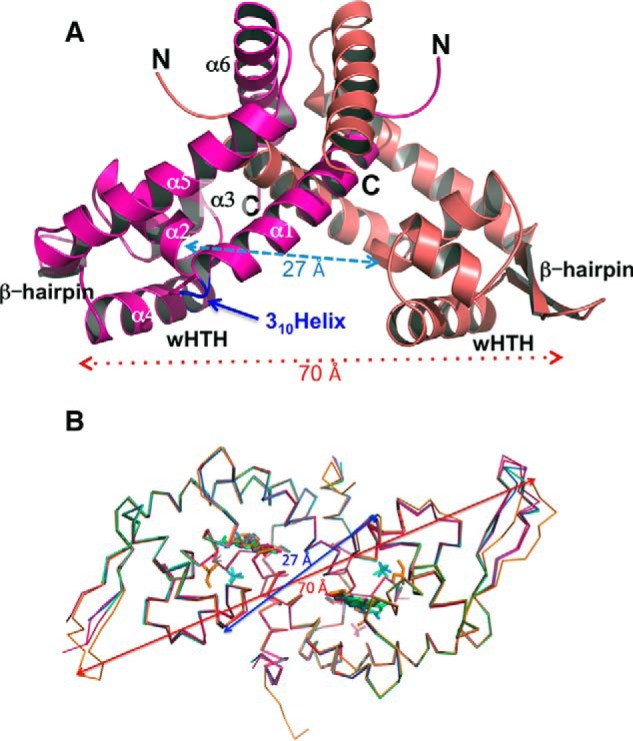
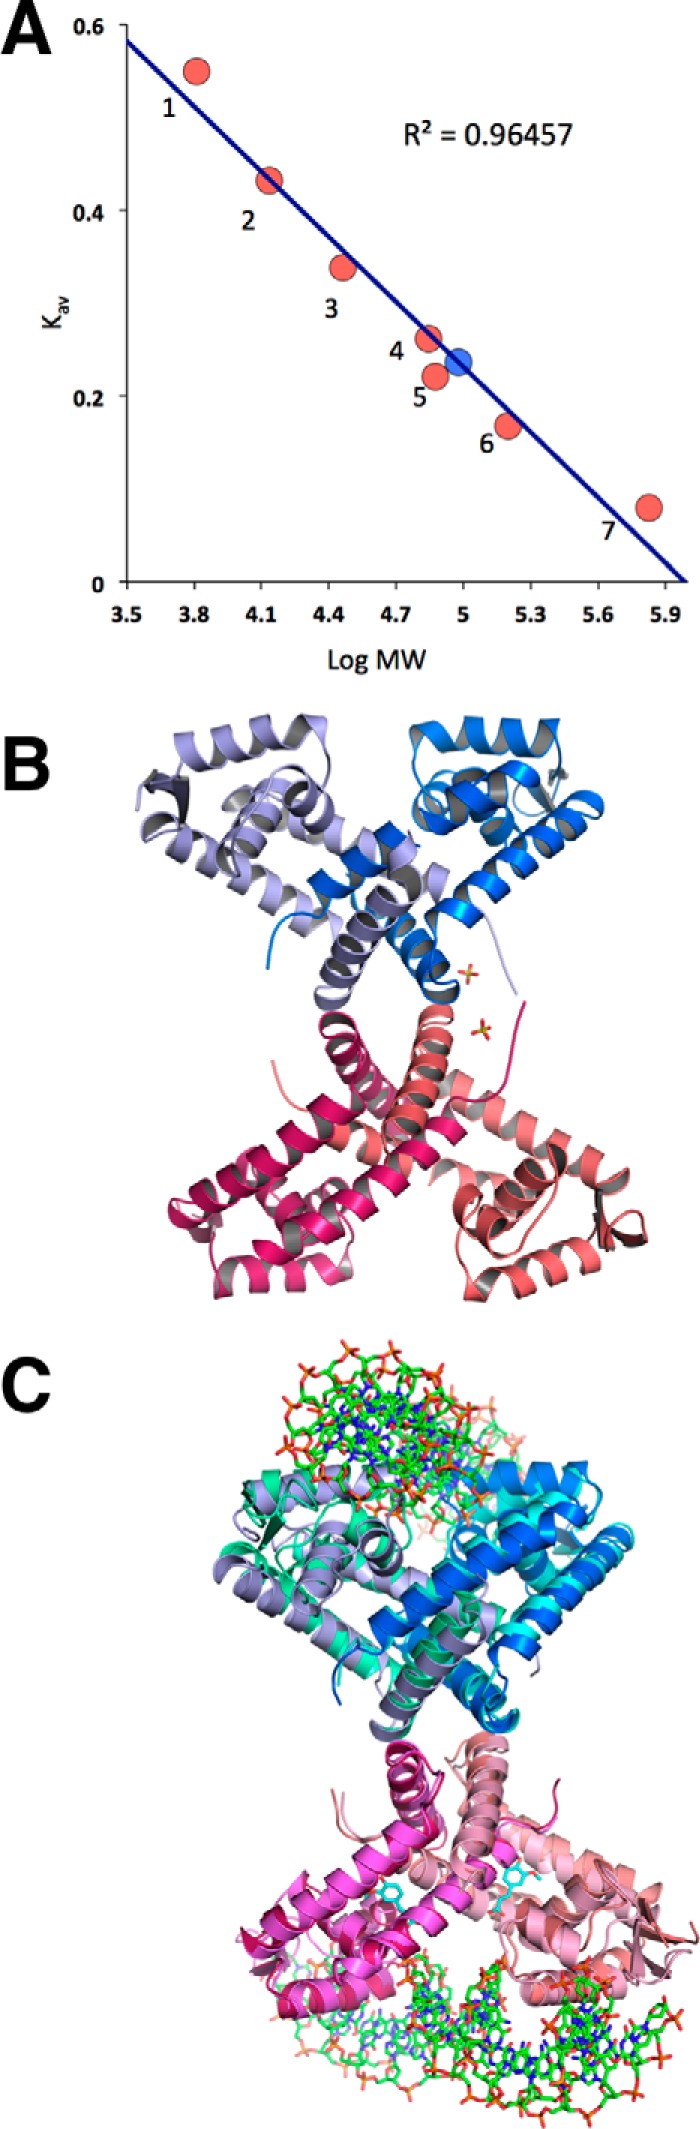
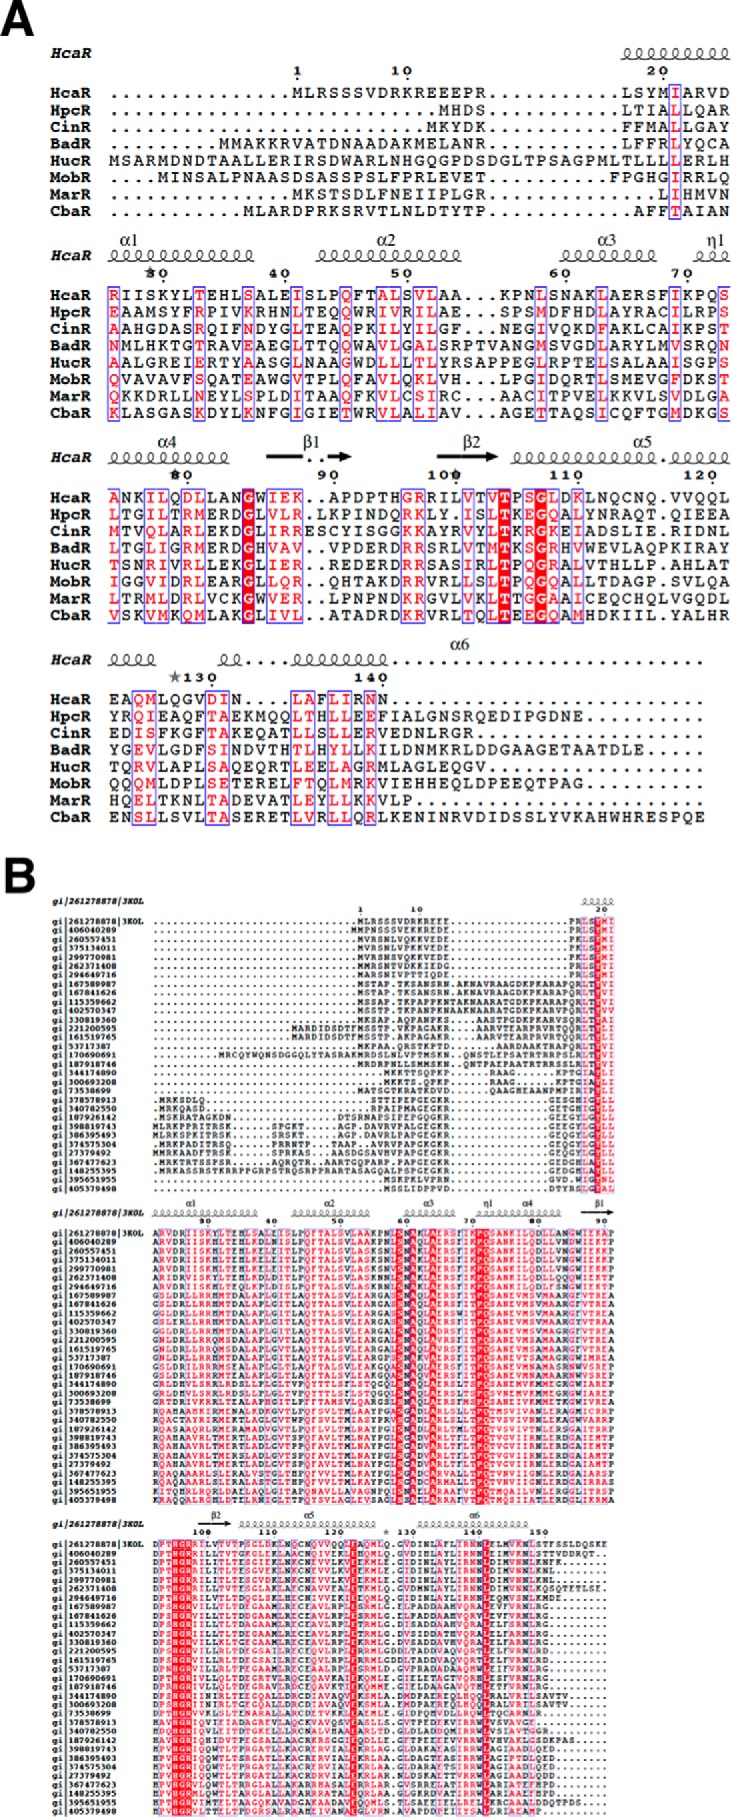
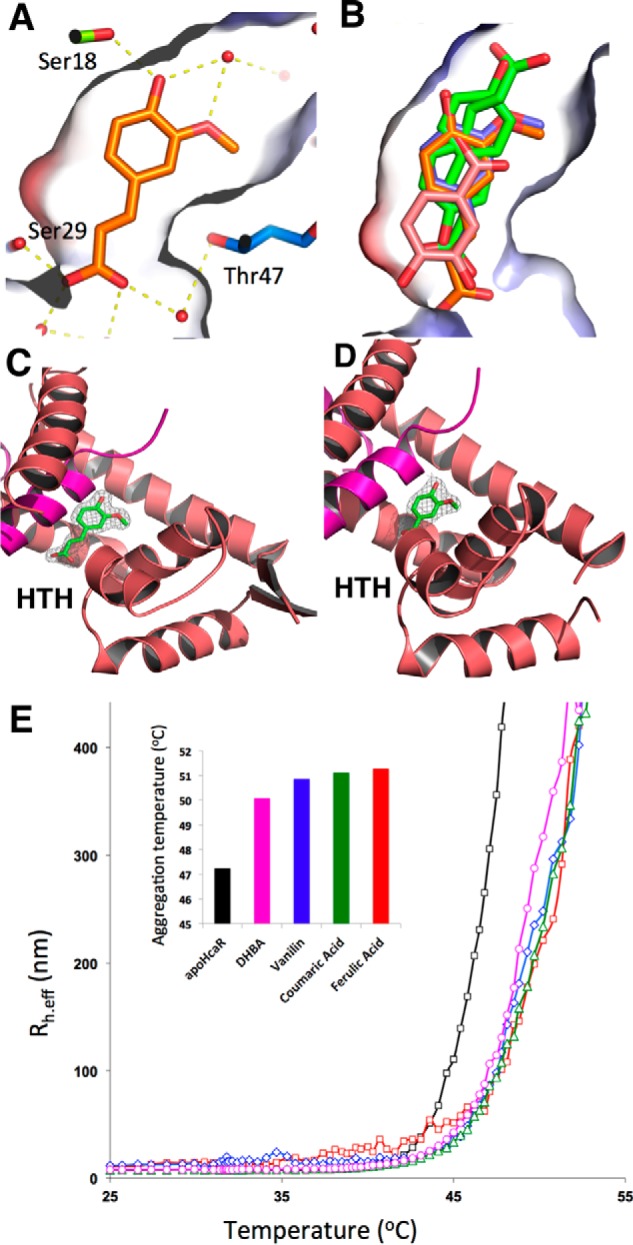
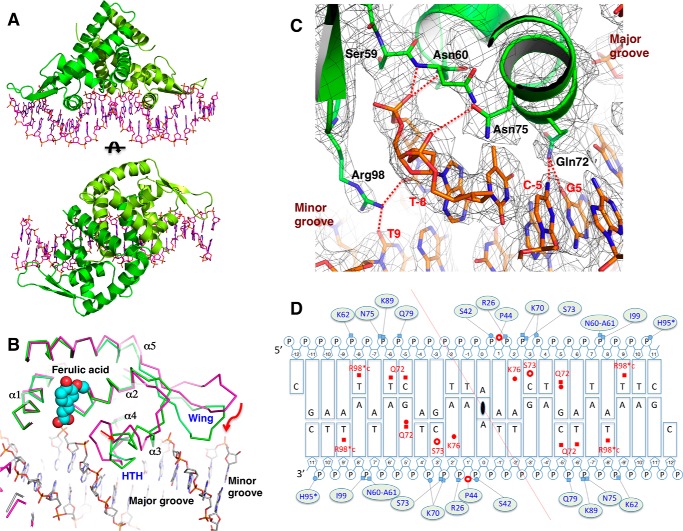
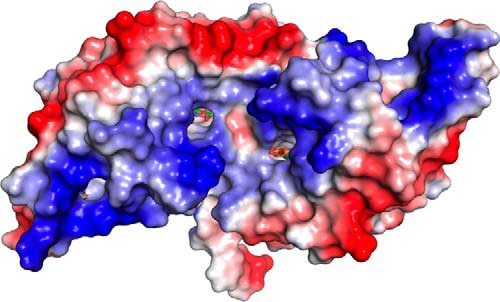
Bacterial catabolism of aromatic compounds from various sources including phenylpropanoids and flavonoids that are abundant in soil plays an important role in the recycling of carbon in the ecosystem. We have determined the crystal structures of apo-HcaR from Acinetobacter sp. ADP1, a MarR/SlyA transcription factor, in complexes with hydroxycinnamates and a specific DNA operator. The protein regulates the expression of the hca catabolic operon in Acinetobacter and related bacterial strains, allowing utilization of hydroxycinnamates as sole sources of carbon. HcaR binds multiple ligands, and as a result the transcription of genes encoding several catabolic enzymes is increased. The 1.9-2.4 Å resolution structures presented here explain how HcaR recognizes four ligands (ferulate, 3,4-dihydroxybenzoate, p-coumarate, and vanillin) using the same binding site. The ligand promiscuity appears to be an adaptation to match a broad specificity of hydroxycinnamate catabolic enzymes while responding to toxic thioester intermediates. Structures of apo-HcaR and in complex with a specific DNA hca operator when combined with binding studies of hydroxycinnamates show how aromatic ligands render HcaR unproductive in recognizing a specific DNA target. The current study contributes to a better understanding of the hca catabolic operon regulation mechanism by the transcription factor HcaR.

Keywords: DNA binding; DNA-binding protein; NUDIX family; arabinose utilization; bacterial transcription; human gut bacteria; ligand-binding protein; ligand-induced conformational change; metabolic regulation; protein conformation.


Figures

FIGURE 1.
FIGURE 1.
Organization of the hca operon in Acinetobacter sp. ADP1 (18). Genes are drawn with approximate length; the exact protein length in amino acids is shown below. The bidirectional promoter separates the hcaABCDEFG and hcaKR gene clusters.
FIGURE 2.
FIGURE 2.
EMSA analysis of HcaR·DNA complex. A, HcaR complexed with DNA1 (42-mer) (labeled as CX1) and DNA2 (24-mer; used for crystallization) (labeled as CX2). B, HcaR interaction with DNA2 in the presence and absence of p-coumaric acid (pCA). Lane C, size markers nsDNA, nonspecific DNA.
FIGURE 3.
FIGURE 3.
Overall structures of AcHcaR dimers. A, ribbon diagrams of the AcHcaR dimer in stick representation. N and C termini and wHTH motifs are labeled. B, comparison of main chain atom conformation in AcHcaR structures. The main chain structure of apo-AcHcaR (red) is compared with AcHcaR complexes with ligands (AcHcaR·ferulic acid (orange), HcaR·DHBA (pink), HcaR·vanillin (blue), and HcaR·p-coumaric acid (green)). Ligands are shown as sticks using the same color scheme. In addition to aromatic compounds, glycerol and phosphate anions are found in some protein structures. Structures were superimposed with Coot (50). The arrows show distances between Cβ atoms of His91A-His91B (red) and Gln71A-Gln71B (blue). These residues are part of the wHTH DNA-binding motif.
FIGURE 4.
FIGURE 4.
Biochemical property of HcaR. A, size exclusion chromatography of AcHcaR protein. The absorbance at 280 nm is plotted in absorbance units versus retention volume in milliliters for AcHcaR. The inset is the plot of Kav coefficient versus logarithm of molecular weight. Red circles correspond to standard proteins: 1, aprotinin (6.5 kDa); 2, ribonuclease A (13.7 kDa); 3, carbonic anhydrase (29 kDa); 4, ovalbumin (43 kDa); 5, conalbumin (75 kDa); 6, aldolase (158 kDa); and 7, thyroglobulin (669 kDa). The blue circle is AcHcaR (corresponding to 95 kDa). A single peak corresponding to a tetramer is observed. B, the structure of the AcHcaR tetramer as predicted by the PISA server. C, a similar AcHcaR tetramer is maintained in the AcHcaR·DNA complex.
FIGURE 5.
FIGURE 5.
Sequence alignment of HcaR homologs. A, structure-based sequence alignment of select HcaR homologues. HcaR, repressor of 4-hydroxycinnamic acid catabolism in Acinetobacter sp. ADP1; CinR, repressor of cinnamoyl ester from Butyrivibrio fibrisolvens E14; HpcR, regulator of homoprotocatechuate catabolism from E. coli K12; BadR, benzoate anaerobic catabolism regulator from R. palustris CGA009; CbaR, regulator chlorobenzoate catabolism from Conidiobolus coronatus BR60; HucR, regulator of uric acid catabolism from Deinococcus radiodurans; MarR, regulator of 2-hydroxybenzoic acid catabolism from E. coli; MobR, regulator of 3-hydroxybenzoic acid catabolism from Comamonas testosteroni KH122. B, multiple sequence alignment of AcHcaR homologues from soil bacteria using ClustalX (58).
FIGURE 6.
FIGURE 6.
Structures of AcHcaR·ligand complexes. A, binding of ferulic acid in the pocket showing the solvent-accessible surface colored using local electrostatic potential. Hydrogen bonds with protein and solvent are shown in yellow. B, comparison of binding mode for all four ligands (ferulic acid (orange), two conformers of p-coumaric acid (green), vanillin (blue), and DHBA (pink)). Ferulic acid (C) and vanillin (D) caged in the corresponding experimental electron density (from SAD phasing experiment). E, thermal unfolding of AcHcaR monitored using DLS for apo-AcHcaR and complexes with ligands. Effective hydrodynamic radius (Rh.eff) is plotted versus temperature. In the histogram plot, the temperature at which AcHcaR reaches Rh.eff = 250 nm in the absence and presence of ligands is shown. Unfolding is observed at higher temperatures in the presence of ligands.
FIGURE 7.
FIGURE 7.
Specific DNA binding by AcHcaR. A, overall views of AcHcaR-23-bp plus 5′-C overhang DNA. B, structural comparison of AcHcaR complex with ferulic acid (cyan and red spheres) and apo form bound to DNA (green) show shifts in positions of the HTH motif and the wing. C, specific hydrogen bonds between protein side chains and DNA bases in the major and minor grooves. D, summary of AcHcaR-DNA interaction. Schematic diagram of the 23-bp plus 5′-C overhang DNA sequence used for structure determination is shown. The center of the palindrome is indicated by a 2-fold rotation sign at the A:A base pair in the middle of the diagram. Two chains of HcaR residues are separated by the red diagonally crossing line. Bases are shown as rectangular boxes, large ones for purines and small ones for pyrimidines. Riboses are drawn as pentagons, and phosphates are Ps in small circles. The interactions involved in DNA bases are indicated on the bases in red with interacting protein residue types and numbers. Direct hydrogen bonds are shown in filled squares, and water-mediated hydrogen bonds are in red filled circles. Hydrophobic interactions are depicted as empty red circles. Interactions with phosphates are shown in lines with small pale blue filled circles (water mediated-hydrogen bonds) and squares (direct hydrogen bonds) connected with interacting protein residues (types and numbers). Pro44 in both subunits make interactions with two consecutive phosphates shown as red empty circles between the two P circles. H95* indicates a water-mediated hydrogen bond interaction with the phosphate, but no water molecule is found due to low resolution of the structure. R98*c in red indicates water-mediated interactions with DNA bases in the minor groove.
FIGURE 8.
FIGURE 8.
Local electrostatic potential of AcHcaR·p-coumaric acid complex shows the location of the binding sites in the dimer from the direction of the presumed DNA-binding site.

References

    1. Spory A., Bosserhoff A., von Rhein C., Goebel W., and Ludwig A. (2002) Differential regulation of multiple proteins of Escherichia coli and Salmonella enterica serovar Typhimurium by the transcriptional regulator SlyA. J. Bacteriol. 184, 3549–3559 - PMC - PubMed
    1. Schumacher M. A., and Brennan R. G. (2002) Structural mechanisms of multidrug recognition and regulation by bacterial multidrug transcription factors. Mol. Microbiol. 45, 885–893 - PubMed
    1. Fiorentino G., Ronca R., Cannio R., Rossi M., and Bartolucci S. (2007) MarR-like transcriptional regulator involved in detoxification of aromatic compounds in Sulfolobus solfataricus. J. Bacteriol. 189, 7351–7360 - PMC - PubMed
    1. Alekshun M. N., and Levy S. B. (1999) The mar regulon: multiple resistance to antibiotics and other toxic chemicals. Trends Microbiol. 7, 410–413 - PubMed
    1. Davis J. R., and Sello J. K. (2010) Regulation of genes in Streptomyces bacteria required for catabolism of lignin-derived aromatic compounds. Appl. Microbiol. Biotechnol. 86, 921–929 - PubMed

Publication types

LinkOut - more resources