. 2016 Jun 17;291(25):12930-42.
doi: 10.1074/jbc.M115.698530. Epub 2016 Apr 27.

Inhibition of the Expression of the Small Heat Shock Protein αB-Crystallin Inhibits Exosome Secretion in Human Retinal Pigment Epithelial Cells in Culture

Affiliations

Inhibition of the Expression of the Small Heat Shock Protein αB-Crystallin Inhibits Exosome Secretion in Human Retinal Pigment Epithelial Cells in Culture

Rajendra K Gangalum et al. J Biol Chem. .

Abstract

Exosomes carry cell type-specific molecular cargo to extracellular destinations and therefore act as lateral vectors of intercellular communication and transfer of genetic information from one cell to the other. We have shown previously that the small heat shock protein αB-crystallin (αB) is exported out of the adult human retinal pigment epithelial cells (ARPE19) packaged in exosomes. Here, we demonstrate that inhibition of the expression of αB via shRNA inhibits exosome secretion from ARPE19 cells indicating that exosomal cargo may have a role in exosome biogenesis (synthesis and/or secretion). Sucrose density gradient fractionation of the culture medium and cellular extracts suggests continued synthesis of exosomes but an inhibition of exosome secretion. In cells where αB expression was inhibited, the distribution of CD63 (LAMP3), an exosome marker, is markedly altered from the normal dispersed pattern to a stacked perinuclear presence. Interestingly, the total anti-CD63(LAMP3) immunofluorescence in the native and αB-inhibited cells remains unchanged suggesting continued exosome synthesis under conditions of impaired exosome secretion. Importantly, inhibition of the expression of αB results in a phenotype of the RPE cell that contains an increased number of vacuoles and enlarged (fused) vesicles that show increased presence of CD63(LAMP3) and LAMP1 indicating enhancement of the endolysosomal compartment. This is further corroborated by increased Rab7 labeling of this compartment (RabGTPase 7 is known to be associated with late endosome maturation). These data collectively point to a regulatory role for αB in exosome biogenesis possibly via its involvement at a branch point in the endocytic pathway that facilitates secretion of exosomes.

Keywords: CD63; LAMP1; Rab5; Rab7; endosome; exosome complex; lysosome; retinal pigment epithelium; secretion; small heat shock protein (sHsp).


Figures

FIGURE 1.
FIGURE 1.
Inhibition of the expression of αB inhibits exosome secretion. A, immunoblot for assessing αB expression in ARPE clones transfected with αB shRNA plasmids (total cell extracts, 30 μg/lane). Native = five different cultures, lanes 1–5; αB shRNA = five independent clones, lanes 1–5; Transfection control = cells transfected with different shRNA constructs that do not inhibit αB expression, five clones, lanes 1–5; Scrambled control = cells transfected with a scrambled shRNA sequence that is not expected to inhibit αB expression, five clones, lanes 1–5. Empty vector construct and other shRNA constructs that did not inhibit expression are not shown. Only the relevant areas of the immunoblots are shown, the one showing reaction against αB antiserum and the other against HSP70 antiserum. HSP70 acts as a loading control. B, immunoblot of the exosomal pellets and the supernatants prepared from the culture media of various shRNA clones identified in the screen shown in A (lane 2 from each immunoblot). Lane 1, exosomal pellet from native ARPE cells; lane 2, an ARPE clone permanently transfected with an shRNA construct where the expression of αB is inhibited (lane 2 in Fig. 1A, αB shRNA panel); lanes 3 and 4 are constructs that do not impact αB expression (represented by the Transfection control panel clones shown in Fig. 1A); lane 5 is one of the clones from the panel Scrambled control shown in Fig. 1A. No exosome markers are detected in lane 2 (clone #2). Lane C, control, a cell extract from native transfected ARPE cells, different from lane 1, which contains proteins from the exosomal pellet isolated from native ARPE cells. C, electron micrographs of negatively stained exosomal pellets made from Control (cells transfected with a scrambled sequence) and from clone #2 where αB expression is silenced (A, αBshRNA, lane 2). D, quantitation of the number of exosomes in the electron micrographs (n = 20) shown in C. E, micrographs of the Control (Native ARPE), αB shRNA (ARPE transfected with clone #2, which does not express αB) and Scrambled (ARPE cells transfected with a scrambled sequence).
FIGURE 2.
FIGURE 2.
Inhibition of exosome secretion from apical and basal surfaces in αB silenced ARPE cells. Confluent monolayers of ARPE19 cells grown on transwell inserts were used to study the apical and basal exosome production using the NRhPE dye, a fluorescent lipid that is internalized by endocytosis and labels exosomes/MVBs (32). The cells were incubated with the NRhPE dye in serum-free medium, washed, and then incubated in the dye-free medium. Exosome preparations obtained from apical and basal medium were used to measure the total fluorescence as an indicator of exosome secretion into the medium (see under “Experimental Procedures”). The ARPE cells (αBshRNA), where αB expression is inhibited, show appreciable decrease in total fluorescence from both apical as well as basal surfaces indicating inhibition of exosome secretion from the apical as well as basal surfaces. αBshRNA = ARPE cell clone where αB expression was inhibited (Fig. 1A, αB shRNA, lane 2); Transfection control = αB shRNA transfected ARPE where there was no inhibition of the expression of αB (Fig. 1A, Transfection control); Scrambled control = ARPE cells transfected with a scrambled αB shRNA sequence that does not inhibit αB expression (Fig. 1A, scrambled control).
FIGURE 3.
FIGURE 3.
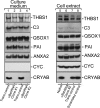
Conventional protein secretion in αB-silenced ARPE cells. Immunoblots of known extracellular proteins of the ARPE19 cells (in the culture medium and cellular extracts) are shown. 40 μg of protein were run on each lane on an SDS-polyacrylamide gel (gradient 4–12%; Life Technologies, Inc.), transferred to a membrane, and probed with following polyclonal antibodies (left panel shows the Culture medium, and the right panel shows total Cell extract immunoblots, respectively): anti-THBS1 (thrombospondin 1); anti-C3 (complement component 3); anti-QSOX1 (quiescin Q6 sulfhydryl oxidase 1); anti-PAI (serpin peptidase inhibitor, clade E (nexin, plasminogen activator inhibitor type 1), member 1); anti-ANXA2 (annexin II); anti-CYC (cytochrome c); and anti-αB (αB-crystallin, CRYAB). Two different clones of ARPE19 cells, permanently transfected with αB shRNA plasmids, that do express αB (lanes 2 and 4) were analyzed (Culture medium; left panel). All five proteins that were expected to be in the medium (as per conventional protein secretion) were detected in transfection control (Trans. control, lanes 1 and 3). Lanes 2 and 4 show absence of αB in the medium of ARPE αB shRNA clones #1 and #2 respectively. Note that cytochrome c (CYC) is not detected in the culture medium of all four cultures indicating that there is no cell death. The right panel shows immunoblots of the cell extracts from the Native un-transfected cells (lane 5), αBshRNA clone #2 (lane 6, αB-crystallin is silenced), transfection control (lane 7), and Scrambled shRNA control (lane 8), where αB-crystallin is not silenced. Based on these data, conventional protein secretion is not directly impacted by the absence of αB expression. In this immunoblot only αB shRNA clone #2 was used (lane 6).
FIGURE 4.
FIGURE 4.
Status of the synthesis of vesicles in αB-silenced ARPE cells. A, profile of AChE activity (top panel) and exosomal markers (bottom panels) in discontinuous sucrose density gradient of the culture medium from control (blue) and αB-silenced (red) ARPE cells. The AChE activity is appreciably reduced (red) and the exosomal markers αB, Flotillin 1 (Flot-1), Enolase 1 (Eno-1), Alix, Hsp70, and Hsp90β, as analyzed by immunoblotting are barely detectable (bottom panels), consistent with the absence of exosomes in the medium from αB-silenced cells (αBshRNA). B, discontinuous sucrose density gradient fractionation of cellular extracts. There is about 50% loss of AChE activity (compare blue and yellow area). Note the presence of exosomal markers (Flot-1, Eno-1, Hsp60, and Hsp70; anti-Alix and anti-Hsp90β were not used here) (bottom panels) in the fractions containing the AChE activity, suggesting continued synthesis of exosomes. E = native ARPE cellular extract (30 μg). Fractions 1 and 20 represent the bottom and the top of the gradient, respectively. Total protein profiles are presented as insets in the respective top panels. It is important to note that these cells were cultured in serum-free medium. C, this is a control gradient run with Triton X-100-treated medium from the native ARPE cells. Top panel shows profile of the AChE activity and the bottom two panels show immunoblots of fractions collected from each gradient. The samples were treated with Triton X-100 for 30 min at 4 °C (red, 0.1%, and blue, 1% Triton X-100) before loading on the gradient. Triton X-100 does not alter the AChE activity nor the immunoblot profiles markedly.
FIGURE 5.
FIGURE 5.
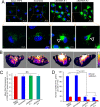
Inhibition of αB expression leads to aggregated patterns of CD63 (LAMP3) distribution. A, confocal images of ARPE cells (z-sections) showing distribution of CD63(LAMP3) (FITC, green)-labeled vesicles. A magnified view of the corresponding individual z-slice (0.5 μm) from a single cell is shown on the bottom panel. Note that in native and scrambled control cells the CD63(LAMP3)-labeled vesicles are dispersed throughout the cytoplasm, while there is a peri-nuclear accumulation of these vesicles (open arrowheads) in αB-silenced cells (αB shRNA #1 and αB shRNA #2). B, three-dimensional surface plots of the z-slices magnified in A. C, quantitation of CD63(LAMP3) cellular fluorescence in the z-slices shown in A. Although the perinuclear accumulation of CD63(LAMP3) fluorescence in αB-inhibited cells (αB shRNA #1 and αB shRNA #2) appears increased, there is no significant difference in the total anti-CD63 fluorescence in all four groups of cells. D, quantitation of the number of vesicles. There is significant difference in the distribution of vesicles in the αB shRNA cells where the vesicles are largely stacked and are therefore not counted as single units as in the native ARPE and in scrambled control cells. Note that the vesicles were grouped as Small (≤120 nm) and Medium (≥121 nm); note that the data clearly indicate large changes in both categories because of the stacking and/or fusion in αB-silenced cells.
FIGURE 6.
FIGURE 6.
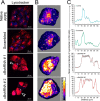
Inhibition of αB expression leads to altered patterns of lysosomal staining in αB-inhibited ARPE cells. A, live cell images of ARPE cells incubated in Lysotracker Red DND-99 (that stains the acidic organelles in red) show a dispersed pattern in native and scrambled control ARPE cells (upper two panels). However, in cells where αB expression is inhibited, clumped or aggregated staining is seen (αB shRNA #1 and αB shRNA #2, white arrowheads). B, three-dimensional surface plots of individual cells shown by asterisks in A. The images were oriented such that the cellular nucleus (N) was on the same side. The pseudocolor scale shows intensity. White, high; dark blue, low. C, quantitation of distribution of LysoTracker fluorescence in native (blue line), scrambled (green line), and αBshRNAs #1 and #2 (brown and red lines, respectively) ARPE cells using ImageJ plot profiles (mean pixel intensity is expressed ± S.E.). αB-silenced ARPE cells show multiple high mean peak pixel intensities across the cytoplasm indicating altered distribution of lysosomal components.
FIGURE 7.
FIGURE 7.
αB-silenced ARPE cells show enhanced vesicles and vacuolar fusion. A, electron micrograph of a control ARPE cell (scrambled shRNA control) showing endosomes and MVBs (magnified images panels a and b, bottom) in the perinuclear region with various other cell organelles (mitochondria, endoplasmic reticulum, and Golgi complex) (B), electron micrograph of an αB-silenced ARPE cell (αBshRNA). Note the presence of a large number of vacuoles all over the cytoplasm. There are abnormal vesicles, which may represent fused endosomes/MVBs and endo-lysosomes (see boxed and magnified images in panels a–e). Note that there is a lot of electron dense material in most of the fused vesicles. Scale bars, 200 nm.
FIGURE 8.
FIGURE 8.
Inhibition of the expression of αB leads to an enhancement of the endolysosomal compartment. ARPE cell monolayers were gently scraped from the culture dish and processed for double immunogold labeling with anti-CD63 (LAMP3) (12-nm gold particles, endosomal marker) and anti-LAMP1 (18-nm gold particles, lysosomal marker). A, TEM of control ARPE cells show sparsely labeled CD63 (LAMP3) (white arrows) and LAMP1 (white, open arrowheads) in endolysosomes (magnified images). B, αB-silenced ARPE cells (αBshRNA) show clusters of 12-nm gold particles (CD63(LAMP 3) white arrows) and 18-nm gold particles (LAMP1, white, open arrowheads) within fused/enhanced endolysosomal vesicles (magnified images on the right). C, quantitation of the number of gold particles inside the vesicles in control and αB-silenced cells (αBshRNA) (n = 110, represent number of vesicles). Asterisks indicate statistically significant differences. ***, p < 0.001 (one-way analysis of variance followed by Tukey's post hoc test). Scale bars, 200 nm. D, immunoblot of whole cell extracts showing some enhancement of LAMP1 immune reaction (white asterisks) but no discernible change in CD63 (LAMP3) and HSP70 (run as an internal control). E, quantitation of the immunoblot shown in D. The control cells here are the transfected cells that did not show inhibition of αB expression (Fig. 1A, Transfection control).
FIGURE 9.
FIGURE 9.
Increased presence of Rab7 in αB-silenced ARPE cells. ARPE cells were immunogold-labeled with anti-Rab5 (early endosome marker) and anti-Rab7 (late endosome marker). A, TEM of four endosomes from control ARPE cells (top panel) shows insignificant Rab5 labeling (12-nm gold particles) and moderately labeled Rab7 (18-nm gold particles). In contrast, there is enhanced immunolabeling of Rab7 (18-nm gold particles) in the endolysosomal compartment with no perceptible change in Rab5 (12-nm gold particles) in αB-silenced (αBshRNA) ARPE cells. Three micrographs of potentially fused vesicles (representing enhanced endolysosomal compartment) are shown. B, quantitation of immunogold labeling by ImageJ (analysis of particles) shows a 5-fold increase in Rab7 labeling but not in the Rab5. C, immunoblots of whole cell extracts for αB, Rab5, Rab7, and HSP70 in native, αB shRNA, transfection control, and scramble control ARPE cells. Note a noticeable increase in Rab7 in αB shRNA lane (white arrow) but no detectable change in Rab5 or HSP70 (run as an internal control). D, quantitation of the immunoblots shown in C. The data in C and D corroborate the TEM data in A and B.
FIGURE 10.
FIGURE 10.
Schematic representation of exosome biogenesis in presence and absence of αB expression in ARPE cells. The left schematic shows facilitation of exosome secretion by αB in native ARPE cells (αB on the dotted arrow pointing to the plasma membrane). Note that we have shown αB inside the exosomes based on previously published work (22). It remains to be established whether all the exosomes contain αB; therefore, we have shown about 20% of the exosomes without αB. The right schematic shows enhancement of the endolysosomal compartment (fused vesicles) in the absence of αB in ARPE-αB shRNA cells. Note that this enhancement is consistent with the increase in the LAMP1 (Fig. 8) and Rab7 labeling in this compartment (Fig. 9).

Similar articles

Cited by

References

    1. Hanson P. I., and Cashikar A. (2012) Multivesicular body morphogenesis. Annu. Rev. Cell Dev. Biol. 28, 337–362 - PubMed
    1. Manjithaya R., and Subramani S. (2011) Autophagy: a broad role in unconventional protein secretion? Trends Cell Biol. 21, 67–73 - PMC - PubMed
    1. Simons M., and Raposo G. (2009) Exosomes–vesicular carriers for intercellular communication. Curr. Opin. Cell Biol. 21, 575–581 - PubMed
    1. Zhang M., and Schekman R. (2013) Cell biology. Unconventional secretion, unconventional solutions. Science 340, 559–561 - PubMed
    1. Bok D. (1985) Retinal photoreceptor-pigment epithelium interactions. Friedenwald lecture. Invest. Ophthalmol. Vis. Sci. 26, 1659–1694 - PubMed

Publication types

MeSH terms

Substances