Synergistic Action of Actinoporin Isoforms from the Same Sea Anemone Species Assembled into Functionally Active Heteropores
- PMID: 27129251
- PMCID: PMC4933170
- DOI: 10.1074/jbc.M115.710491
Synergistic Action of Actinoporin Isoforms from the Same Sea Anemone Species Assembled into Functionally Active Heteropores
Abstract
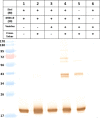
Among the toxic polypeptides secreted in the venom of sea anemones, actinoporins are the pore-forming toxins whose toxic activity relies on the formation of oligomeric pores within biological membranes. Intriguingly, actinoporins appear as multigene families that give rise to many protein isoforms in the same individual displaying high sequence identities but large functional differences. However, the evolutionary advantage of producing such similar isotoxins is not fully understood. Here, using sticholysins I and II (StnI and StnII) from the sea anemone Stichodactyla helianthus, it is shown that actinoporin isoforms can potentiate each other's activity. Through hemolysis and calcein releasing assays, it is revealed that mixtures of StnI and StnII are more lytic than equivalent preparations of the corresponding isolated isoforms. It is then proposed that this synergy is due to the assembly of heteropores because (i) StnI and StnII can be chemically cross-linked at the membrane and (ii) the affinity of sticholysin mixtures for the membrane is increased with respect to any of them acting in isolation, as revealed by isothermal titration calorimetry experiments. These results help us understand the multigene nature of actinoporins and may be extended to other families of toxins that require oligomerization to exert toxicity.
Keywords: equinatoxin; erythrocyte; ion channel; lipid-protein interaction; lysis; oligomerization; pore-forming-toxin; protein cross-linking; sticholysin; toxin.
© 2016 by The American Society for Biochemistry and Molecular Biology, Inc.
Figures


Similar articles
-
Structural and functional characterization of sticholysin III: A newly discovered actinoporin within the venom of the sea anemone Stichodactyla helianthus.Arch Biochem Biophys. 2020 Aug 15;689:108435. doi: 10.1016/j.abb.2020.108435. Epub 2020 May 30. Arch Biochem Biophys. 2020. PMID: 32485153
-
Sticholysin I-II oligomerization in the absence of membranes.FEBS Lett. 2022 Apr;596(8):1029-1036. doi: 10.1002/1873-3468.14326. Epub 2022 Mar 9. FEBS Lett. 2022. PMID: 35253212
-
Differential Effect of Membrane Composition on the Pore-Forming Ability of Four Different Sea Anemone Actinoporins.Biochemistry. 2016 Dec 6;55(48):6630-6641. doi: 10.1021/acs.biochem.6b01007. Epub 2016 Nov 22. Biochemistry. 2016. PMID: 27933793
-
Functional and Structural Variation among Sticholysins, Pore-Forming Proteins from the Sea Anemone Stichodactyla helianthus.Int J Mol Sci. 2020 Nov 24;21(23):8915. doi: 10.3390/ijms21238915. Int J Mol Sci. 2020. PMID: 33255441 Free PMC article. Review.
-
Sticholysins, two pore-forming toxins produced by the Caribbean Sea anemone Stichodactyla helianthus: their interaction with membranes.Toxicon. 2009 Dec 15;54(8):1135-47. doi: 10.1016/j.toxicon.2009.02.022. Epub 2009 Mar 4. Toxicon. 2009. PMID: 19268489 Review.
Cited by
-
Oligomerization of Sticholysins from Förster Resonance Energy Transfer.Biochemistry. 2021 Feb 2;60(4):314-323. doi: 10.1021/acs.biochem.0c00840. Epub 2021 Jan 14. Biochemistry. 2021. PMID: 33445865 Free PMC article.
-
Sea Anemones, Actinoporins, and Cholesterol.Int J Mol Sci. 2022 Aug 7;23(15):8771. doi: 10.3390/ijms23158771. Int J Mol Sci. 2022. PMID: 35955905 Free PMC article. Review.
-
Actinoporins: From the Structure and Function to the Generation of Biotechnological and Therapeutic Tools.Biomolecules. 2020 Apr 2;10(4):539. doi: 10.3390/biom10040539. Biomolecules. 2020. PMID: 32252469 Free PMC article. Review.
-
Transcriptomic Profiling Reveals Extraordinary Diversity of Venom Peptides in Unexplored Predatory Gastropods of the Genus Clavus.Genome Biol Evol. 2020 May 1;12(5):684-700. doi: 10.1093/gbe/evaa083. Genome Biol Evol. 2020. PMID: 32333764 Free PMC article.
-
Multigene Family of Pore-Forming Toxins from Sea Anemone Heteractis crispa.Mar Drugs. 2018 May 24;16(6):183. doi: 10.3390/md16060183. Mar Drugs. 2018. PMID: 29794988 Free PMC article.
References
-
- Macek P. (1992) Polypeptide cytolytic toxins from sea anemones (Actiniaria). FEMS Microbiol. Immunol. 5, 121–129 - PubMed
-
- Anderluh G., and Macek P. (2002) Cytolytic peptide and protein toxins from sea anemones (Anthozoa: Actiniaria). Toxicon 40, 111–124 - PubMed
-
- Alegre-Cebollada J., Oñaderra M., Gavilanes J. G., and del Pozo A. (2007) Sea anemone actinoporins: the transition from a folded soluble state to a functionally active membrane-bound oligomeric pore. Curr. Protein Pept. Sci. 8, 558–572 - PubMed
-
- García-Ortega L., Alegre-Cebollada J., García-Linares S., Bruix M., Martínez-Del-Pozo A., and Gavilanes J. G. (2011) The behavior of sea anemone actinoporins at the water-membrane interface. Biochim. Biophys. Acta 1808, 2275–2288 - PubMed
-
- Parker M. W., and Feil S. C. (2005) Pore-forming protein toxins: from structure to function. Prog. Biophys. Mol. Biol. 88, 91–142 - PubMed
Publication types
MeSH terms
Substances
LinkOut - more resources
Full Text Sources
Other Literature Sources

