. 2016 Jun 17;291(25):13175-93.
doi: 10.1074/jbc.M115.712083. Epub 2016 Apr 18.

The Dynamics and Turnover of Tau Aggregates in Cultured Cells: INSIGHTS INTO THERAPIES FOR TAUOPATHIES

Affiliations

The Dynamics and Turnover of Tau Aggregates in Cultured Cells: INSIGHTS INTO THERAPIES FOR TAUOPATHIES

Jing L Guo et al. J Biol Chem. .

Abstract

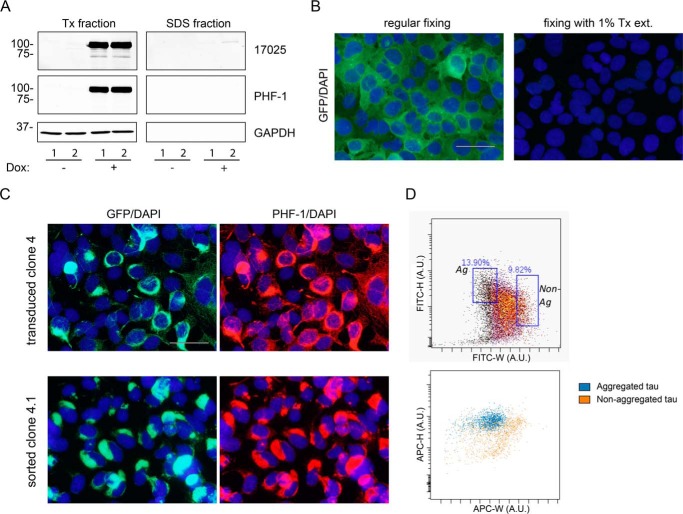
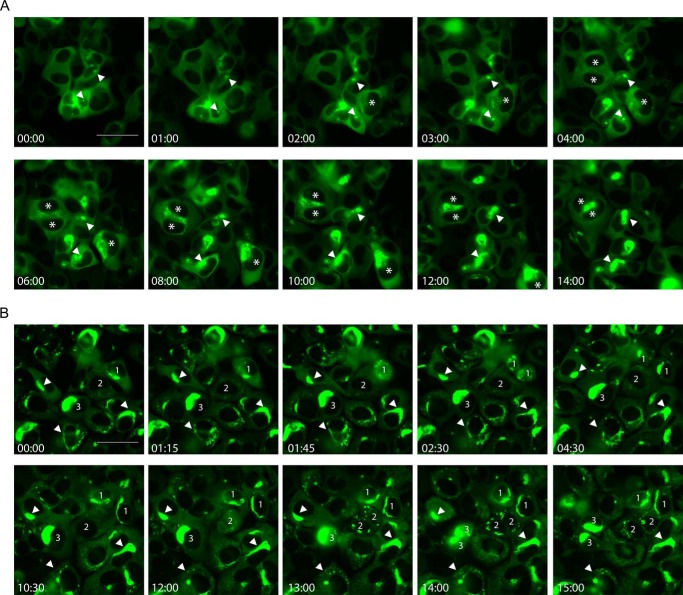
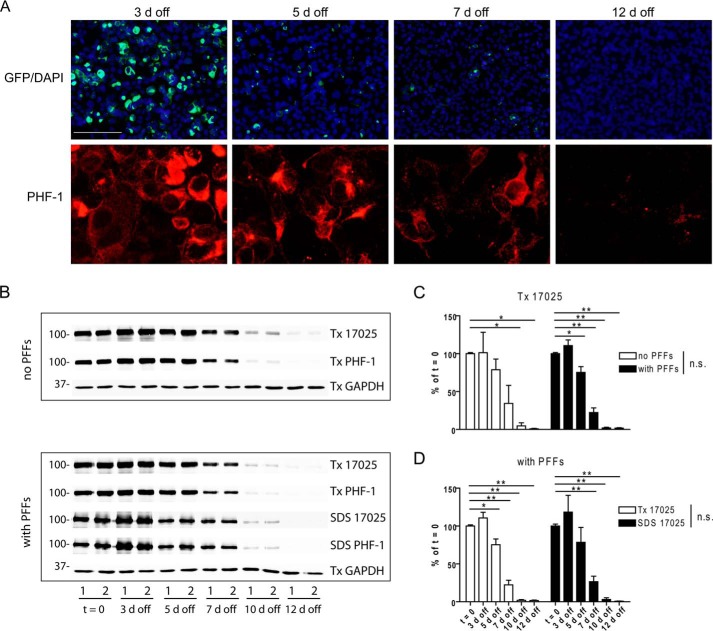
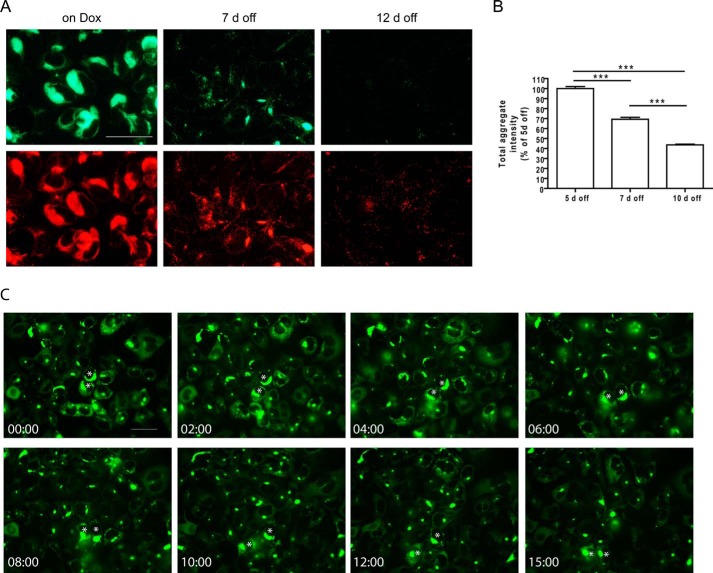
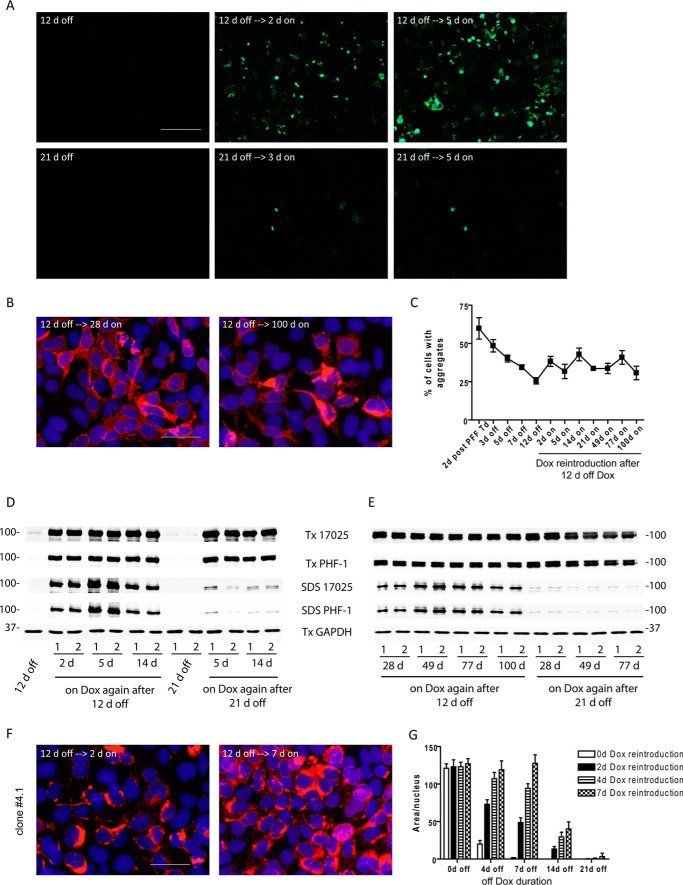
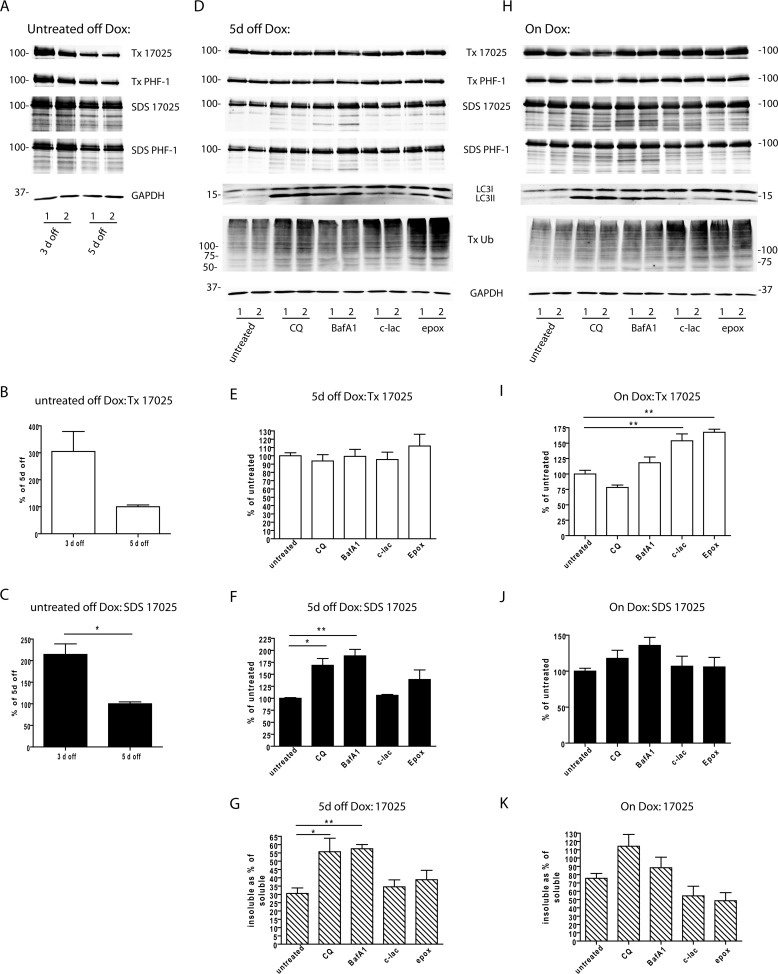
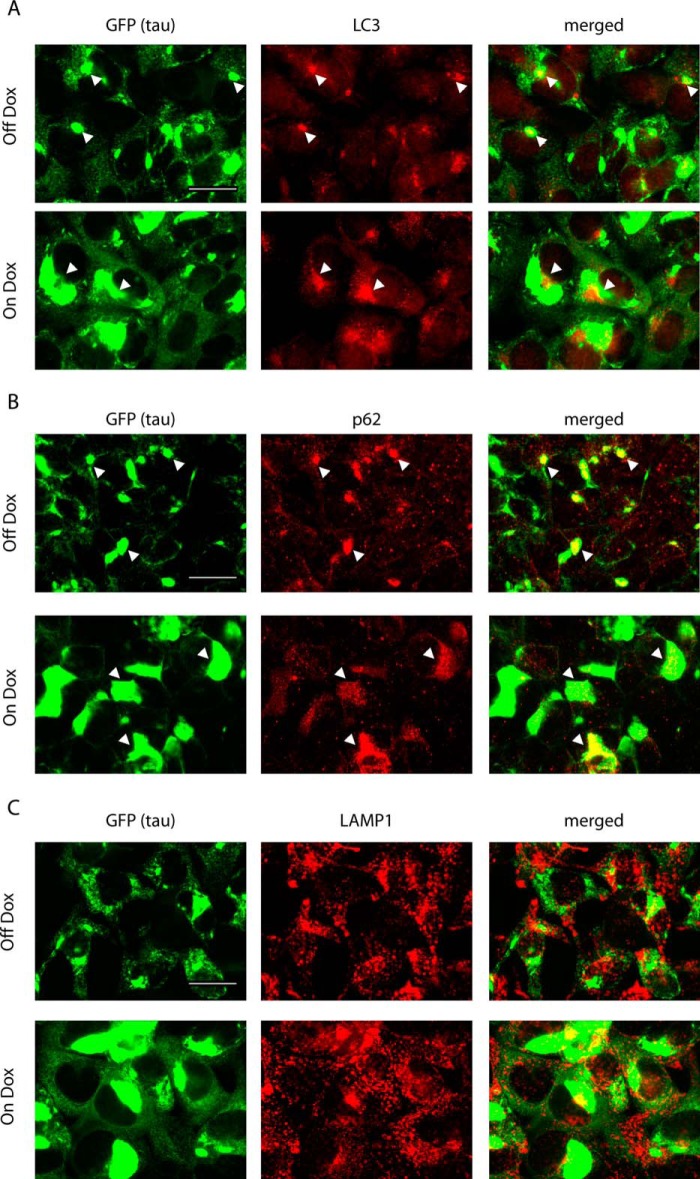
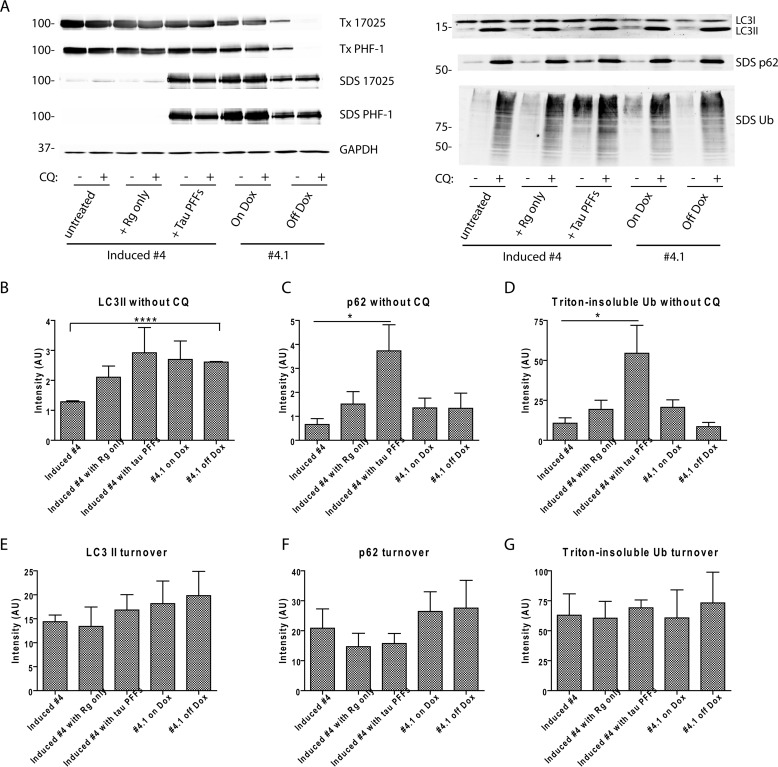
Filamentous tau aggregates, the hallmark lesions of Alzheimer disease (AD), play key roles in neurodegeneration. Activation of protein degradation systems has been proposed to be a potential strategy for removing pathological tau, but it remains unclear how effectively tau aggregates can be degraded by these systems. By applying our previously established cellular model system of AD-like tau aggregate induction using preformed tau fibrils, we demonstrate that tau aggregates induced in cells with regulated expression of full-length mutant tau can be gradually cleared when soluble tau expression is suppressed. This clearance is at least partially mediated by the autophagy-lysosome pathway, although both the ubiquitin-proteasome system and the autophagy-lysosome pathway are deficient in handling large tau aggregates. Importantly, residual tau aggregates left after the clearance phase leads to a rapid reinstatement of robust tau pathology once soluble tau expression is turned on again. Moreover, we succeeded in generating monoclonal cells persistently carrying tau aggregates without obvious cytotoxicity. Live imaging of GFP-tagged tau aggregates showed that tau inclusions are dynamic structures constantly undergoing "fission" and "fusion," which facilitate stable propagation of tau pathology in dividing cells. These findings provide a greater understanding of cell-to-cell transmission of tau aggregates in dividing cells and possibly neurons.

Keywords: Alzheimer disease; autophagy; protein aggregation; protein degradation; tau protein (tau).


Figures

FIGURE 1.
FIGURE 1.
Generation of a stable clone persistently carrying tau aggregates. A, a monoclonal cell line with Dox-regulated expression of T40/P301L-GFP (clone 4) was sequentially extracted by 1% Triton X-100 lysis buffer (Tx) followed by 2% SDS lysis buffer and immunoblotted with a polyclonal pan-tau antibody 17025 and phospho-tau antibody PHF-1 (pS396/S404). GAPDH was used as the loading control. Little tau expression was observed in cells grown in Dox-free medium (−). Although abundant tau expression was detected after 2 days induction with 1 μg/ml of Dox (+), no appreciable Triton-insoluble tau was recovered in the SDS fraction. B, in clone 4 cells that are induced with Dox, GFP-tagged tau remained largely soluble and can be completely removed by 1% Triton X-100 extraction during fixing (1% Tx ext.). Cells were counterstained with DAPI to visualize cell nuclei. C, top panels: Triton-insoluble tau accumulated in Dox-induced clone 4 cells after transduction of Myc-K18/P301L PFFs mediated by BioPORTER reagent; bottom panels, a monoclonal cell line stably carrying tau aggregates (clone 4.1) was generated after 3-week passaging and subcloning of Myc-K18/P301L PFF-transduced clone 4 cells followed by fluorescence-activated cell sorting. As in B, soluble proteins were extracted by 1% Triton X-100 during fixing. GFP-tagged tau aggregates (left column) also showed immunoreactivity for PHF-1 (right column). D, top panel, clone 4.1 cells were sorted based on GFP signals as described under “Experimental Procedures.” About 13.9% of cells were selected as positive for aggregates (Ag), and about 9.82% as negative for aggregates (Non-Ag). The two categories of cells were separately cultured after sorting. Bottom panel: immunostaining with APC-conjugated AT8 antibody (specific for tau phosphorylated at Ser-202/Thr-205) showed that cells located within the Ag gate based on the GFP signals (blue dots) are characterized by lower APC-W signals (in A.U., arbitrary units), corresponding to more condensed punctuate aggregates, as compared with the more diffuse distribution with higher APC-W signals for cells in the Non-Ag gate (orange dots). Scale bars: 50 μm for B and C.
FIGURE 2.
FIGURE 2.
The dynamics of tau aggregates. A, selected snapshots from live imaging of clone 4 cells starting at 6–7 h after transduction of tau PFFs. Arrowheads point to examples of small focal inclusions developing into large aggregates, whereas stars mark examples of cells initially harboring diffuse aggregates. See supplemental Movie S1 for the complete time-lapse video. B, selected snapshots from live imaging of clone 4.1 cells with persistent tau aggregates. Numbers 1–3 mark examples of dividing cells. Arrowheads point to examples of aggregates showing morphological reorganization. See supplemental Movie S2 for the complete time-lapse video. Relative timing of the snapshots was presented as hh:mm. Scale bars: 50 μm.
FIGURE 3.
FIGURE 3.
Clearance of tau aggregates in tau PFF-transduced clone 4 cells following suppression of soluble tau expression. A, Triton-insoluble tau aggregates were shown at different time points after tau PFF-transduced clone 4 cells were cultured on Dox-free medium (3 to 12 days off Dox). Soluble proteins were removed by 1% Triton X-100 extraction during fixing. Scale bar: 200 μm for GFP; 50 μm for PHF-1. B, clone 4 cells with or without tau PFF transduction were sequentially extracted by 1% Triton X-100 lysis buffer (Tx) followed by 2% SDS lysis buffer (SDS) after different off Dox durations and immunoblotted with 17025 and PHF-1. Only the Triton X-100 fraction was shown for cells without tau PFF transduction as these cells do not contain Triton X-100-insoluble tau (see Fig. 1A). GAPDH served as a loading control; “t = 0” refers to the time point right before Dox removal. Samples from duplicate wells of a representative set of experiments were shown as 1 and 2. C and D, densitometry quantifications of 17025 immunoblots for experiments shown in B. Independent sets of experiments used for quantification: n = 2 for “no PFFs” cells; n = 4 for “with PFFs” cells, but only 2 sets of experiments had 10-day off time points, and 3 sets had 12-day off time points. Measurements were normalized to t = 0 samples in each set and shown as mean ± S.E. C compares clearance of Triton X-100-soluble tau in cells with and without tau PFF transduction, whereas D compares clearance of Triton X-100-soluble and -insoluble (i.e. SDS-soluble) tau in cells with PFF transduction. For both C and D, two-way ANOVA showed a significant effect of time on tau levels (p < 0.0001) but a non-significant difference between no PFFs and with PFFs cells or between Triton X-100-soluble and -insoluble tau in PFF-transduced cells. Dunnett's post hoc test was performed for pairwise comparisons between t = 0 and each of the other time points, with significant differences marked in the graphs. *, p < 0.05. **, p < 0.01. Quantification of PHF-1 blots revealed similar trends (data not shown). n.s., non-significant.
FIGURE 4.
FIGURE 4.
Clearance of tau aggregates in clone 4.1 cells following suppression of soluble tau expression. A, Triton-insoluble tau aggregates labeled by GFP signals (top panels) and PHF-1 immunostaining (bottom panels) in clone 4.1 cells maintained on Dox or at 7 or 12 days off Dox. Scale bar, 50 μm. B, whole coverslip quantifications for the total intensity of Triton-insoluble GFP-positive tau aggregates in clone 4.1 cells at 5, 7, and 10 days off Dox. Cells were plated onto the coverslips at 5 days off Dox and no further passaging was performed thereafter. Three independent sets of experiments were performed, with the total aggregate intensity measurements normalized to that of 5 days off Dox within each set of experiment. Data are shown as mean ± S.E. One-way ANOVA was performed followed by Tukey's post hoc test for all pairwise comparisons. ***, p < 0.001. C, selected snapshots from live imaging of clone 4.1 cells from 4 days off Dox to 5 days off Dox. Stars mark examples of large and elongated aggregates getting consolidated into smaller round inclusions. See supplemental Movie S3 for the complete time-lapse video. Relative timing of the snapshots was presented as hh:mm. Scale bar, 50 μm.
FIGURE 5.
FIGURE 5.
Re-emergence and long-term propagation of tau aggregates after restoration of soluble tau expression. A, Triton-insoluble tau aggregates visualized by GFP signals were shown for 2 paradigms of Dox removal (12 or 21 days off Dox) followed by different incubation times after the reintroduction of Dox to the cell medium. Scale bar, 200 μm. B, Triton-insoluble tau aggregates recognized by PHF-1 (red) continued to accumulate in a subset of cells up to 100 days after soluble tau expression was restored following 12 days off Dox. Scale bar, 50 μm. C, quantification of the percentage of tau aggregate-bearing cells upon modulation of soluble tau expression in tau PFF-transduced clone 4 cells. “2 d post-PFF Td” refers to 2 days after the transduction of tau PFFs right before cells were withdrawn from Dox. Data are shown as mean ± S.E. based on 3 independent sets of experiments. D and E, immunoblotting of sequentially extracted cell lysates (Tx: 1% Triton X-100 lysis buffer; SDS, 2% SDS lysis buffer) from tau PFF-transduced clone 4 cells at different time points after cells were placed back on Dox-containing medium following either 12 or 21 days off Dox. Samples from duplicate wells of a representative set of experiment were shown as 1 and 2. F, Triton-insoluble tau aggregates (PHF-1 in red) similarly re-emerged in clone 4.1 cells after Dox reintroduction. Scale bar, 50 μm. G, differential re-emergence of tau pathology in clone 4.1 cells with different off Dox durations followed by different durations of Dox reintroduction. The extent of tau pathology was scored as the area occupied by GFP signals normalized to nuclear count with soluble protein extracted during fixing. Results from one set of experiments are shown here as mean ± S.D., whereby each bar represents readings from 16 replicate wells.
FIGURE 6.
FIGURE 6.
Degradation of tau aggregates by autophagy pathway. A, clone 4.1 cells that were 3 or 5 days off Dox were sequentially extracted with 1% Triton X-100 lysis buffer (Tx) followed by 2% SDS lysis buffer (SDS) and immunoblotted with 17025 and PHF-1. B and C, densitometry quantification of 17025 immunoblots as shown in A based on 2 independent sets of experiments. Student's t test was performed. *, p < 0.05. D, clone 4.1 cells were treated with pharmacological inhibitors of lysosomes (CQ: 30 μm chloroquine diphosphate; BafA1, 200 nm bafilomycin A1) or proteasomes (c-lac, 10 μm clasto-lactacystin β-lactone; epox, 20 nm epoxomicin) from 3 to 5 days off Dox and sequentially extracted. Immunoblotting with different antibodies was shown for one representative set of experiments, where 1 and 2 indicate samples from duplicate wells. Antibody against ubiquitin (Ub) revealed high molecular weight-ubiquitinated proteins. LC3 and GAPDH immunoblotting was only performed on the Triton X-100 fraction because they are fully extractable by 1% Triton X-100 lysis buffer. The LC3 antibody recognizes both LC3I (∼18 kDa) and LC3-II (∼14 kDa). E--G, densitometry quantification of 17025 immunoblots for experiments shown in D. H, the same experiment as shown in D was performed on clone 4.1 cells maintained on Dox. I–K, densitometry quantification of 17025 immunoblots for experiments shown in H. Quantifications were shown for Triton X-100-soluble tau (E and I), SDS-soluble tau (F and J), and SDS-soluble tau expressed as % of Triton X-100-soluble tau (G and K). As the volume of the SDS fraction is one-third of the volume of the Triton X-100 fraction for each biological sample, the amounts of tau in the SDS fraction measured from the immunoblots were divided by 3 for the calculation. For off Dox experiments: n = 4 independent experiments except for n = 3 for epox treatment group. For on Dox experiments: n = 3 independent experiments. Data are shown as mean ± S.E. One-way ANOVA was performed followed by Dunnett's post hoc test for pairwise comparisons between each drug treatment condition and the untreated control. *, p < 0.05. **, p < 0.01.
FIGURE 7.
FIGURE 7.
Recruitment of autophagosomes by tau aggregates. A–C, immunostaining of LC3, p62, and LAMP1 for clone 4.1 cells that were either removed from Dox for 4–5 days (Off Dox) or maintained on Dox (On Dox). Tau aggregates were visualized by GFP signals. Arrowheads point to examples of apparent colocalization or close physical association between tau aggregates and autophagosome markers. Scale bars, 50 μm.
FIGURE 8.
FIGURE 8.
Reduced colocalization between tau aggregates and autophagy markers with lysosomal inhibition. A–C, immunostaining of LC3, p62, and LAMP1 for CQ-treated clone 4.1 cells that were either removed from Dox for 4–5 days (Off Dox) or maintained on Dox (On Dox). Tau aggregates were visualized by GFP signals. Cells were treated with 30 μm CQ for 1 day before fixing. Scale bars, 50 μm. D and E, Manders coefficient measuring the fraction of LC3 or p62 signals with overlapping tau aggregates for clone 4.1 cells with and without CQ treatment. Quantification was based on 3 independent sets of experiments. Data are shown as mean ± S.E. Within off Dox or on Dox groups, Student's t test was performed for comparisons between cells with and without a 1-day CQ treatment. *, p < 0.05. **, p < 0.005.
FIGURE 9.
FIGURE 9.
Tau aggregation does not lead to significant impairment of autophagy flux. A, autophagy flux assay was conducted on 5 groups of cells: 1) induced clone 4 cells, 2) induced clone 4 cells newly treated with BioPORTER reagent, 3) induced clone 4 cells newly transduced with tau PFFs mediated by BioPORTER reagent, 4) clone 4.1 cells maintained on Dox, and 5) clone 4.1 cells withdrawn from Dox for 5 days. Levels of autophagy substrates (LC3-II, p62, and Triton (Tx)-insoluble ubiquitinated proteins) were compared for each group of cells with and without 2 days treatment of 30 μm CQ that blocked lysosomal degradation. Although LC3-II was completely extracted by 1% Triton X-100 lysis buffer, p62 was predominantly found in the SDS fraction. Differential solubility of tau in these 5 groups of cells was confirmed by immunoblotting with 17025 and PHF-1. GAPDH served as loading control. Immunoblots from one representative set of experiment were shown. B–D, densitometry quantification of LC3-II, p62, and Triton-insoluble ubiquitinated proteins for the experimental conditions shown. E–G, turnover of the three types of autophagy substrates during the 2-day period was estimated by (level with CQ treatment − level without CQ treatment). For B–G, quantification was based on 4 independent sets of experiment, except for n = 3 for clone 4.1 cells off Dox. Data are shown as mean ± S.E. *, p < 0.05. ****, p < 0.0000005.
FIGURE 10.
FIGURE 10.
Differential interactions of UPS with tau and α-syn aggregates. A and B, ubiquitin and 20S staining for induced clone 4 cells at 2 days after tau PFF transduction. C and D, ubiquitin and 20S staining for clone 4.1 cells with transiently induced α-syn aggregates at 1 or 2 days after α-syn PFF transduction. Tau aggregates were visualized by GFP signals. α-Syn aggregates were labeled by antibodies specific for phosphorylated α-Syn (p-syn). Soluble proteins were extracted by 1% Triton X-100 during fixing. Scale bars, 50 μm. E and F, Manders coefficient for the fraction of area occupied by tau or α-Syn aggregates with colocalizing ubiquitin or 20S signals. Four conditions were quantified: 1) tau aggregates in clone 4 cells at 2 days after tau PFF transduction, 2) tau aggregates in clone 4.1 cells, 3) tau aggregates in clone 4.1 cells with transiently induced α-syn aggregates, and 4) transiently induced α-Syn aggregates in clone 4.1 cells. Quantification was based on 3 independent sets of experiments. Data are shown as mean ± S.E. The following pairwise comparisons were made using Student's t test: 1 versus 2, 2 versus 3, and 1 versus 4. *, p < 0.05. ***, p < 0.0005.

References

    1. Lee V. M., Goedert M., and Trojanowski J. Q. (2001) Neurodegenerative tauopathies. Annu. Rev. Neurosci. 24, 1121–1159 - PubMed
    1. Cleveland D. W., Hwo S. Y., and Kirschner M. W. (1977) Purification of tau, a microtubule-associated protein that induces assembly of microtubules from purified tubulin. J. Mol. Biol. 116, 207–225 - PubMed
    1. Drechsel D. N., Hyman A. A., Cobb M. H., and Kirschner M. W. (1992) Modulation of the dynamic instability of tubulin assembly by the microtubule-associated protein tau. Mol. Biol. Cell 3, 1141–1154 - PMC - PubMed
    1. Ballatore C., Lee V. M., and Trojanowski J. Q. (2007) tau-mediated neurodegeneration in Alzheimer's disease and related disorders. Nat. Rev. Neurosci. 8, 663–672 - PubMed
    1. Arriagada P. V., Growdon J. H., Hedley-Whyte E. T., and Hyman B. T. (1992) Neurofibrillary tangles but not senile plaques parallel duration and severity of Alzheimer's disease. Neurology 42, 631–639 - PubMed

Publication types

LinkOut - more resources