

Update on the safety and efficacy of retroviral gene therapy for immunodeficiency due to adenosine deaminase deficiency
- PMID: 27129325
- PMCID: PMC5325048
- DOI: 10.1182/blood-2016-01-688226
Update on the safety and efficacy of retroviral gene therapy for immunodeficiency due to adenosine deaminase deficiency
Erratum in
-
Cicalese MP, Ferrua F, Castagnaro L, et al. Update on the safety and efficacy of retroviral gene therapy for immunodeficiency due to adenosine deaminase deficiency. Blood. 2016;128(1):45-54.Blood. 2017 Jun 15;129(24):3271. doi: 10.1182/blood-2017-05-782862. Blood. 2017. PMID: 28620107 Free PMC article. No abstract available.
Abstract
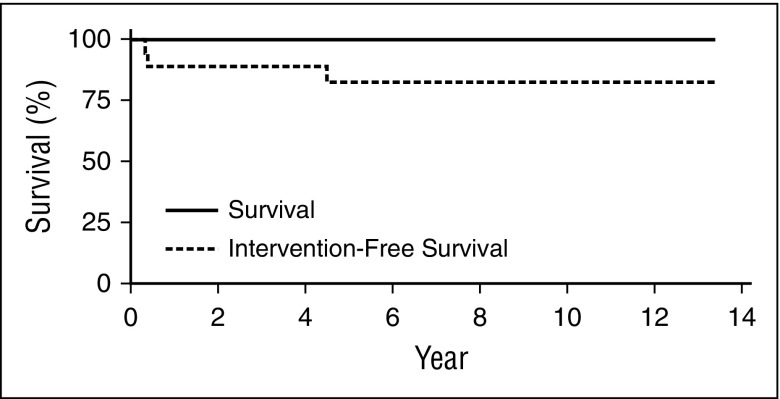
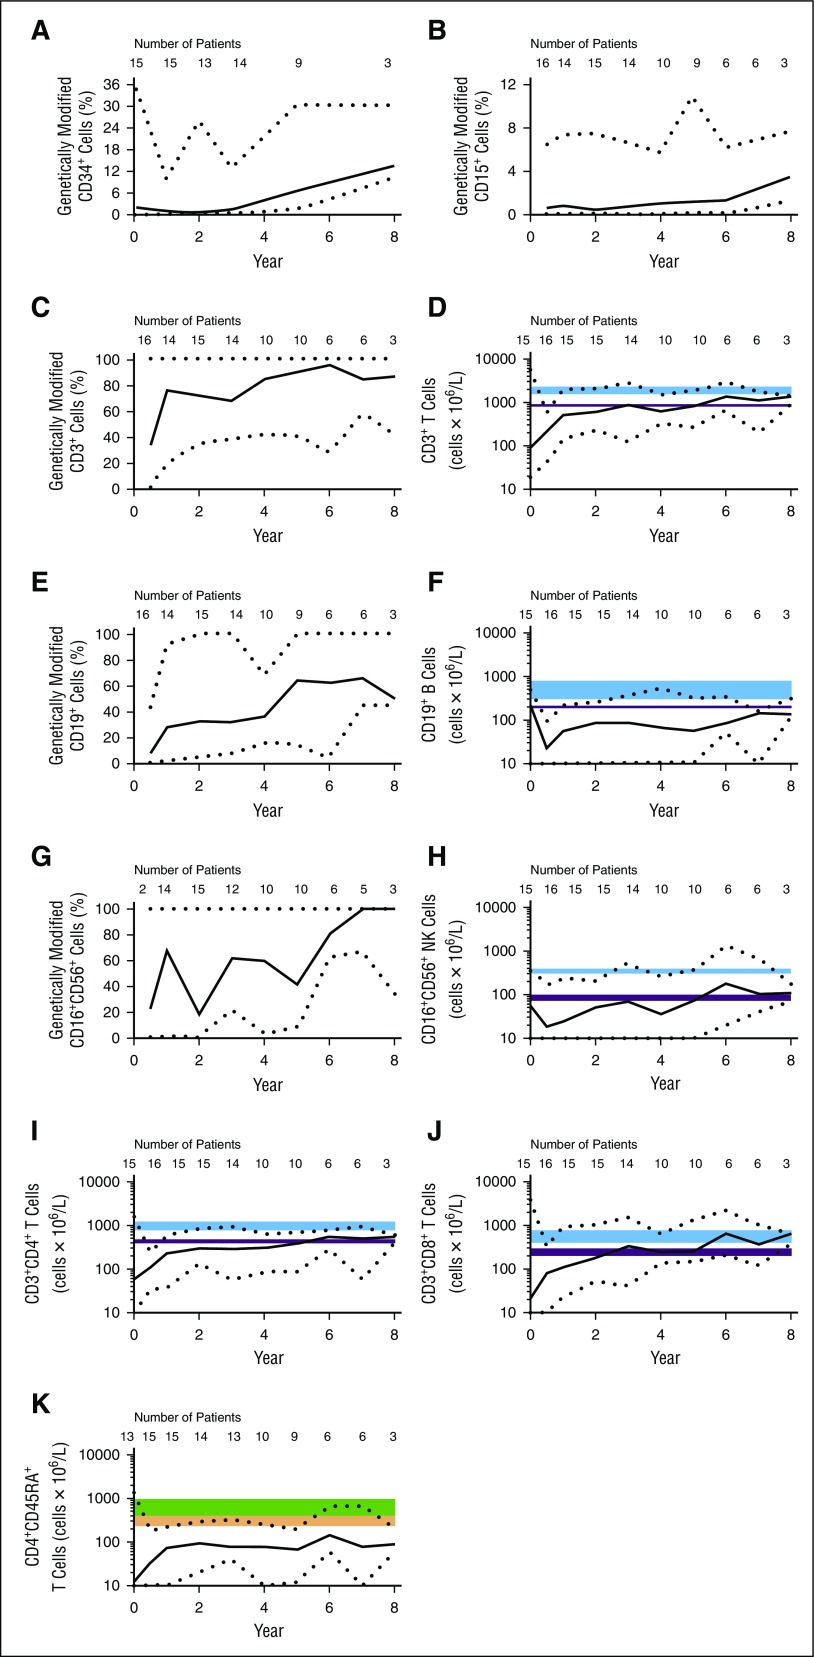
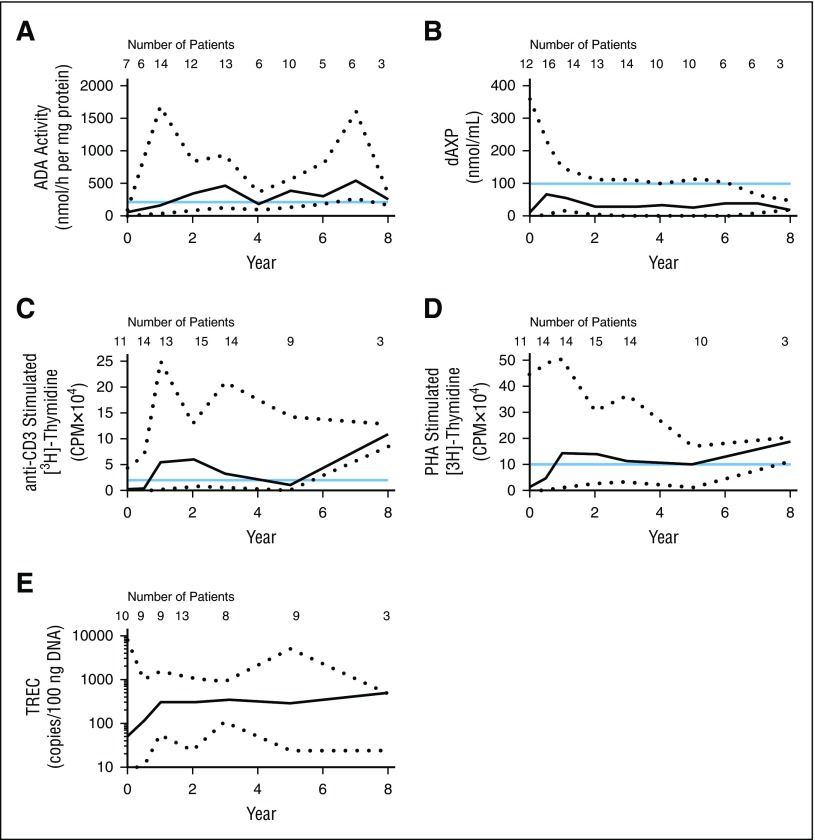
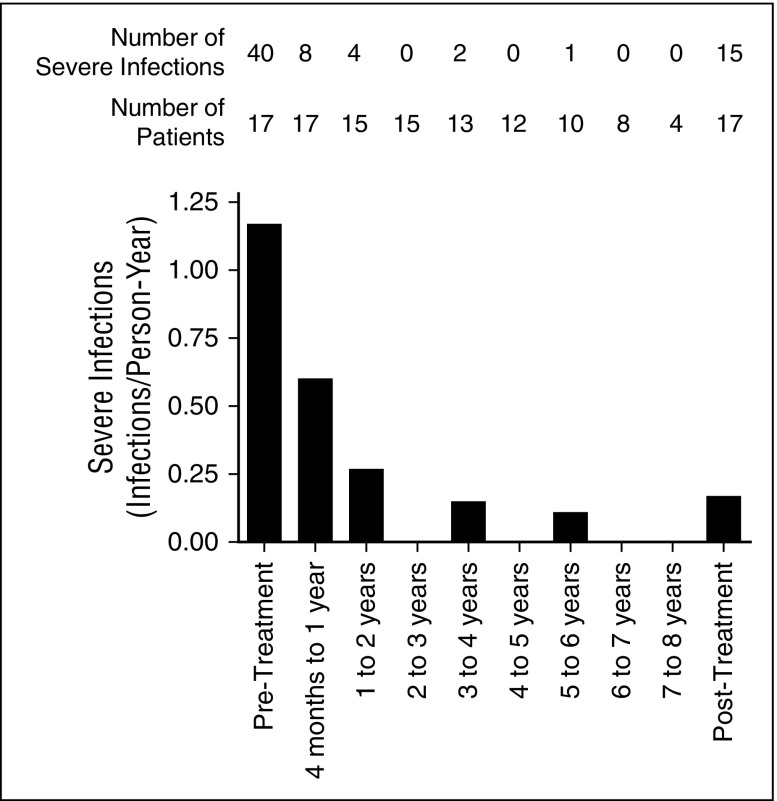
Adenosine deaminase (ADA) deficiency is a rare, autosomal-recessive systemic metabolic disease characterized by severe combined immunodeficiency (SCID). The treatment of choice for ADA-deficient SCID (ADA-SCID) is hematopoietic stem cell transplant from an HLA-matched sibling donor, although <25% of patients have such a donor available. Enzyme replacement therapy (ERT) partially and temporarily relieves immunodeficiency. We investigated the medium-term outcome of gene therapy (GT) in 18 patients with ADA-SCID for whom an HLA-identical family donor was not available; most were not responding well to ERT. Patients were treated with an autologous CD34(+)-enriched cell fraction that contained CD34(+) cells transduced with a retroviral vector encoding the human ADA complementary DNA sequence (GSK2696273) as part of single-arm, open-label studies or compassionate use programs. Overall survival was 100% over 2.3 to 13.4 years (median, 6.9 years). Gene-modified cells were stably present in multiple lineages throughout follow up. GT resulted in a sustained reduction in the severe infection rate from 1.17 events per person-year to 0.17 events per person-year (n = 17, patient 1 data not available). Immune reconstitution was demonstrated by normalization of T-cell subsets (CD3(+), CD4(+), and CD8(+)), evidence of thymopoiesis, and sustained T-cell proliferative capacity. B-cell function was evidenced by immunoglobulin production, decreased intravenous immunoglobulin use, and antibody response after vaccination. All 18 patients reported infections as adverse events; infections of respiratory and gastrointestinal tracts were reported most frequently. No events indicative of leukemic transformation were reported. Trial details were registered at www.clinicaltrials.gov as #NCT00598481.
© 2016 by The American Society of Hematology.
Figures
Comment in
-
Gene therapy for PID: the end of the beginning?Blood. 2016 Jul 7;128(1):7-8. doi: 10.1182/blood-2016-05-715037. Blood. 2016. PMID: 27389538 No abstract available.
References
-
- Hirschhorn R. Immunodeficiency disease due to deficiency of adenosine deaminase. In: Ochs HD, Smith CIE, Puck JM, editors. Primary Immunodeficiency Diseases. New York, NY: Oxford University Press; 1999.
-
- Bollinger ME, Arredondo-Vega FX, Santisteban I, Schwarz K, Hershfield MS, Lederman HM. Brief report: hepatic dysfunction as a complication of adenosine deaminase deficiency. N Engl J Med. 1996;334(21):1367–1371. - PubMed
-
- Ryser O, Morell A, Hitzig WH. Primary immunodeficiencies in Switzerland: first report of the national registry in adults and children. J Clin Immunol. 1988;8(6):479–485. - PubMed
Publication types
MeSH terms
Substances
Supplementary concepts
Associated data
LinkOut - more resources
Full Text Sources
Other Literature Sources
Medical
Research Materials
Miscellaneous
