

Salivary protein levels as a predictor of perceived astringency in model systems and solid foods
- PMID: 27129672
- PMCID: PMC4947416
- DOI: 10.1016/j.physbeh.2016.04.043
Salivary protein levels as a predictor of perceived astringency in model systems and solid foods
Abstract
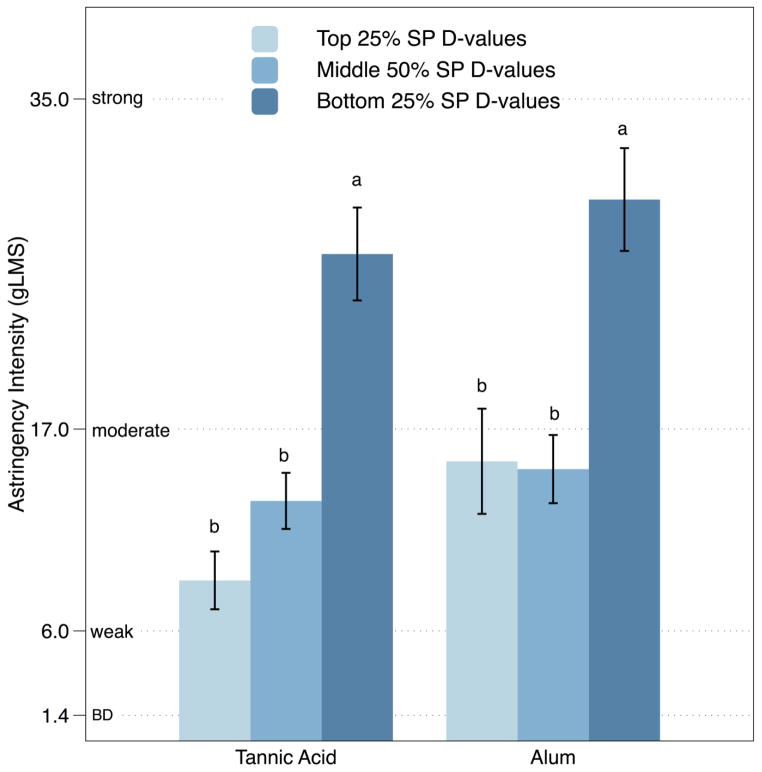
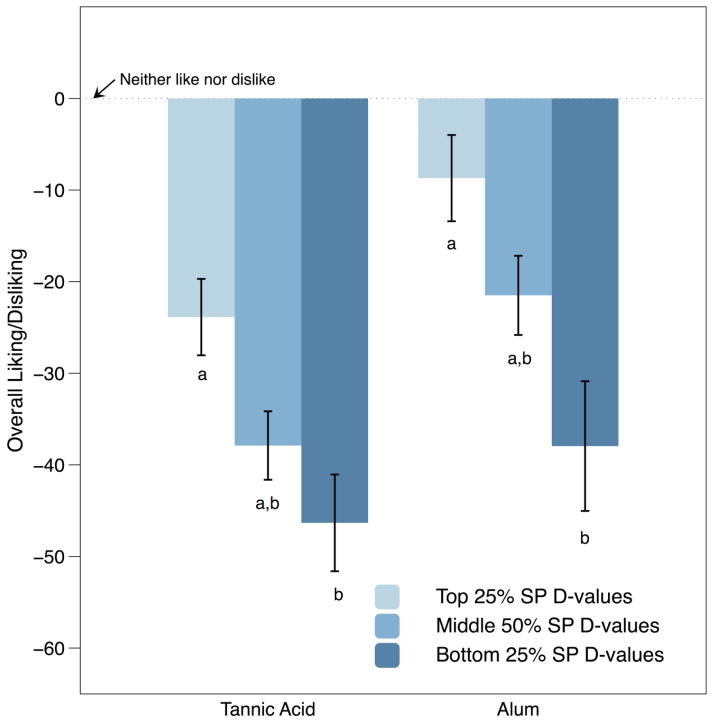
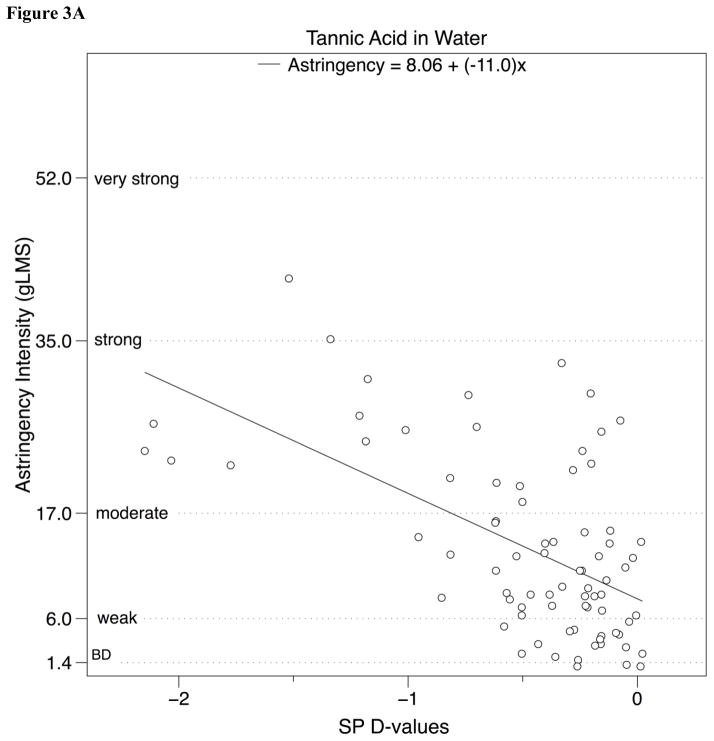
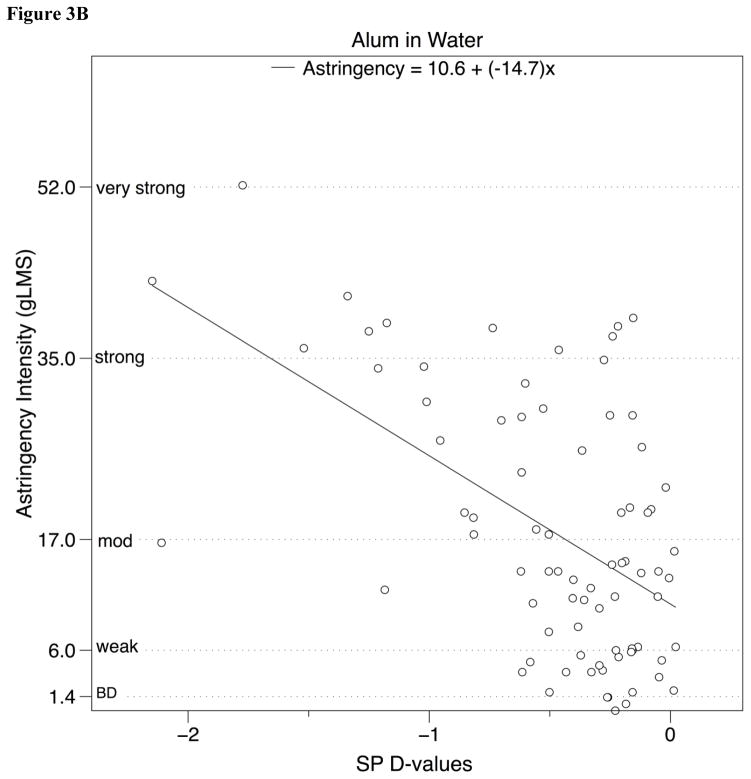
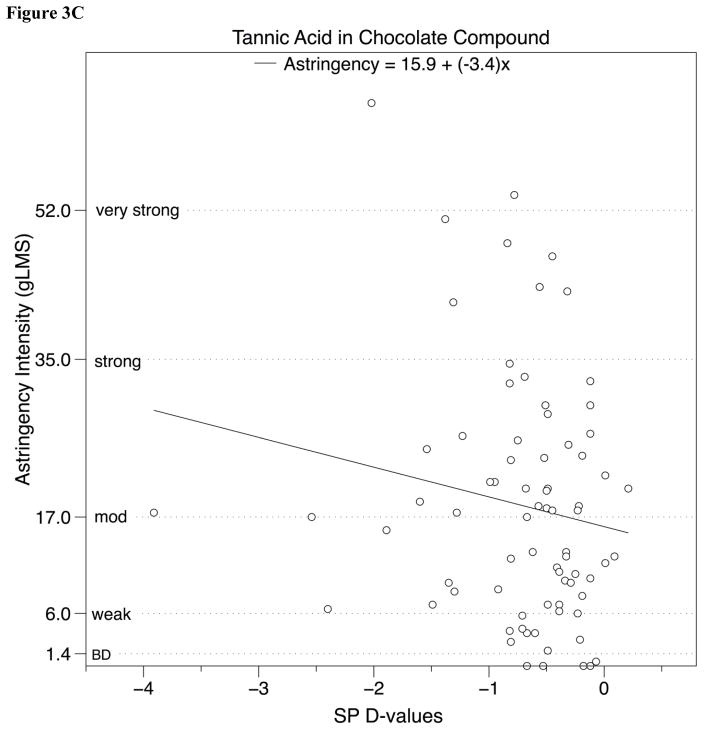
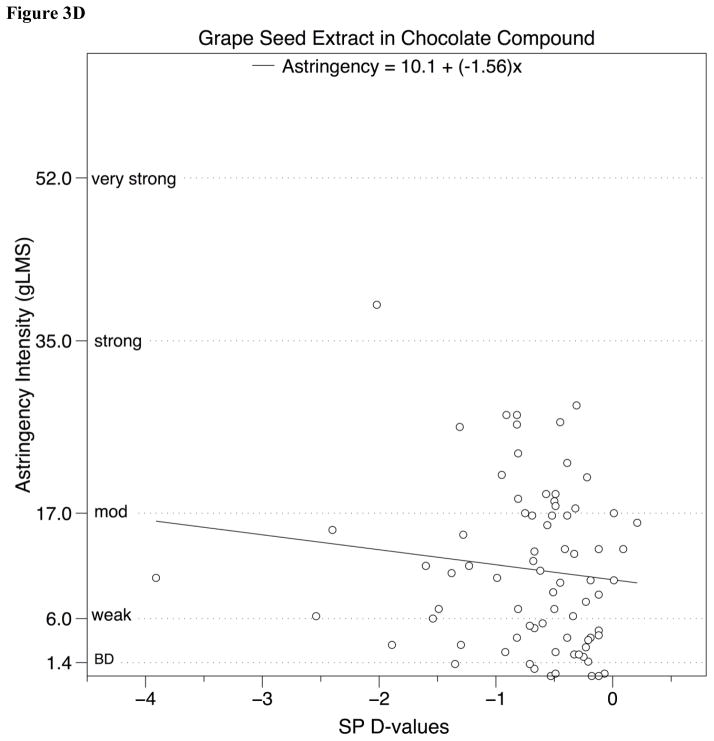
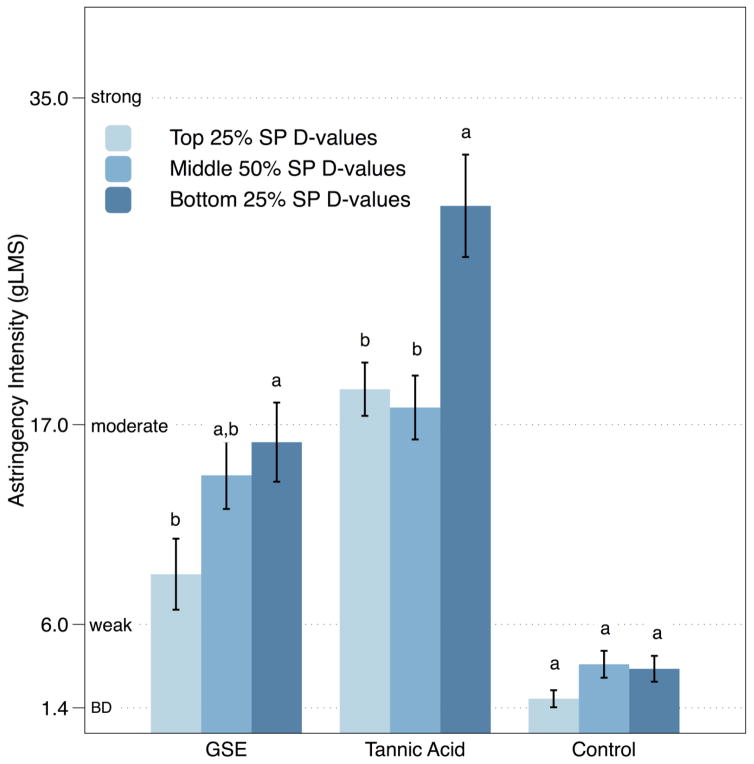
Salivary protein difference value (SP D-value) is a quantitative measure of salivary protein replenishment, which reportedly relates to individual differences in perceived astringency. This in vitro measure is calculated as the difference in total salivary protein before (S1) and after (S2) stimulation with tannic acid, with a greater absolute value (S2-S1) indicating less protein replenishment. Others report that this measure predicts perceived astringency and liking of liquid model systems and beverages containing added polyphenols. Whether this relationship generalizes to astringent compounds other than polyphenols, or to solid foods is unknown. Here, the associations between SP D-values and perceived astringency and overall liking/disliking for alum and tannic acid (experiment 1) as well as solid chocolate-flavored compound coating with added tannic acid or grape seed extract (GSE) (experiment 2) were examined. In both experiments, participants (n=84 and 81, respectively) indicated perceived intensity of astringency, bitterness, sweetness, and sourness, and degree of liking of either aqueous solutions, or solid chocolate-flavored compound coating with added astringents. Data were analyzed via linear regression, and as discrete groups for comparison to prior work. Three discrete groups were formed based on first and third quartile splits of the SP D-value distribution: low (LR), medium (MR), and high responding (HR) individuals. In experiment 1, significantly higher mean astringency ratings were observed for the HR as compared to the LR/MR groups for alum and tannic acid, confirming and extending prior work. In experiment 2, significantly higher mean astringency ratings were also observed for HR as compared to LR groups in solid chocolate-flavored compound containing added tannic acid or GSE. Significant differences in liking were found between HR and LR groups for alum and tannic acid in water, but no significant differences in liking were observed for chocolate-flavored compound samples. A significant linear relationship between SP D-values and perceived astringency was observed for both alum and tannic acid (p's<0.001), although the variance explained was relatively low (R(2)=0.33 and 0.29, respectively). In the solid chocolate-flavored compound spiked with either tannic acid or GSE, the relationship was not significant (p=0.17 and 0.30; R(2)=0.03 and 0.02, respectively). Due to the weak associations overall, and the lack of significant differences in perception of astringency between the MR and LR groups, we conclude that SP D-values are not a strong predictor of astringency, especially in solid, high-fat foods. Additional research investigating alternative methods for quantifying individual differences in astringency, as well as exploring the underlying complexities of this percept appears warranted.
Keywords: Astringency; In vitro methods; Individual differences; Salivary proteins.
Copyright © 2016 Elsevier Inc. All rights reserved.
Conflict of interest statement
This manuscript was completed in partial fulfillment of the requirements for a Master of Science at the Pennsylvania State University by EEF, who is supported by the Ralph Lee Graduate Fellowship at the Pennsylvania State University; this award is underwritten by PMCA, An International Association of Confectioners. JEH and GRZ have received speaking or consulting fees from corporate clients in the food industry. Additionally, the Sensory Evaluation Center at Penn State routinely conducts taste tests for industrial clients to facilitate experiential learning for students. None of these organizations have had any role in study conception, design or interpretation, or the decision to publish these data. JEH also receives support from a National Institutes of Health grant from the National Institute of Deafness and Communication Disorders [DC010904].
Figures
Similar articles
-
Sensory perception of and salivary protein response to astringency as a function of the 6-n-propylthioural (PROP) bitter-taste phenotype.Physiol Behav. 2017 May 1;173:163-173. doi: 10.1016/j.physbeh.2017.01.031. Epub 2017 Jan 24. Physiol Behav. 2017. PMID: 28130087
-
Temporary modification of salivary protein profile and individual responses to repeated phenolic astringent stimuli.Chem Senses. 2010 Jan;35(1):75-85. doi: 10.1093/chemse/bjp084. Epub 2009 Nov 25. Chem Senses. 2010. PMID: 19942580
-
Individual astringency responsiveness affects the acceptance of phenol-rich foods.Appetite. 2011 Jun;56(3):633-42. doi: 10.1016/j.appet.2011.02.017. Epub 2011 Feb 25. Appetite. 2011. PMID: 21354451
-
Interactions between wine phenolic compounds and human saliva in astringency perception.Food Funct. 2018 Mar 1;9(3):1294-1309. doi: 10.1039/c7fo02030a. Epub 2018 Feb 8. Food Funct. 2018. PMID: 29417111 Review.
-
Polyphenols: factors influencing their sensory properties and their effects on food and beverage preferences.Am J Clin Nutr. 2005 Jan;81(1 Suppl):330S-335S. doi: 10.1093/ajcn/81.1.330S. Am J Clin Nutr. 2005. PMID: 15640499 Review.
Cited by
-
Addition of chocolate milk to diet corresponds to protein concentration changes in human saliva.Physiol Behav. 2020 Oct 15;225:113080. doi: 10.1016/j.physbeh.2020.113080. Epub 2020 Jul 15. Physiol Behav. 2020. PMID: 32679131 Free PMC article.
-
Influence of Age and Individual Differences on Mouthfeel Perception of Whey Protein-Fortified Products: A Review.Foods. 2021 Feb 16;10(2):433. doi: 10.3390/foods10020433. Foods. 2021. PMID: 33669435 Free PMC article. Review.
-
Sensorial Perception of Astringency: Oral Mechanisms and Current Analysis Methods.Foods. 2020 Aug 14;9(8):1124. doi: 10.3390/foods9081124. Foods. 2020. PMID: 32824086 Free PMC article. Review.
-
Influence of biological, experiential and psychological factors in wine preference segmentation.Aust J Grape Wine Res. 2017 Jun;23(2):154-161. doi: 10.1111/ajgw.12266. Epub 2017 Jan 31. Aust J Grape Wine Res. 2017. PMID: 28579910 Free PMC article.
-
Discrimination of Isointense Bitter Stimuli in a Beer Model System.Nutrients. 2020 May 27;12(6):1560. doi: 10.3390/nu12061560. Nutrients. 2020. PMID: 32471227 Free PMC article.
References
-
- ASTM. Standard terminology relating to sensory evaluation of materials and products. Philadelphia, PA: American Society for Testing Materials; pp. 1–3. Annual book of ASTM Standards, 1991. 15.07-end use products (E 253-91a)
-
- Lesschaeve I, Noble AC. Polyphenols: factors influencing their sensory properties and their effects on food and beverage preferences. The American journal of clinical nutrition. 2005;81(1):330S–335S. - PubMed
-
- Bajec MR, Pickering GJ. Astringency: Mechanisms and perception. Critical Reviews in Food Science and Nutrition. 2008;48(9):858–875. - PubMed
-
- Bate-Smith E. Astringency in foods. Food. 1954;23:124–135.
-
- Bartoshuk LM. History of taste research. Hand book of perception. 1978;6:1.
Publication types
MeSH terms
Substances
Grants and funding
LinkOut - more resources
Full Text Sources
Other Literature Sources
Medical
