

Implication of the Slow-5 Oscillations in the Disruption of the Default-Mode Network in Healthy Aging and Stroke
- PMID: 27130180
- PMCID: PMC4976252
- DOI: 10.1089/brain.2015.0375
Implication of the Slow-5 Oscillations in the Disruption of the Default-Mode Network in Healthy Aging and Stroke
Abstract
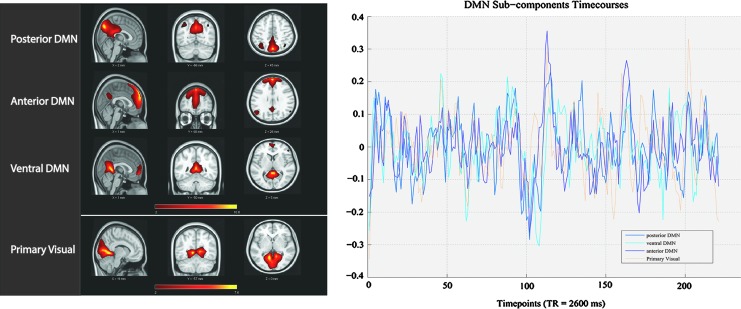
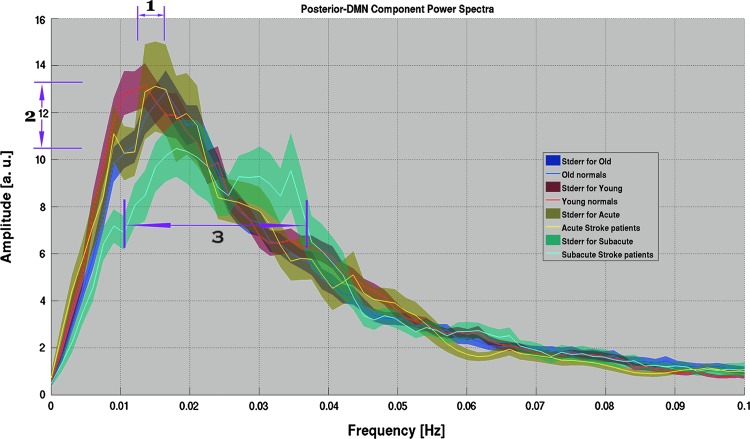
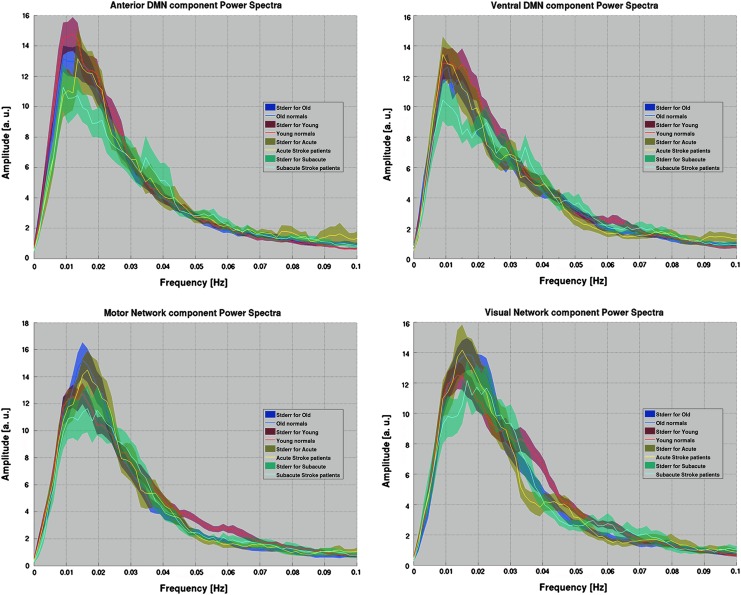
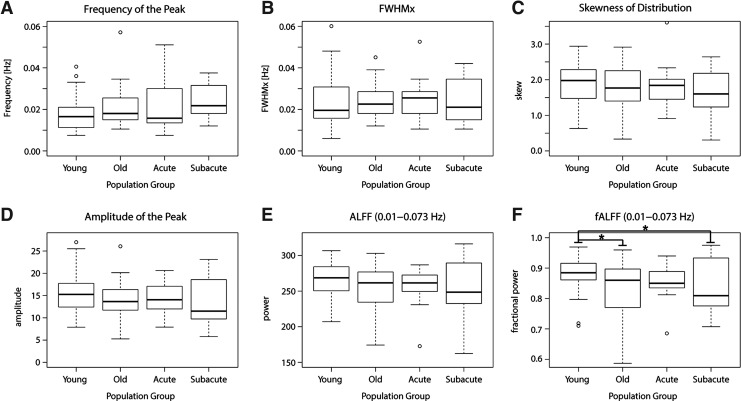
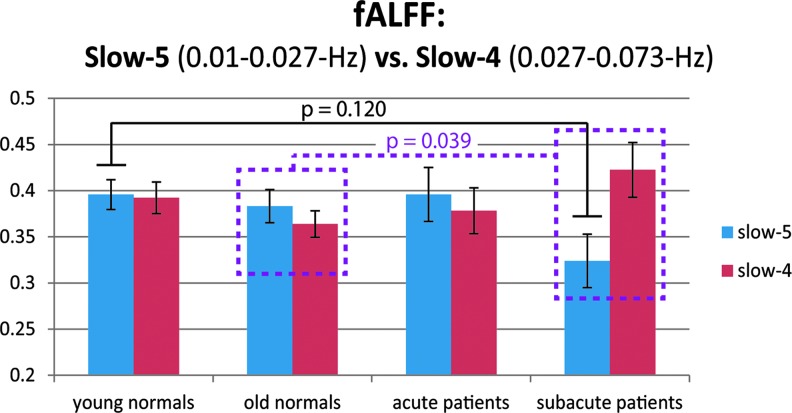
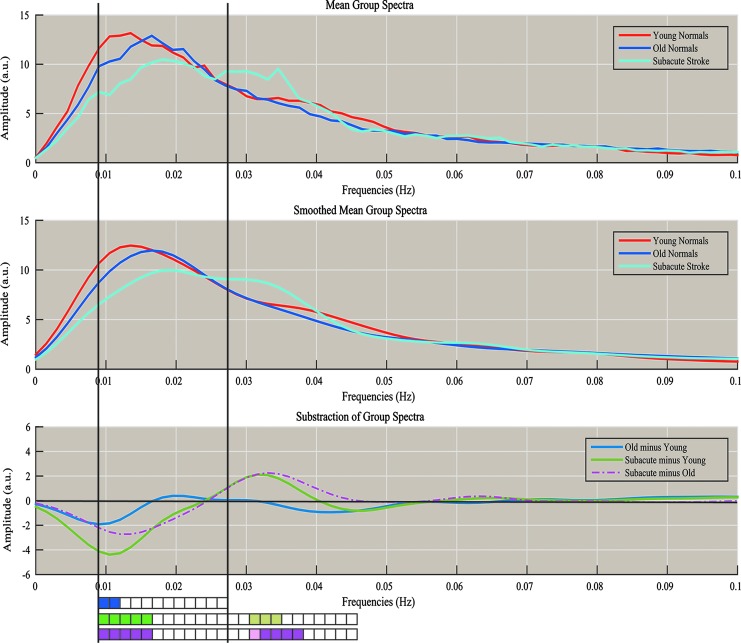
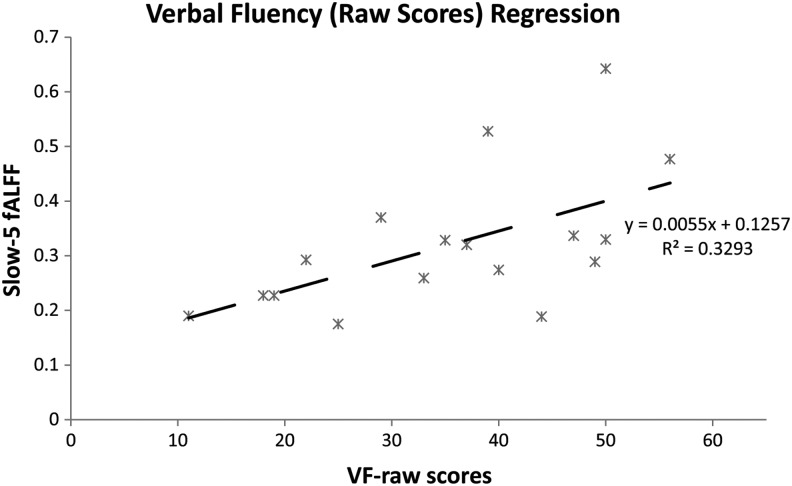
The processes of normal aging and aging-related pathologies subject the brain to an active re-organization of its brain networks. Among these, the default-mode network (DMN) is consistently implicated with a demonstrated reduction in functional connectivity within the network. However, no clear stipulation on the underlying mechanisms of the de-synchronization has yet been provided. In this study, we examined the spectral distribution of the intrinsic low-frequency oscillations (LFOs) of the DMN sub-networks in populations of young normals, older subjects, and acute and subacute ischemic stroke patients. The DMN sub-networks were derived using a mid-order group independent component analysis with 117 eyes-closed resting-state functional magnetic resonance imaging (rs-fMRI) sessions from volunteers in those population groups, isolating three robust components of the DMN among other resting-state networks. The posterior component of the DMN presented noticeable differences. Measures of amplitude of low-frequency fluctuation (ALFF) and fractional ALFF (fALFF) of the network component demonstrated a decrease in resting-state cortical oscillation power in the elderly (normal and patient), specifically in the slow-5 (0.01-0.027 Hz) range of oscillations. Furthermore, the contribution of the slow-5 oscillations during the resting state was diminished for a greater influence of the slow-4 (0.027-0.073 Hz) oscillations in the subacute stroke group, not only suggesting a vulnerability of the slow-5 oscillations to disruption but also indicating a change in the distribution of the oscillations within the resting-state frequencies. The reduction of network slow-5 fALFF in the posterior DMN component was found to present a potential association with behavioral measures, suggesting a brain-behavior relationship to those oscillations, with this change in behavior potentially resulting from an altered network integrity induced by a weakening of the slow-5 oscillations during the resting state. The repeated identification of those frequencies in the disruption of DMN stresses a critical role of the slow-5 oscillations in network disruption, and it accentuates the importance of managing those oscillations in the health of the DMN.
Keywords: aging; default-mode network; fALFF; posterior DMN; rs-fMRI; slow-5; stroke.
Figures
Similar articles
-
Recovery of slow-5 oscillations in a longitudinal study of ischemic stroke patients.Neuroimage Clin. 2016 Mar 17;11:398-407. doi: 10.1016/j.nicl.2016.03.008. eCollection 2016. Neuroimage Clin. 2016. PMID: 27077023 Free PMC article.
-
Differing Patterns of Altered Slow-5 Oscillations in Healthy Aging and Ischemic Stroke.Front Hum Neurosci. 2016 Apr 13;10:156. doi: 10.3389/fnhum.2016.00156. eCollection 2016. Front Hum Neurosci. 2016. PMID: 27148013 Free PMC article.
-
Clinical, cognitive, and functional connectivity correlations of resting-state intrinsic brain activity alterations in unmedicated depression.J Affect Disord. 2015 Feb 1;172:241-50. doi: 10.1016/j.jad.2014.10.017. Epub 2014 Oct 19. J Affect Disord. 2015. PMID: 25451423 Free PMC article.
-
Neuroaging through the Lens of the Resting State Networks.Biomed Res Int. 2018 Jan 15;2018:5080981. doi: 10.1155/2018/5080981. eCollection 2018. Biomed Res Int. 2018. PMID: 29568755 Free PMC article. Review.
-
Perturbation of Brain Oscillations after Ischemic Stroke: A Potential Biomarker for Post-Stroke Function and Therapy.Int J Mol Sci. 2015 Oct 26;16(10):25605-40. doi: 10.3390/ijms161025605. Int J Mol Sci. 2015. PMID: 26516838 Free PMC article. Review.
Cited by
-
Identification of Subclinical Language Deficit Using Machine Learning Classification Based on Poststroke Functional Connectivity Derived from Low Frequency Oscillations.Brain Connect. 2019 Mar;9(2):194-208. doi: 10.1089/brain.2018.0597. Epub 2019 Feb 7. Brain Connect. 2019. PMID: 30398379 Free PMC article.
-
Distinct BOLD variability changes in the default mode and salience networks in Alzheimer's disease spectrum and associations with cognitive decline.Sci Rep. 2020 Apr 15;10(1):6457. doi: 10.1038/s41598-020-63540-4. Sci Rep. 2020. PMID: 32296093 Free PMC article.
-
Recovery of slow-5 oscillations in a longitudinal study of ischemic stroke patients.Neuroimage Clin. 2016 Mar 17;11:398-407. doi: 10.1016/j.nicl.2016.03.008. eCollection 2016. Neuroimage Clin. 2016. PMID: 27077023 Free PMC article.
-
Altered static and dynamic indices of intrinsic brain activity in patients with subcortical ischemic vascular disease: a resting-state functional magnetic resonance imaging analysis.Neuroradiology. 2023 May;65(5):923-931. doi: 10.1007/s00234-023-03135-8. Epub 2023 Mar 9. Neuroradiology. 2023. PMID: 36892613
-
Preclinical Magnetic Resonance Imaging and Spectroscopy Studies of Memory, Aging, and Cognitive Decline.Front Aging Neurosci. 2016 Jun 29;8:158. doi: 10.3389/fnagi.2016.00158. eCollection 2016. Front Aging Neurosci. 2016. PMID: 27468264 Free PMC article. Review.
References
-
- Bai F, Zhang Z, Yu H, Shi Y, Yuan Y, Zhu W, et al. . 2008. Default-mode network activity distinguishes amnestic type mild cognitive impairment from healthy aging: a combined structural and resting-state functional MRI study. Neurosci Lett 438:111–115 - PubMed
Publication types
MeSH terms
Grants and funding
LinkOut - more resources
Full Text Sources
Other Literature Sources
Medical
