Review
. 2016 Apr 30;13(1):42.
doi: 10.1186/s12984-016-0148-3.

Computational neurorehabilitation: modeling plasticity and learning to predict recovery

Affiliations
Review

Computational neurorehabilitation: modeling plasticity and learning to predict recovery

David J Reinkensmeyer et al. J Neuroeng Rehabil. .

Abstract

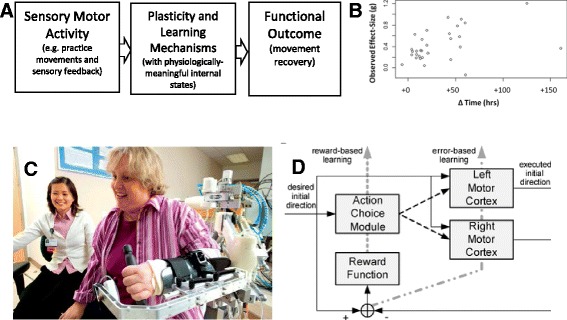
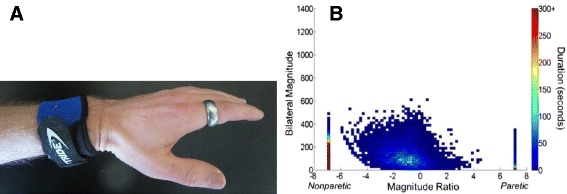
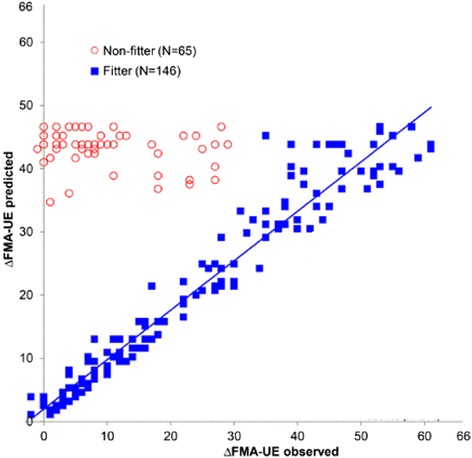
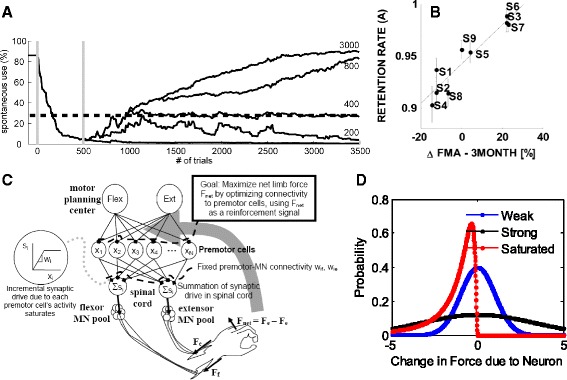
Despite progress in using computational approaches to inform medicine and neuroscience in the last 30 years, there have been few attempts to model the mechanisms underlying sensorimotor rehabilitation. We argue that a fundamental understanding of neurologic recovery, and as a result accurate predictions at the individual level, will be facilitated by developing computational models of the salient neural processes, including plasticity and learning systems of the brain, and integrating them into a context specific to rehabilitation. Here, we therefore discuss Computational Neurorehabilitation, a newly emerging field aimed at modeling plasticity and motor learning to understand and improve movement recovery of individuals with neurologic impairment. We first explain how the emergence of robotics and wearable sensors for rehabilitation is providing data that make development and testing of such models increasingly feasible. We then review key aspects of plasticity and motor learning that such models will incorporate. We proceed by discussing how computational neurorehabilitation models relate to the current benchmark in rehabilitation modeling - regression-based, prognostic modeling. We then critically discuss the first computational neurorehabilitation models, which have primarily focused on modeling rehabilitation of the upper extremity after stroke, and show how even simple models have produced novel ideas for future investigation. Finally, we conclude with key directions for future research, anticipating that soon we will see the emergence of mechanistic models of motor recovery that are informed by clinical imaging results and driven by the actual movement content of rehabilitation therapy as well as wearable sensor-based records of daily activity.

Keywords: Computational modeling; Motor control; Motor learning; Neurorehabilitation; Plasticity; Stroke recovery.


Figures

Fig. 1
Fig. 1
a General framework of computational neurorehabilitation models. Such models predict patient functional outcomes by driving computational representations of plasticity and learning with sensorimotor activity achieved in rehabilitation therapy and/or throughout the course of daily life. b Computational neurorehabilitation models presume that rehabilitation modulates both spontaneous biological recovery and motor learning, leading to improvements in both impaired limb motor control and compensatory movement strategies. Shown here is an estimate of the dose-response effect arising from additional therapy time, obtained by plotting effect sizes of 30 studies of upper and lower extremity rehabilitation therapy after stroke involving 1750 total participants as a function of the number of additional training hours ΔΤime. Note in this study there was no significant effect of the time the therapy was delivered after stroke (i.e. soon after stroke or in the chronic state). From [9]. Used with permission. c Computational neurorehabilitation models are becoming increasingly feasible in part because of a large influx of detailed kinematic data characterizing the content and outcomes of therapy, which is being obtained from robotic devices, such as Pneu-WREX shown here [218] and wearable sensors. Both individuals consented to the publication of this image. d Example of a computational neurorehabilitation model [112]. This model simplified neurorehabilitation dynamics by assuming that a reward-based learning mechanism determines the probabilities of using the impaired or unimpaired arms after stroke, and that a separate, error-based learning mechanism accounts for improvements in motor control through practice. The model predicts that if a patient reaches a threshold of recovery, then he or she will enter a positive cycle of using and further retraining their impaired arm through spontaneous activity in daily life, a prediction supported by data from the EXCITE clinical trial. Used with permission
Fig. 2
Fig. 2
Example of wearable sensing for quantifying the daily sensorimotor activity that stimulates plasticity. a The Manumeter is an example of a device that monitors arm, wrist, and finger movements during daily activities [77]. The wristband is equipped with a tri-axial accelerometer to quantify movement of the arm, and thus could be used to produce data such as that shown in b. The wristband also contains a pair of magnetometers that quantify movement of the wrist and fingers by sensing the magnetic field changes due to a magnetic ring worn on the finger. From: [219]; Used with permission. b Bilateral upper limb daily activity from one individual with a stroke (ARAT score = 10) who wore a commercial accelerometer on each wrist for a 24 h period. The y-axis shows the magnitude of bilateral activity obtained by summing at each time point the vector magnitude of the acceleration of each upper limb, when each was moving over a threshold value. The x-axis shows the ratio of these two values, quantifying the contribution of each limb to the activity. Each point represents data from a one second time period throughout the day. For individuals without a stroke, these plots are symmetrical, like evergreen trees, indicating the bimanual nature of most functional activity. From [74]; Used with permission
Fig. 3
Fig. 3
Example of the predictive power of a prognostic regression model, the proportional recovery model [171] (see Eq. 2). The model accurately predicts the change in upper extremity Fugl-Meyer score from 2 days to 3 months post stroke for 70–80 % of the patients, who all received rehabilitation. The subgroup of patients who did not fit the model experienced less recovery than predicted. To our knowledge, there are no computational rehabilitation models that can predict which patients will fit this prognostic regression model, or explain the variance in those who do not. Modified from [173]; Used with permission
Fig. 4
Fig. 4
Examples of computational neurorehabilitation approaches and results. a A key output of the Han et al. model [112] is the predicted spontaneous use of the impaired hand, shown here as a percent of all movement trials in a bimanual choice task. Each curve represents the evolution of spontaneous use given the number of rehabilitation practice trials, shown as a number on the far right of each curve. Spontaneous use increases only when enough rehabilitation practice trials are performed to reach a threshold. From [112]; used with permission. b A key output of the Casadio et al. model [56], which used data from a robotic therapy trial, is that the retention parameter in the model, measured through a trial-to-trial analysis, predicts the change in Fugl-Meyer score at 3 months for these chronic stroke participants. c The Reinkensmeyer et al. model [136] assumes that wrist force is produced by the summed effect of corticospinal cells targeting motor neuronal pools. Each cell contributes an incremental force proportional to its firing rate, up to a saturation level. Cell firing rate changes by a random amount from trial to trial; activation patterns that produce more force are remembered for future use, thus implementing a reinforcement learning paradigm. d In the Reinkensmeyer et al. model, the probability that a single neuron will contribute to an increase in force on a new trial depends on whether the neuron is strongly or weakly connected to the motor neuronal pool. Strongly connected cells have a greater probability of producing a larger increase. In addition, when cells become saturated, they can only decrease force production. Thus, an increasing number of saturated cells increasingly blocks further optimization, leaving a residual capacity for further increases in force

Similar articles

Cited by

References

    1. Feigin VL, Forouzanfar MH, Krishnamurthi R, Mensah GA, Connor M, Bennett DA, Moran AE, Sacco RL, Anderson L, Truelsen T, O’Donnell M, Venketasubramanian N, Barker-Collo S, Lawes CMM, Wang W, Shinohara Y, Witt E, Ezzati M, Naghavi M, Murray C. Global and regional burden of stroke during 1990–2010: findings from the Global Burden of Disease Study 2010. Lancet. 2014;383(9913):245–55. doi: 10.1016/S0140-6736(13)61953-4. - DOI - PMC - PubMed
    1. Miller EL, Murray L, Richards L, Zorowitz RD, Bakas T, Clark P, Billinger SA. Comprehensive overview of nursing and interdisciplinary rehabilitation care of the stroke patient: a scientific statement from the American Heart Association. Stroke. 2010;41(10):2402–48. doi: 10.1161/STR.0b013e3181e7512b. - DOI - PubMed
    1. Langhorne P, Bernhardt J, Kwakkel G. Stroke rehabilitation. Lancet. 2011;377(9778):1693–702. doi: 10.1016/S0140-6736(11)60325-5. - DOI - PubMed
    1. Levin MF, Kleim JA, Wolf SL. What do motor ‘recovery’ and ‘compensation’ mean in patients following stroke? Neurorehabil Neural Repair. 2009;23(4):313–9. doi: 10.1177/1545968308328727. - DOI - PubMed
    1. Langhorne P, Coupar F, Pollock A. Motor recovery after stroke: a systematic review. Lancet Neurol. 2009;8(8):741–54. doi: 10.1016/S1474-4422(09)70150-4. - DOI - PubMed