. 2016 Jun 2;44(10):4539-50.
doi: 10.1093/nar/gkw319. Epub 2016 Apr 29.

Identification and analysis of integrons and cassette arrays in bacterial genomes

Affiliations

Identification and analysis of integrons and cassette arrays in bacterial genomes

Jean Cury et al. Nucleic Acids Res. .

Abstract

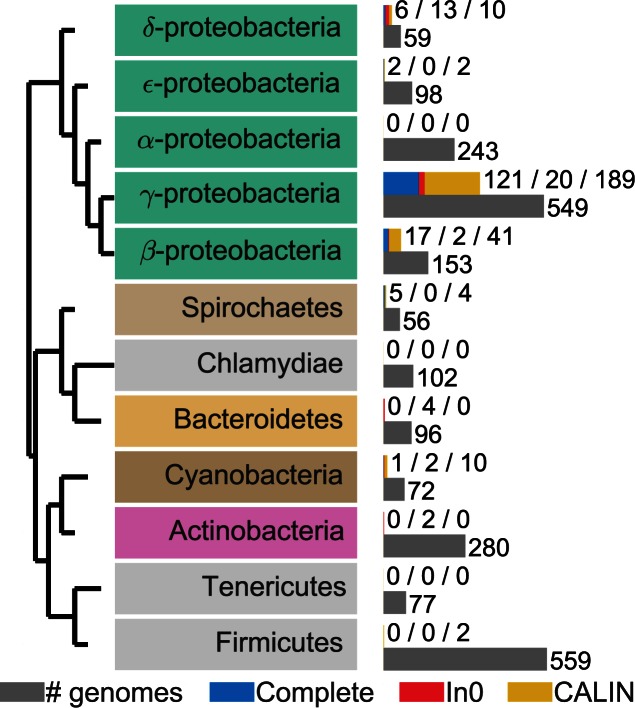
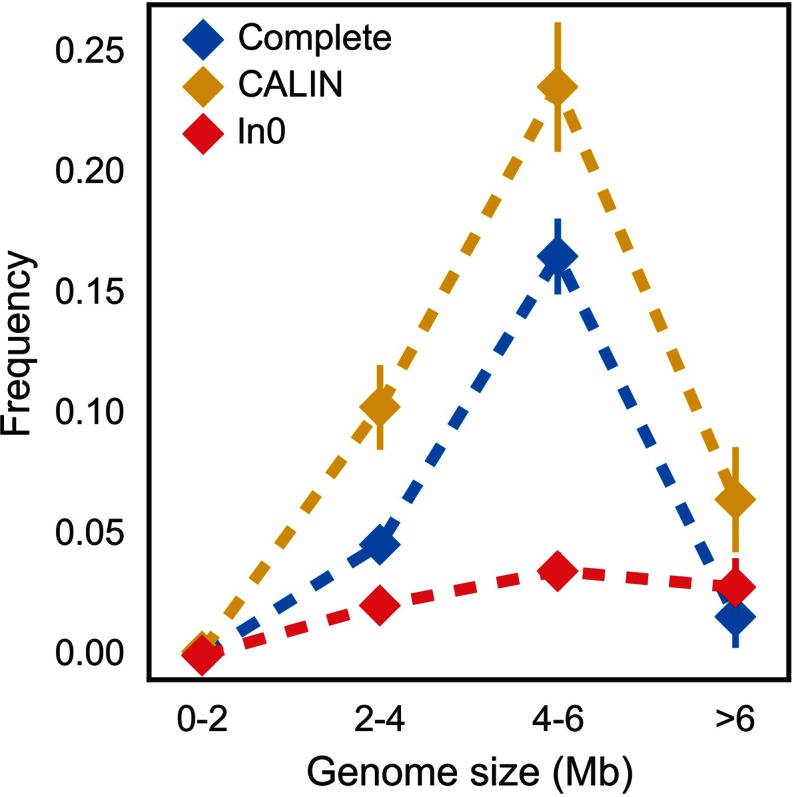
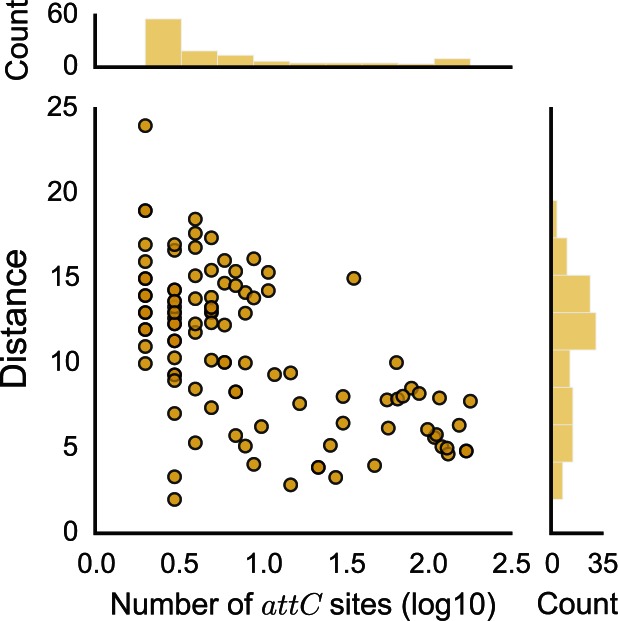
Integrons recombine gene arrays and favor the spread of antibiotic resistance. Their broader roles in bacterial adaptation remain mysterious, partly due to lack of computational tools. We made a program - IntegronFinder - to identify integrons with high accuracy and sensitivity. IntegronFinder is available as a standalone program and as a web application. It searches for attC sites using covariance models, for integron-integrases using HMM profiles, and for other features (promoters, attI site) using pattern matching. We searched for integrons, integron-integrases lacking attC sites, and clusters of attC sites lacking a neighboring integron-integrase in bacterial genomes. All these elements are especially frequent in genomes of intermediate size. They are missing in some key phyla, such as α-Proteobacteria, which might reflect selection against cell lineages that acquire integrons. The similarity between attC sites is proportional to the number of cassettes in the integron, and is particularly low in clusters of attC sites lacking integron-integrases. The latter are unexpectedly abundant in genomes lacking integron-integrases or their remains, and have a large novel pool of cassettes lacking homologs in the databases. They might represent an evolutionary step between the acquisition of genes within integrons and their stabilization in the new genome.


Figures

Figure 1.
Figure 1.
Schema of an integron and the three types of elements detected by IntegronFinder. (A) The integron is composed of a specific integron integrase gene (intI, orange), an attI recombination site (red), and an array of gene cassettes (blue, yellow and green). A cassette is typically composed of an ORF flanked by two attC recombination sites. The integron integrase has its own promoter (PintI). There is one constitutive promoter (Pc) for the cluster of cassettes. Cassettes rarely contain promoters. The integrase can excise a cassette formula image 
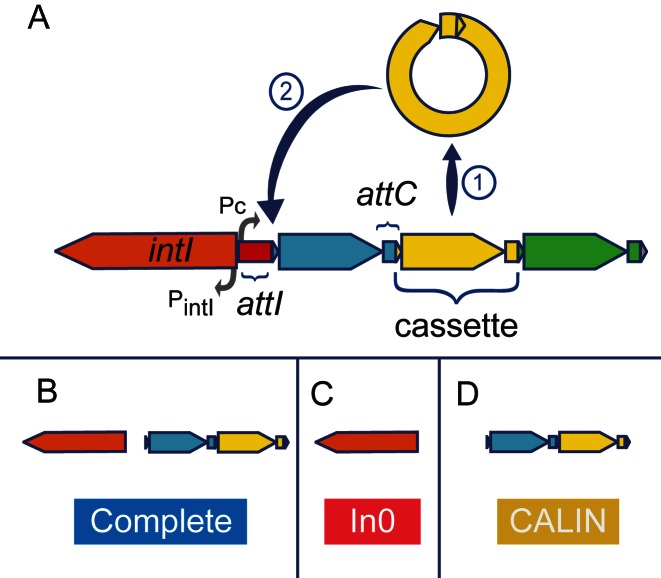
and/or integrate it at the attI site formula image. (B) Complete integrons include an integrase and at least one attC site. (C) The In0 elements are composed of an integron integrase and no attC sites. (D) The clusters of attC sites lacking integron-integrases (CALIN) are composed of at least two attC sites.
Figure 2.
Figure 2.
Characteristics of the attC sites. (A) Scheme of the secondary structure of a folded attC site. EHB stands for Extra Helical Bases. (B) Analysis of the attC sites used to build the model, including the WebLogo (73) of the R and L box and unpaired central spacers (UCS) and the histogram (and kernel density estimation) of the size of the variable terminal structure (VTS). The Weblogo represents the information contained in a column of a multiple sequence alignment (using the log2 transformation). The taller the letter is, the more conserved is the character at that position. The width of each column of symbols takes into account the presence of gaps. Thin columns are mostly composed of gaps. (C) Same as (B) but with the set of attC sites identified in complete integrons found in complete bacterial genomes. (D) Secondary structure used in the model in WUSS format, colors match those of (A).
Figure 3.
Figure 3.
Diagram describing the different steps used by IntegronFinder to identify and annotate integrons. Solid lines represent the default mode, dotted lines optional modes. Blue boxes indicate the main dependency used for a given step. Green boxes indicate the format of the file needed for a given step.
Figure 4.
Figure 4.
Quality assessment of the attC sites covariance model on pseudo-genomes with varying G+C content and depending on the run mode (default and ‘- - local_max’). (Top) Table resuming the results. The mean time is the average running time per pseudo-genome on a Mac Pro, 2 × 2.4 GHz 6-Core Intel Xeon, 16 Gb RAM, with options - - cpu 20 and - - no-proteins. (Middle) Rate of false positives per mega-base (Mb) as function of the G+C content. (Bottom) Sensitivity (or true positive rate) as function of the G+C content. The red line depicts results obtained with the default parameters, and the blue line represents results obtained with the accurate parameters (‘- - local_max’ option). Vertical lines represent standard error of the mean. There is no correlation with G+C content (all spearman ρ ∈ [−0.12; −0.04] and all P-values > 0.06).
Figure 5.
Figure 5.
Taxonomic distribution of integrons in clades with more than 50 complete genomes sequenced. The gray bar represents the number of genomes sequenced for a given clade. The blue bar represents the number of complete integrons, the red bar the number of In0 and the yellow bar the number of CALIN. The colored text boxes refer to the colors in Supplementary Figure S2.
Figure 6.
Figure 6.
Frequency of integrons and related elements as a function of the genome size. Vertical bar represents standard error of the mean. The sample size in each bin is: 608 [0-2], 912 [2-4], 712 [4-6] and 247 [>6].
Figure 7.
Figure 7.
Relationship between the number of attC sites in an integron and the mean sequence distance between attC sites within an integron. The x-axis is in log10 scale. The association is significant: spearman ρ = -0.53, P < 0.001.

References

    1. Mazel D. Integrons: agents of bacterial evolution. Nat. Rev. Microbiol. 2006;4:608–620. - PubMed
    1. Partridge S.R. Analysis of antibiotic resistance regions in Gram-negative bacteria. FEMS Microbiol. Rev. 2011;35:820–855. - PubMed
    1. Gillings M.R. Integrons: past, present, and future. Microbiol. Mol. Biol. Rev. 2014;78:257–277. - PMC - PubMed
    1. Escudero J.A., Loot C., Nivina A., Mazel D. The Integron: adaptation on demand. Microbiol. Spectr. 2015;3 MDNA3-0019-2014. - PubMed
    1. Collis C.M., Hall R.M. Expression of antibiotic resistance genes in the integrated cassettes of integrons. Antimicrob. Agents Chemother. 1995;39:155–162. - PMC - PubMed

Publication types

Substances