

Characterization and influence of cardiac background sodium current in the atrioventricular node
- PMID: 27132017
- PMCID: PMC5007024
- DOI: 10.1016/j.yjmcc.2016.04.014
Characterization and influence of cardiac background sodium current in the atrioventricular node
Abstract
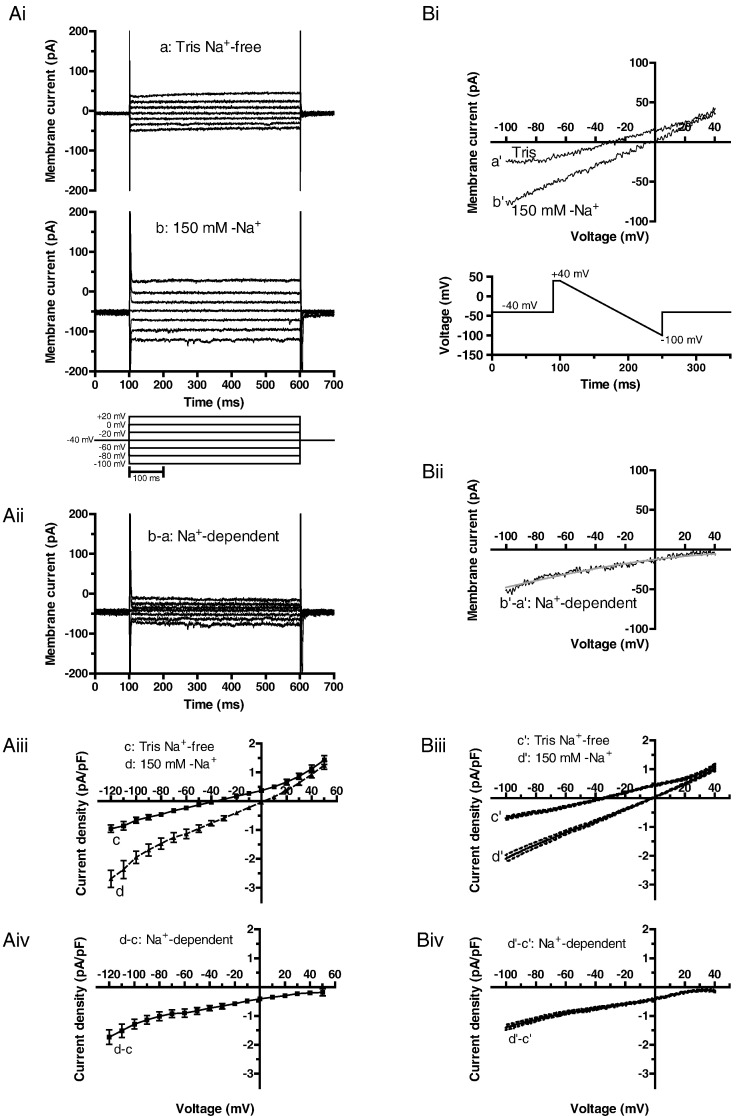
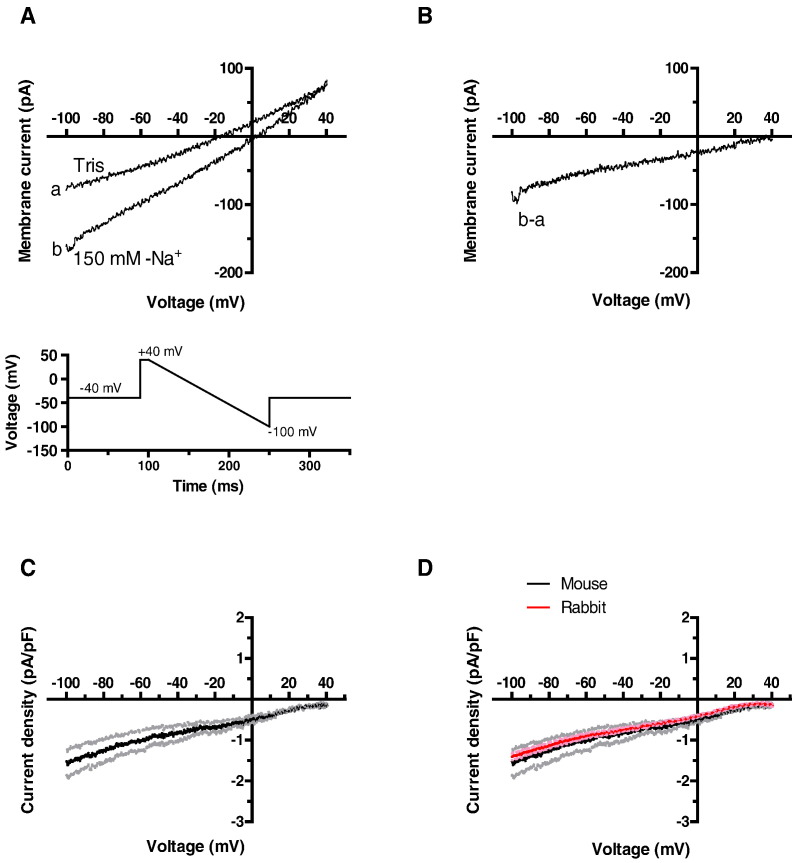
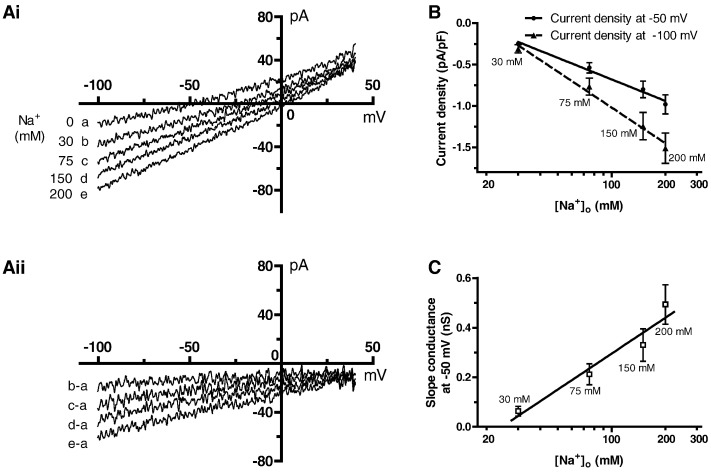
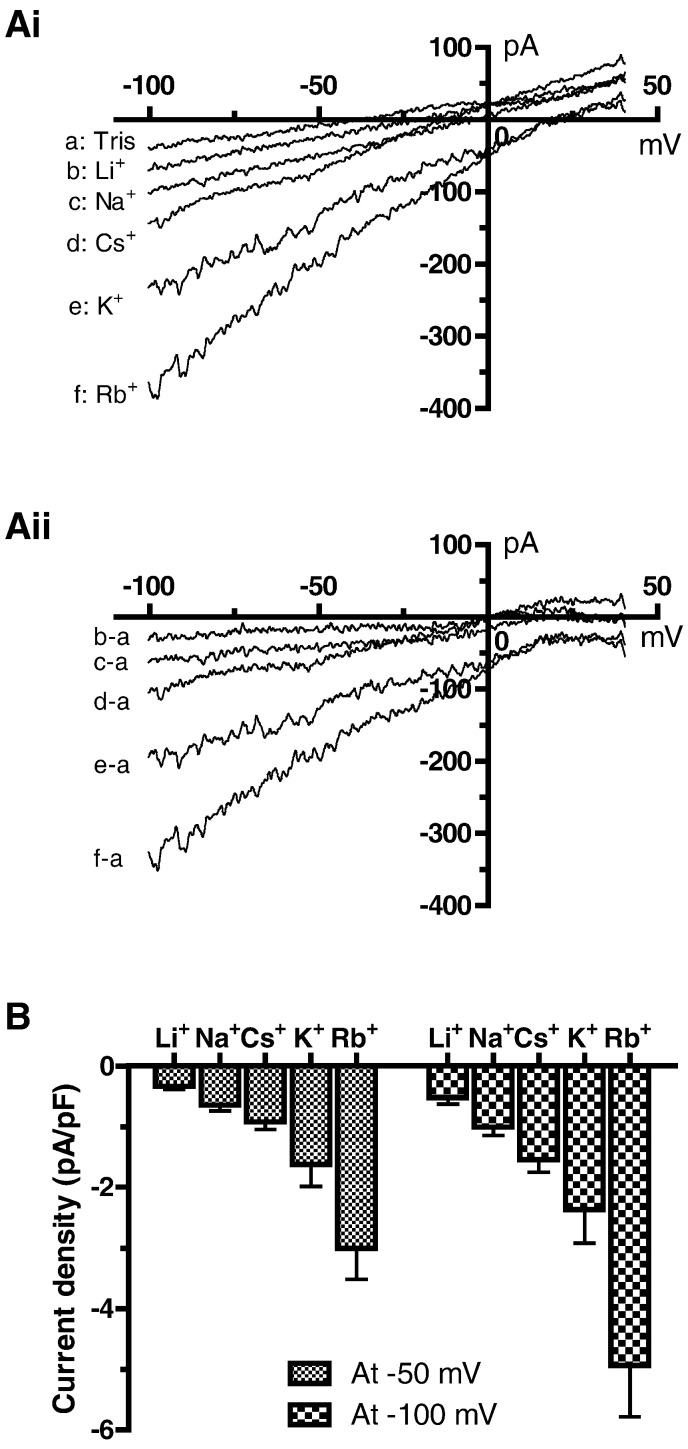
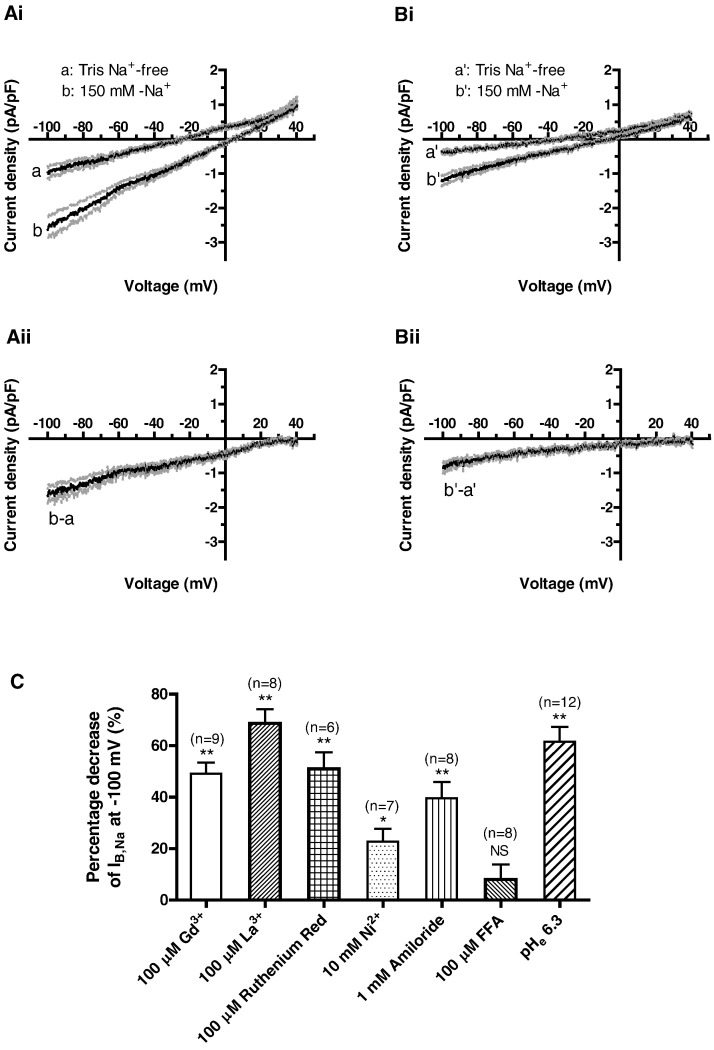
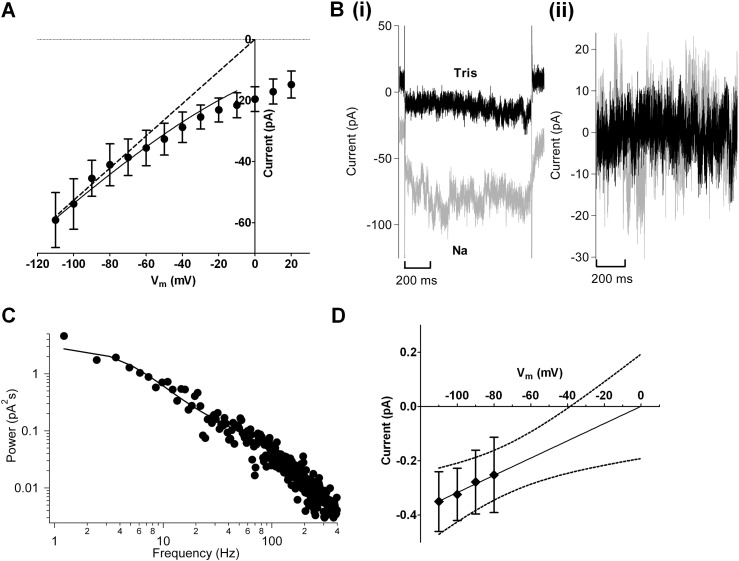
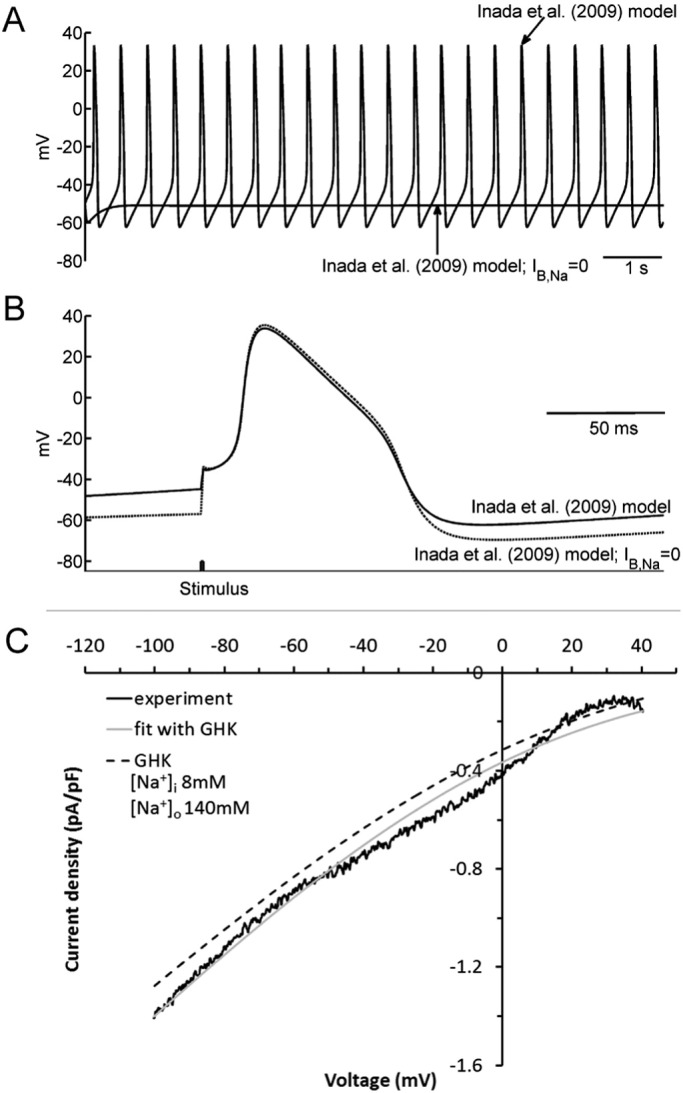
Background inward sodium current (IB,Na) that influences cardiac pacemaking has been comparatively under-investigated. The aim of this study was to determine for the first time the properties and role of IB,Na in cells from the heart's secondary pacemaker, the atrioventricular node (AVN). Myocytes were isolated from the AVN of adult male rabbits and mice using mechanical and enzymatic dispersion. Background current was measured using whole-cell patch clamp and monovalent ion substitution with major voltage- and time-dependent conductances inhibited. In the absence of a selective pharmacological inhibitor of IB,Na, computer modelling was used to assess the physiological contribution of IB,Na. Net background current during voltage ramps was linear, reversing close to 0mV. Switching between Tris- and Na(+)-containing extracellular solution in rabbit and mouse AVN cells revealed an inward IB,Na, with an increase in slope conductance in rabbit cells at -50mV from 0.54±0.03 to 0.91±0.05nS (mean±SEM; n=61 cells). IB,Na magnitude varied in proportion to [Na(+)]o. Other monovalent cations could substitute for Na(+) (Rb(+)>K(+)>Cs(+)>Na(+)>Li(+)). The single-channel conductance with Na(+) as charge carrier estimated from noise-analysis was 3.2±1.2pS (n=6). Ni(2+) (10mM), Gd(3+) (100μM), ruthenium red (100μM), or amiloride (1mM) produced modest reductions in IB,Na. Flufenamic acid was without significant effect, whilst La(3+) (100μM) or extracellular acidosis (pH6.3) inhibited the current by >60%. Under the conditions of our AVN cell simulations, removal of IB,Na arrested spontaneous activity and, in a simulated 1D-strand, reduced conduction velocity by ~20%. IB,Na is carried by distinct low conductance monovalent non-selective cation channels and can influence AVN spontaneous activity and conduction.
Keywords: AVN; Atrioventricular node; Background current; I(B,Na); Pacemaking.
Copyright © 2016 The Authors. Published by Elsevier Ltd.. All rights reserved.
Figures
Comment in
-
Cardiac background sodium current: Elusive but important.Channels (Austin). 2017 Jan 2;11(1):3-4. doi: 10.1080/19336950.2016.1207476. Epub 2016 Jul 1. Channels (Austin). 2017. PMID: 27367468 Free PMC article. No abstract available.
Similar articles
-
Multiple ion channel block by the cation channel inhibitor SKF-96365 in myocytes from the rabbit atrioventricular node.Physiol Rep. 2016 Jun;4(11):e12819. doi: 10.14814/phy2.12819. Physiol Rep. 2016. PMID: 27288059 Free PMC article.
-
Characteristics of single cells isolated from the atrioventricular node of the adult guinea-pig heart.Pflugers Arch. 2002 Dec;445(3):311-20. doi: 10.1007/s00424-002-0932-8. Epub 2002 Sep 26. Pflugers Arch. 2002. PMID: 12466932
-
Modulation by endothelin-1 of spontaneous activity and membrane currents of atrioventricular node myocytes from the rabbit heart.PLoS One. 2012;7(3):e33448. doi: 10.1371/journal.pone.0033448. Epub 2012 Mar 29. PLoS One. 2012. PMID: 22479400 Free PMC article.
-
Ion channel and exchange currents in single myocytes isolated from the rabbit atrioventricular node.Can J Cardiol. 1997 Dec;13(12):1175-82. Can J Cardiol. 1997. PMID: 9444299 Review.
-
[Electrophysiological Effects of Ionophore-induced Increases in Intracellular Na+ in Cardiomyocytes].Yakugaku Zasshi. 2021;141(5):705-710. doi: 10.1248/yakushi.20-00235. Yakugaku Zasshi. 2021. PMID: 33952755 Review. Japanese.
Cited by
-
Propagation Failure by TRPM4 Overexpression.Biophys J. 2019 Feb 5;116(3):469-476. doi: 10.1016/j.bpj.2018.11.3137. Epub 2018 Dec 7. Biophys J. 2019. PMID: 30598284 Free PMC article.
-
Modulation of Spontaneous Action Potential Rate by Inositol Trisphosphate in Myocytes from the Rabbit Atrioventricular Node.Cells. 2024 Aug 30;13(17):1455. doi: 10.3390/cells13171455. Cells. 2024. PMID: 39273026 Free PMC article.
-
Gradient-based parameter optimization method to determine membrane ionic current composition in human induced pluripotent stem cell-derived cardiomyocytes.Sci Rep. 2022 Nov 9;12(1):19110. doi: 10.1038/s41598-022-23398-0. Sci Rep. 2022. PMID: 36351955 Free PMC article. Clinical Trial.
-
Sodium channel biophysics, late sodium current and genetic arrhythmic syndromes.Pflugers Arch. 2017 Jun;469(5-6):629-641. doi: 10.1007/s00424-017-1959-1. Epub 2017 Mar 6. Pflugers Arch. 2017. PMID: 28265756 Free PMC article. Review.
-
Cell-specific models of hiPSC-CMs developed by the gradient-based parameter optimization method fitting two different action potential waveforms.Sci Rep. 2024 Jun 7;14(1):13086. doi: 10.1038/s41598-024-63413-0. Sci Rep. 2024. PMID: 38849433 Free PMC article.
References
-
- Tawara S. 1 ed. Fischer; Jena, Germany: 1906. Das Reizleitungssystem des Saugetierherzens.
-
- Meijler F.L., Janse M.J. Morphology and electrophysiology of the mammalian atrioventricular node. Physiol. Rev. 1988;68:608–647. - PubMed
-
- Childers R. The AV node: normal and abnormal physiology. Prog. Cardiovasc. Dis. 1977;XIX(5):361–381. - PubMed
-
- Mangoni M.E., Nargeot J. Genesis and regulation of the heart automaticity. Physiol. Rev. 2008;88:919–982. - PubMed
Publication types
MeSH terms
Substances
Grants and funding
LinkOut - more resources
Full Text Sources
Other Literature Sources
