. 2016 Jul:168:6-15.
doi: 10.1016/j.clim.2016.04.014. Epub 2016 Apr 27.

Co-administration of α-GalCer analog and TLR4 agonist induces robust CD8(+) T-cell responses to PyCS protein and WT-1 antigen and activates memory-like effector NKT cells

Affiliations

Co-administration of α-GalCer analog and TLR4 agonist induces robust CD8(+) T-cell responses to PyCS protein and WT-1 antigen and activates memory-like effector NKT cells

Jordana G Coelho-Dos-Reis et al. Clin Immunol. 2016 Jul.

Abstract

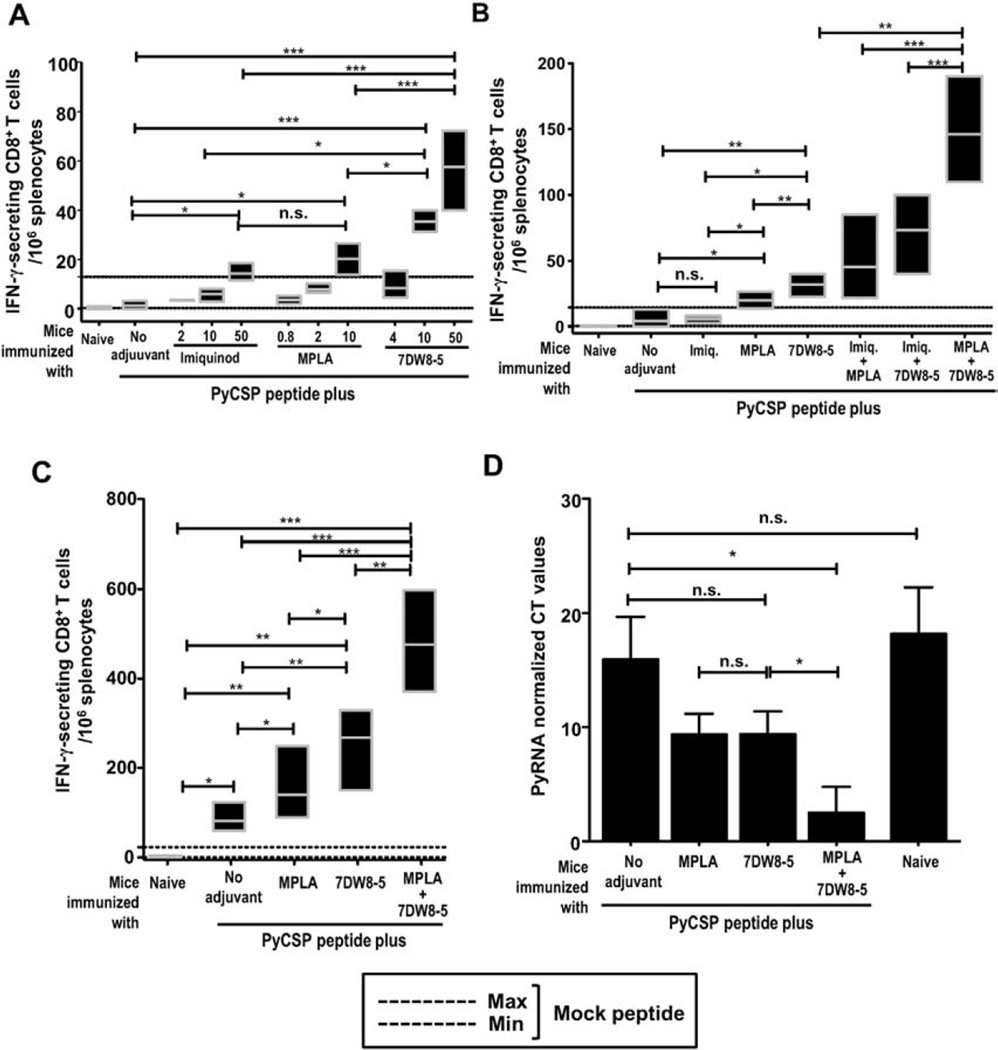
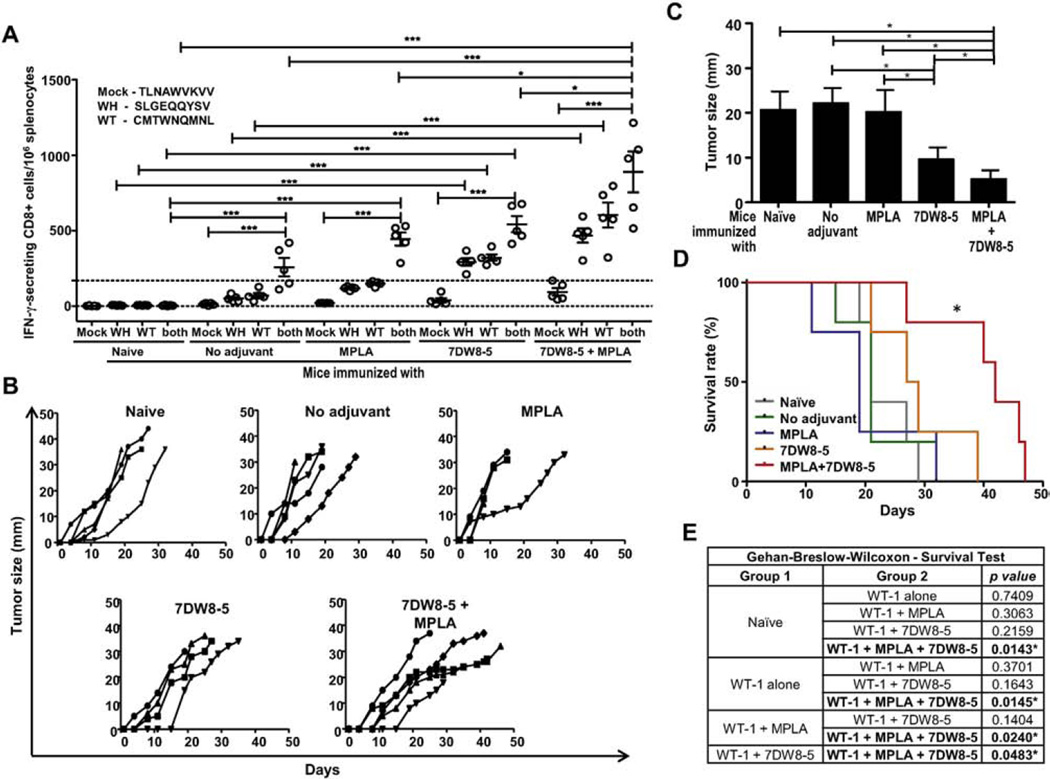
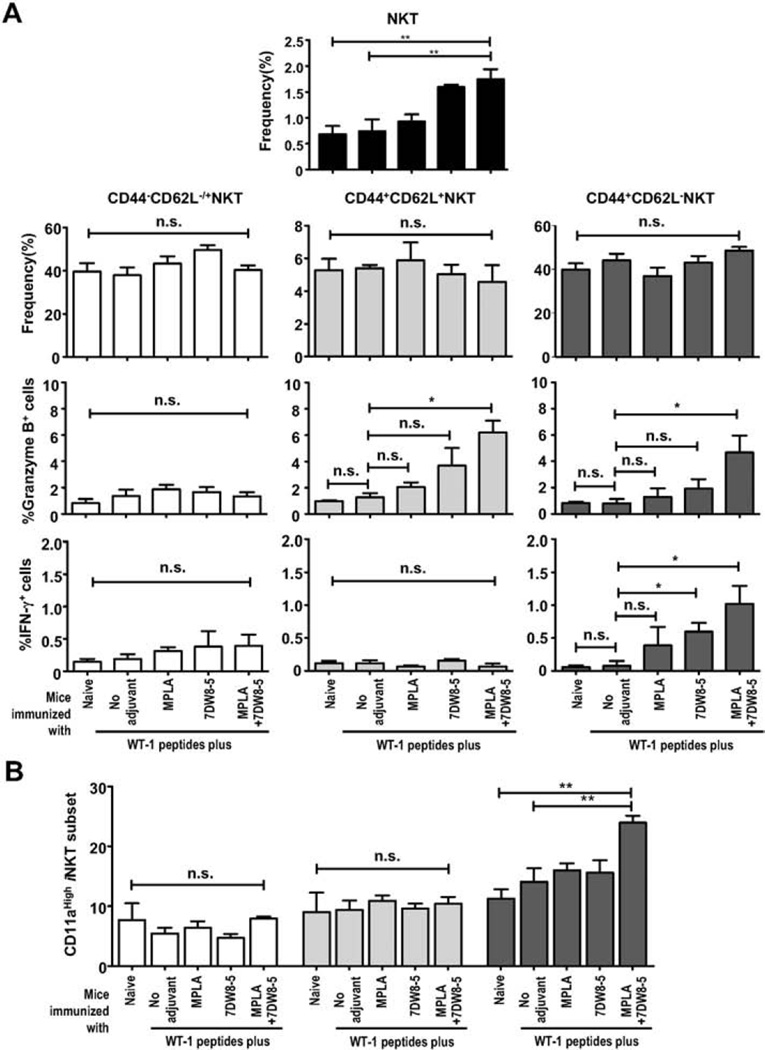
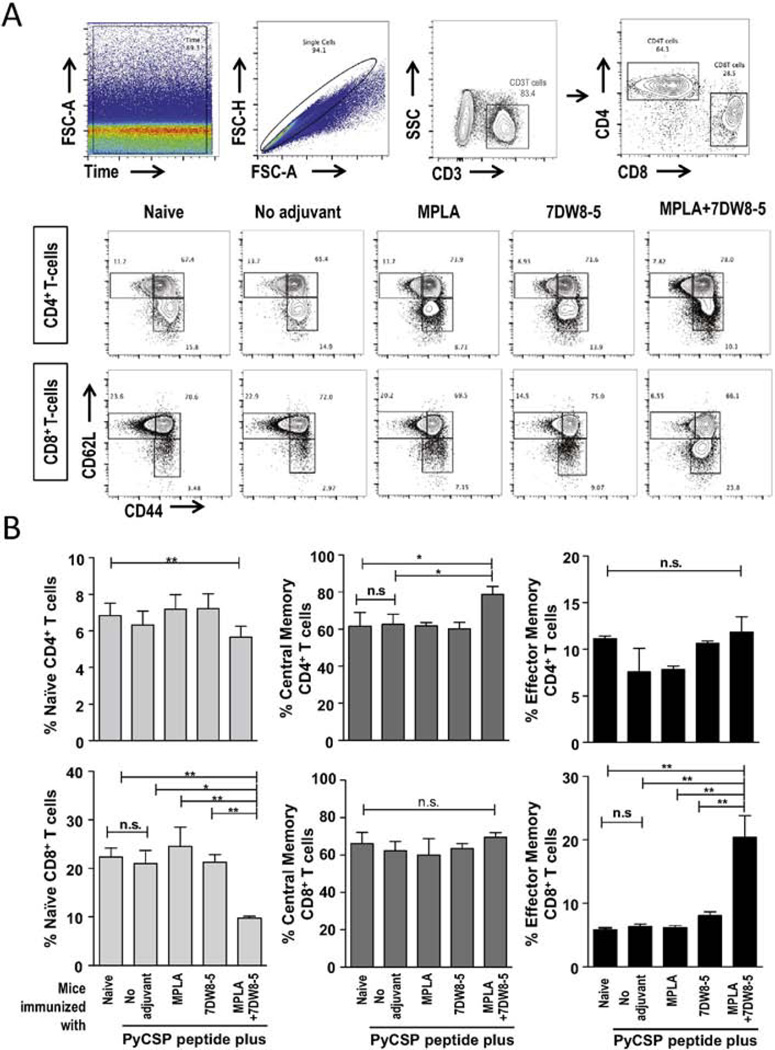
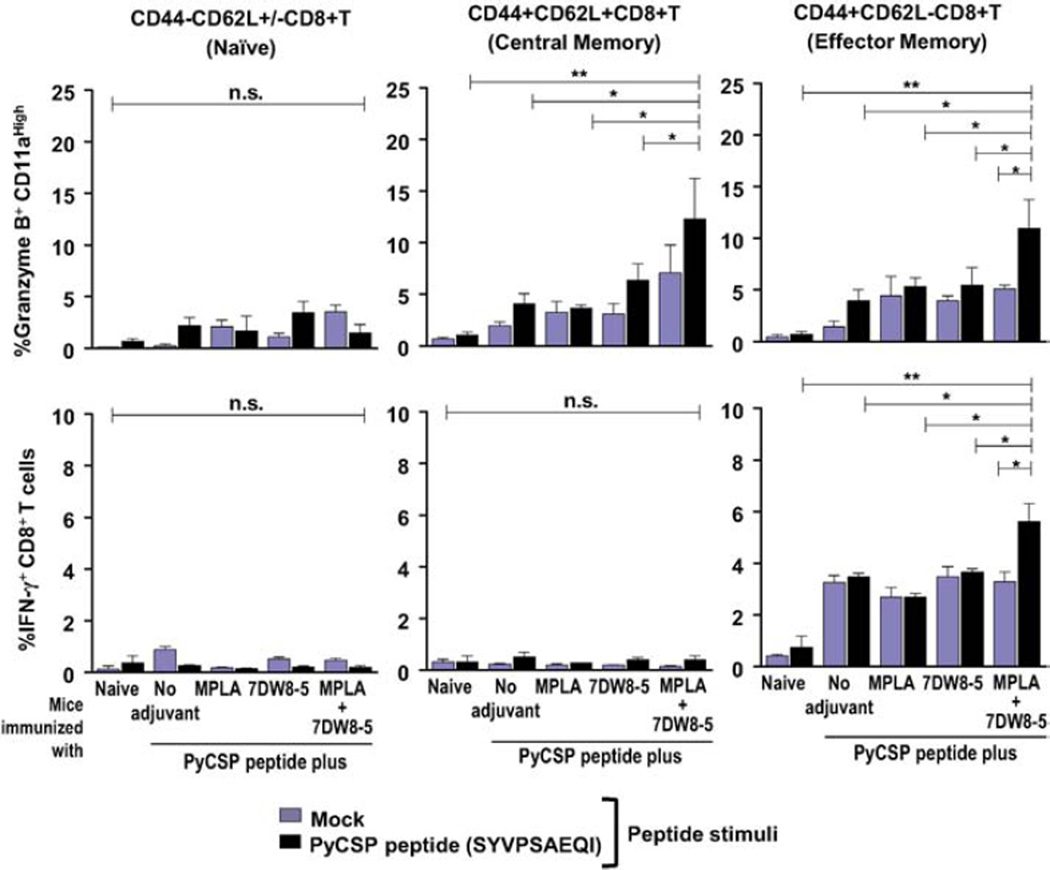
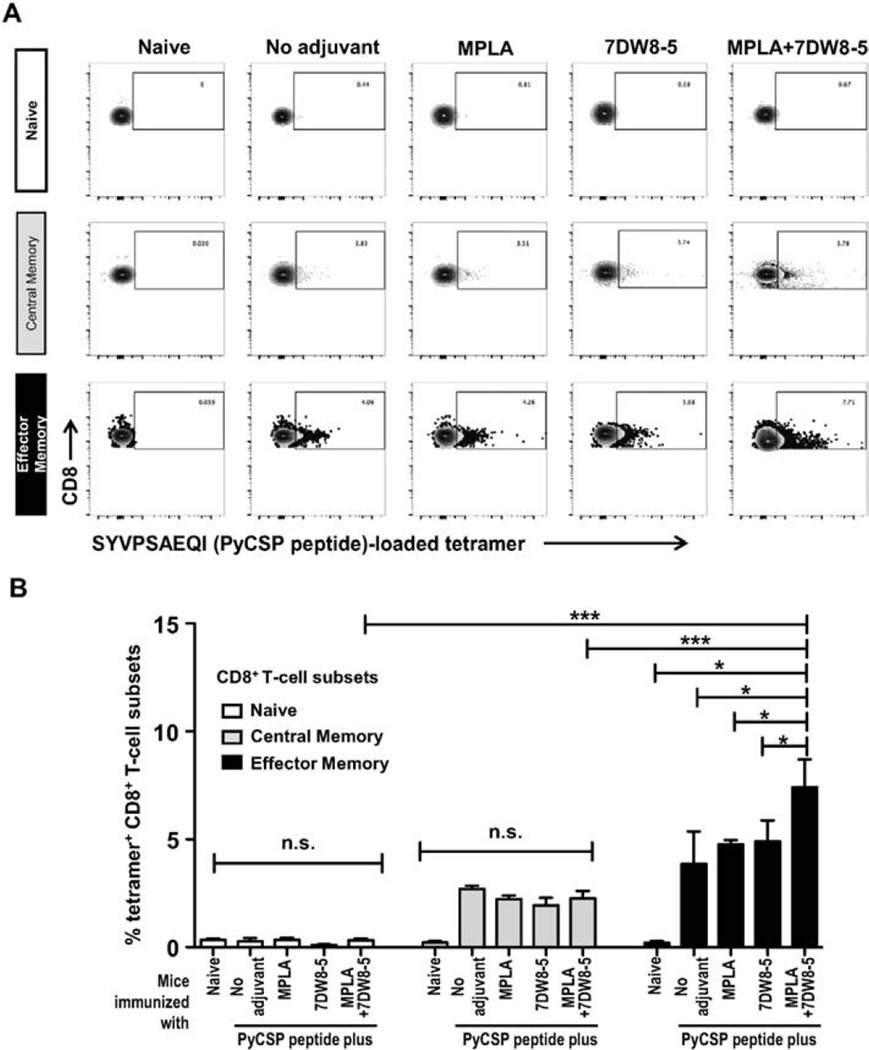
In the present study, the combined adjuvant effect of 7DW8-5, a potent α-GalCer-analog, and monophosphoryl lipid A (MPLA), a TLR4 agonist, on the induction of vaccine-induced CD8(+) T-cell responses and protective immunity was evaluated. Mice were immunized with peptides corresponding to the CD8(+) T-cell epitopes of a malaria antigen, a circumsporozoite protein of Plasmodium yoelii, and a tumor antigen, a Wilms Tumor antigen-1 (WT-1), together with 7DW8-5 and MPLA, as an adjuvant. These immunization regimens were able to induce higher levels of CD8(+) T-cell responses and, ultimately, enhanced levels of protection against malaria and tumor challenges compared to the levels induced by immunization with peptides mixed with 7DW8-5 or MPLA alone. Co-administration of 7DW8-5 and MPLA induces activation of memory-like effector natural killer T (NKT) cells, i.e. CD44(+)CD62L(-)NKT cells. Our study indicates that 7DW8-5 greatly enhances important synergistic pathways associated to memory immune responses when co-administered with MPLA, thus rendering this combination of adjuvants a novel vaccine adjuvant formulation.

Keywords: Adjuvant; CD1d; Cancer vaccine; Circumsporozoite protein; Glycolipid; Malaria vaccine; Memory-like effector NKT cells; NKT cells; TLR4; WT-1.


Figures

Fig. 1
Fig. 1
PyCSP-specific CD8+ T-cell response and protection against P. yoelii sporozoite challenge upon i.m. immunization with a PyCSP peptide mixed with adjuvants. (A) Groups of BALB/c mice (n = 5) received a single dose of i.m. immunization with a PyCSP-derived peptide (SYVPSAEQI; 20 µg) mixed with different doses of 7DW8-5, MPLA or Imiquimod. Two weeks later, splenocytes were collected from immunized as well as naïve mice, and the level of PyCSP-specific CD8+ T-cell response was determined by ELISpot assay. In (A–C), results of IFN-γ-secreting cells/million splenocytes were expressed as mean bars and error for each group. (B) Groups of BALB/c mice (n = 5) received a single dose of i.m. immunization with a PyCSP peptide mixed with 7DW8-5, MPLA, or Imiquimod alone or in combination. Two weeks later, splenocytes were collected from immunized as well as naïve mice, and the level of PyCSP-specific CD8+ T-cell response was determined by ELISpot assay. (C) Groups of BALB/c mice (n = 5) received three doses of i.m. immunization with a PyCSP peptide alone, or with a PyCSP peptide mixed with 7DW8-5 and/or MPLA with 3-week interval. Two weeks after the last immunization, splenocytes were collected from immunized as well as naïve mice, and the level of PyCSP-specific CD8+ T-cell response was determined by ELISpot assay. (D) Groups of BALB/c mice (n = 6) received three doses of i.m. immunization with a PyCSP peptide alone, or with a PyCSP peptide mixed with 7DW8-5 and/or MPLA with 3-week interval. Two weeks after the last immunization, immunized as well as non-immunized naïve mice (n = 6) were challenged with live P. yoelli sporozoites, and 42-hours later, livers were collected and the amounts of P. yoelii-specific ribosomal RNA (PyrRNA) in the liver were determined by qRT-PCR. The results are expressed as normalized PyrRNA copy number. In Fig. 1, all the experiments were repeated at least three times. Statistical significance was displayed as ***, **, or *, if the p value is <0.001, <0.01, or <0.05, respectively. The abbreviation - n.s. - stands for “not significant” and was assigned if p ≥ 0.05.
Fig. 2
Fig. 2
WT-1-specific CD8+ T-cell responses and protection against WT-1 tumor challenge upon i.m. immunization with WT-1-derived peptides mixed with two adjuvants, 7DW8-5 and MPLA. (A) Groups of HLA-A2 transgenic mice with B6 background (n = 5) received three doses of i.m. immunization with pooled HLA-A2-restricted WT-1-derived peptides, WH (SLGEQQYSV) and WT (CMTWNQMNL), with 7DW8-5 (10 µg) and/or MPLA (2 µg). (A) Two weeks after the last immunization, splenocytes were collected from immunized as well as naïve mice, and the level of CD8+ T-cell response specific for separated or pooled WT-1 peptides was determined by ELISpot assay. (B) Two weeks after the last immunization, immunized as well as naïve mice (n = 4–5) were subcutaneously challenged with WT-1+HLA-A2+C1498 tumor cells, and the size (diameters in millimeters) of the tumor growth was measured up to 50 days. (C) Cross-sectional comparison of tumor size (diameters in millimeters) among immunized mouse groups (WT-1 peptides with or without adjuvants) as well as a naive mouse group at day 15 post challenge with WT-1+HLA-A2+ C1498 tumor cells. (D) Survival rate of immunized mouse groups as well as a naïve mouse group after challenge with WT-1+HLA-A2+ C1498 tumor cells. (E) Results for the comparisons of survival curves registered for groups of mice consisting of a non-immunized, naïve mouse group, as well as groups immunized with WT-1 peptides with or without adjuvants. Statistical analyses of survival rates were performed using Gehan-Breslow Wilcoxon test. In Fig. 2, experiments were repeated twice. Statistical significance was displayed as ***, **, or *, if the p value is <0.001, <0.01, or <0.05, respectively.
Fig. 3
Fig. 3
Analysis of NKT-cell memory subsets. Splenocytes were obtained from a group (n = 5) of naïve HLA-A2 transgenic mice (B6 background), as well as groups (n = 5) of mice received five doses of i.m. immunization with two WT-1 peptides, or with WT-1 peptides mixed with 7DW8-5 and/or MPLA. Then the percentages of CD44CD62L+/− (naïve); CD44+CD62L+ (central); CD44+CD62L (effector) and total NKT-cell subsets were analyzed by FACS. Results are expressed as the percentages of total splenocytes. In (A), the percentages of the NKT-cell subsets, Granzyme B+-cells and IFN-γ+-cells among CD44CD62L+/−, CD44+CD62L+ and CD44+CD62L NKT cells were demonstrated. In (B), the percentage of CD11a+ cells among the subsets pre-defined as CD44CD62L+/−, CD44+CD62L+ and CD44+CD62L among total NKT cells was shown. In this figure, experiments were repeated twice. Statistical significance was displayed as ***, **, or *, if the p value is <0.001, <0.01, or <0.05, respectively. The abbreviation - n.s. - stands for “not significant” and was assigned if p ≥ 0.05.
Fig. 4
Fig. 4
CD4+ and CD8+ T-cell memory phenotypes elicited upon i.m. immunization with a PyCSP peptide mixed with 7DW8-5 and MPLA. Splenocytes were obtained from BALB/c mice after three doses of i.m. immunization with a PyCSP peptide alone, or with a PyCSP peptide mixed with 7DW8-5 and/or MPLA. Splenocytes from a group of non-immunized mice (n = 5) were used as a negative control. Then the percentages of CD44CD62L+/− (naïve); CD44+CD62L+ (central) and CD44+CD62L (effector) CD4+ and CD8+ T-cell subsets, were analyzed by FACS. (A) A gate on Time versus FSC was built to exclude carry over events from the previous sample. After that, a singlet gate on FSC-Area versus FSC-height was set to remove doublets. From singlets, T-cells were selected by CD3 versus SSC plot, followed by CD4 versus CD8 plot. CD4+ versus CD8+ T-cells were evaluated for CD62 versus CD44 expression. The subsets CD44CD62L−/+, CD44+CD62L+ and CD44+CD62L were defined as naïve, central and effector CD4+ and CD8+ T-cells, respectively. (B) The results are expressed in percentages. In this figure, experiments were repeated twice. Statistical significance was displayed as ***, **, or *, if the p value is <0.001, <0.01, or <0.05, respectively. The abbreviation - n.s. - stands for “not significant” and was assigned if p ≥ 0.05.
Fig. 5
Fig. 5
Function of CD8+ T-cell memory subsets elicited after i.m. immunization with a PyCSP peptide mixed with 7DW8-5 and MPLA. Splenocytes were obtained from BALB/c mice after three doses of i.m. immunization with a PyCSP peptide alone, or with a PyCSP peptide mixed with 7DW8-5 and/or MPLA. Splenocytes from a group of non-immunized mice (n = 5) were used as a negative control. Then the percentage of Granzyme B+-CD11ahigh cells (A) IFN-γ+-cells (B) among CD8+ T-cells among naïve (CD44CD62L+/−), central (CD44+CD62L+) and effector (CD44+CD62L) subsets, respectively, were analyzed by FACS. In this figure, experiments were repeated twice. Statistical significance was displayed as ***, **, or *, if the p value is <0.001, <0.01, or <0.05, respectively. The abbreviation - n.s. - stands for “not significant” and was assigned if p ≥ 0.05.
Fig. 6
Fig. 6
Assessment of specific CD8+ T-cell responses elicited after i.m. immunization with PyCSP-derived peptide mixed with 7DW8-5 and MPLA. Splenocytes were obtained from BALB/c mice after three doses of i.m. immunization with a PyCSP peptide alone, or with a PyCSP peptide mixed with 7DW8-5 and/or MPLA, and the tetramer assay was performed. Splenocytes from a group of non-immunized mice (n = 5) were used as a negative control. In (A), flow cytometric plots of CD8 versus SYVPSAEQI-loaded tetramer are shown for all immunization schemes as well as non-immunized controls after selection of naïve (CD44CD62L+/−), central (CD44+CD62L+) and effector (CD44+CD62L) subsets as described. In (B), the percentage of SYVPSAEQI-loaded tetramer+ T-cells among naïve (CD44CD62L+/−), central (CD44+CD62L+) and effector (CD44+CD62L) CD8+ T-cells subsets, respectively was measured by FACS. The cell subsets were indicated by the colors (naïve –white; central – gray; effector – black). In this figure, experiments were repeated twice and in duplicates. Statistical significance was displayed as ***, **, or *, if the p value is <0.001, <0.01, or <0.05, respectively. The abbreviation - n.s. - stands for “not significant” and was assigned if p ≥ 0.05.

Similar articles

Cited by

References

    1. Godfrey DI, MacDonald HR, Kronenberg M, Smyth MJ, Van Kaer L. NKT cells: what's in a name? Nat Rev Immunol. 2004;4:231–237. - PubMed
    1. Wu D, Xing GW, Poles MA, Horowitz A, Kinjo Y, Sullivan B, et al. Bacterial glycolipids and analogs as antigens for CD1d-restricted NKT cells. Proc Natl Acad Sci USA. 2005;102:1351–1356. - PMC - PubMed
    1. Kinjo Y, Wu D, Kim G, Xing GW, Poles MA, Ho DD, et al. Recognition of bacterial glycosphingolipids by natural killer T cells. Nature. 2005;434:520–525. - PubMed
    1. Kinjo Y, Tupin E, Wu D, Fujio M, Garcia-Navarro R, Benhnia MR, et al. Natural killer T cells recognize diacylglycerol antigens from pathogenic bacteria. Nat Immunol. 2006;7:978–986. - PubMed
    1. Lantz O, Bendelac A. An invariant T cell receptor α chain is used by a unique subset of MHC class I specific CD4+ and CD4−8- T cells in mice and humans. J Exp Med. 1994;180:1097–1106. - PMC - PubMed

Publication types

MeSH terms