

Trends in Energy Intake from Alcoholic Beverages among US Adults by Sociodemographic Characteristics, 1989-2012
- PMID: 27132721
- PMCID: PMC4921270
- DOI: 10.1016/j.jand.2016.03.008
Trends in Energy Intake from Alcoholic Beverages among US Adults by Sociodemographic Characteristics, 1989-2012
Abstract
Background: Long-term US trends in alcoholic beverage calorie intakes remain unexamined, particularly with respect to changes in population subgroup-specific patterns over time.
Objective: This study examined shifts in the consumption of alcoholic beverages, in total and by beverage type, on any given day among US adults in relation to sociodemographic characteristics.
Design: This study was a repeated cross-sectional analysis of data from the 1989-1991 and 1994-1996 Continuing Survey of Food Intakes by Individuals and the 2003-2006 and 2009-2012 National Health and Nutrition Examination Surveys.
Participants and setting: Adults aged ≥19 years (N=39,298) were targeted. A subset of alcoholic beverage consumers (n=7,081) were studied.
Statistical analyses performed: Survey weighted mean per capita per day intakes (among all participants, both consumers of alcoholic beverages and nonconsumers) and contributions of beer, wine, and liquor/mixed drinks to total alcoholic beverage energy were determined. Multivariable regression models were used to examine trends in the proportion of alcoholic beverage consumers and the per consumer intakes (among consumers of alcoholic beverages only).
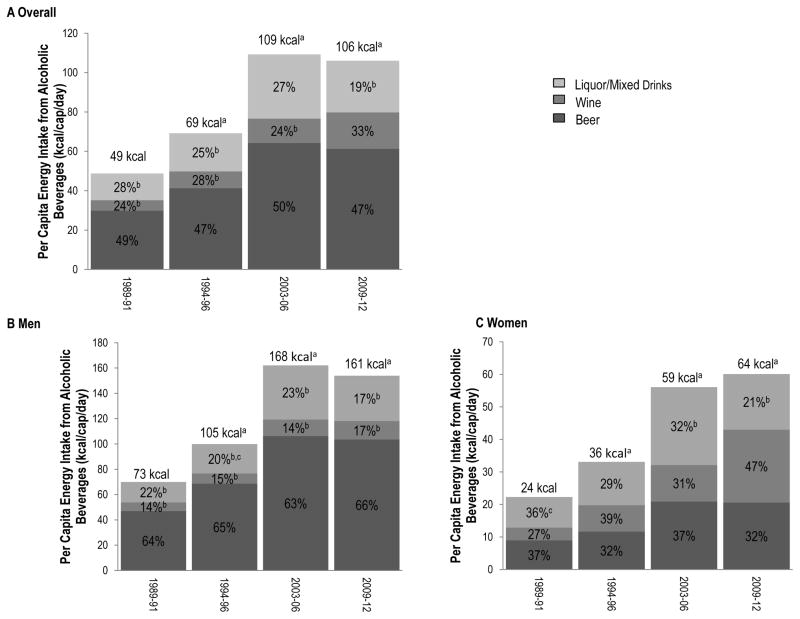
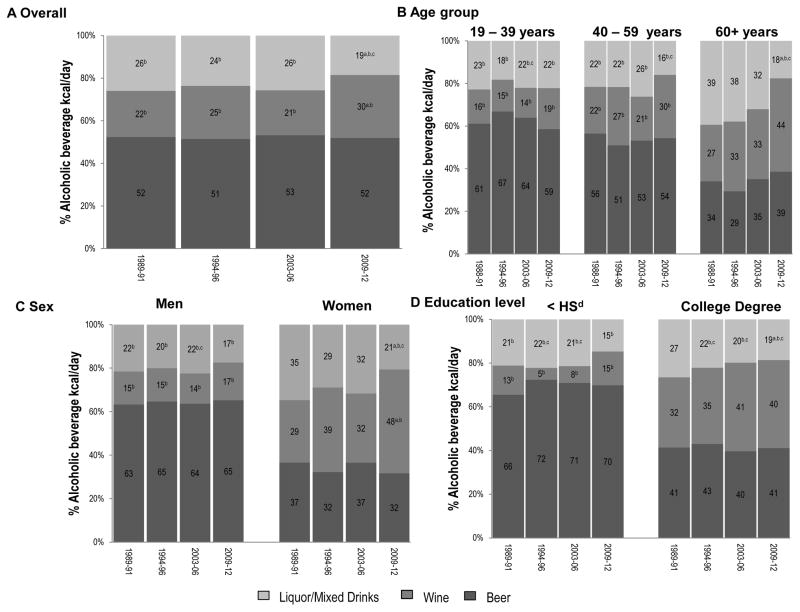
Results: Per capita intakes from alcoholic beverages increased from 49 kcal/capita/day in 1989-1991 to 109 kcal/capita/day in 2003-2006 (P<0.001). The proportion consuming alcoholic beverages on any given day increased significantly from 1989-1991 to 2009-2012 (P for overall increasing trend <0.0001) for most sociodemographic subgroups. Per consumer, alcoholic beverage calories increased between 1989-1991 and 1994-1996 (P<0.05) for many subpopulations. Adults with less than high school education were less likely to consume alcohol, yet had higher per consumer calorie intakes compared with adults with a college degree. Women and adults aged ≥60 years experienced a shift away from liquor/mixed drinks toward wine between 2003-2006 and 2009-2012. Beer contributed roughly 70% to total alcoholic beverage intake for less educated consumers across time.
Conclusions: These results indicate there has been an increase in the proportion of US adults who drink on any given day and an increase in calories consumed from alcoholic beverages when drinking occurs.
Keywords: Alcoholic beverages; Beer; Calories; Liquor; Wine.
Copyright © 2016 Academy of Nutrition and Dietetics. Published by Elsevier Inc. All rights reserved.
Conflict of interest statement
The authors have no conflicts of interest.
Figures
Overall
Men
Women
References
-
- United States Department of Agriculture and United States Department of Health and Human Services. [Accessed June 13, 2013];Dietary Guidelines for Americans, 2010. (7). 2010 Dec; http://health.gov/dietaryguidelines/dga2010/dietaryguidelines2010.pdf.
-
- Sayon-Orea C, Martinez-Gonzalez MA, Bes-Rastrollo M. Alcohol consumption and body weight: a systematic review. Nutrition reviews. 2011;69(8):419–431. - PubMed
Publication types
MeSH terms
Grants and funding
LinkOut - more resources
Full Text Sources
Other Literature Sources
Molecular Biology Databases
