. 2016 May 10;6(5):772-783.
doi: 10.1016/j.stemcr.2016.04.002. Epub 2016 Apr 28.

Mechanism and Role of SOX2 Repression in Seminoma: Relevance to Human Germline Specification

Affiliations

Mechanism and Role of SOX2 Repression in Seminoma: Relevance to Human Germline Specification

Ritu Kushwaha et al. Stem Cell Reports. .

Abstract

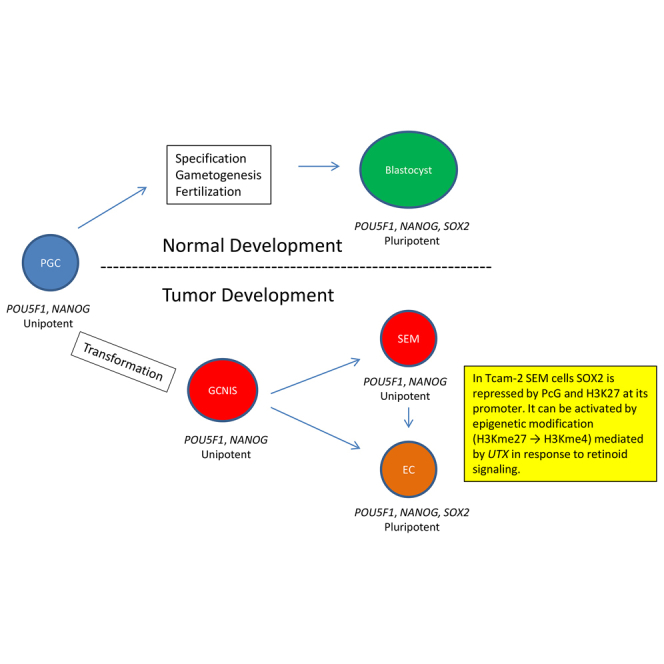
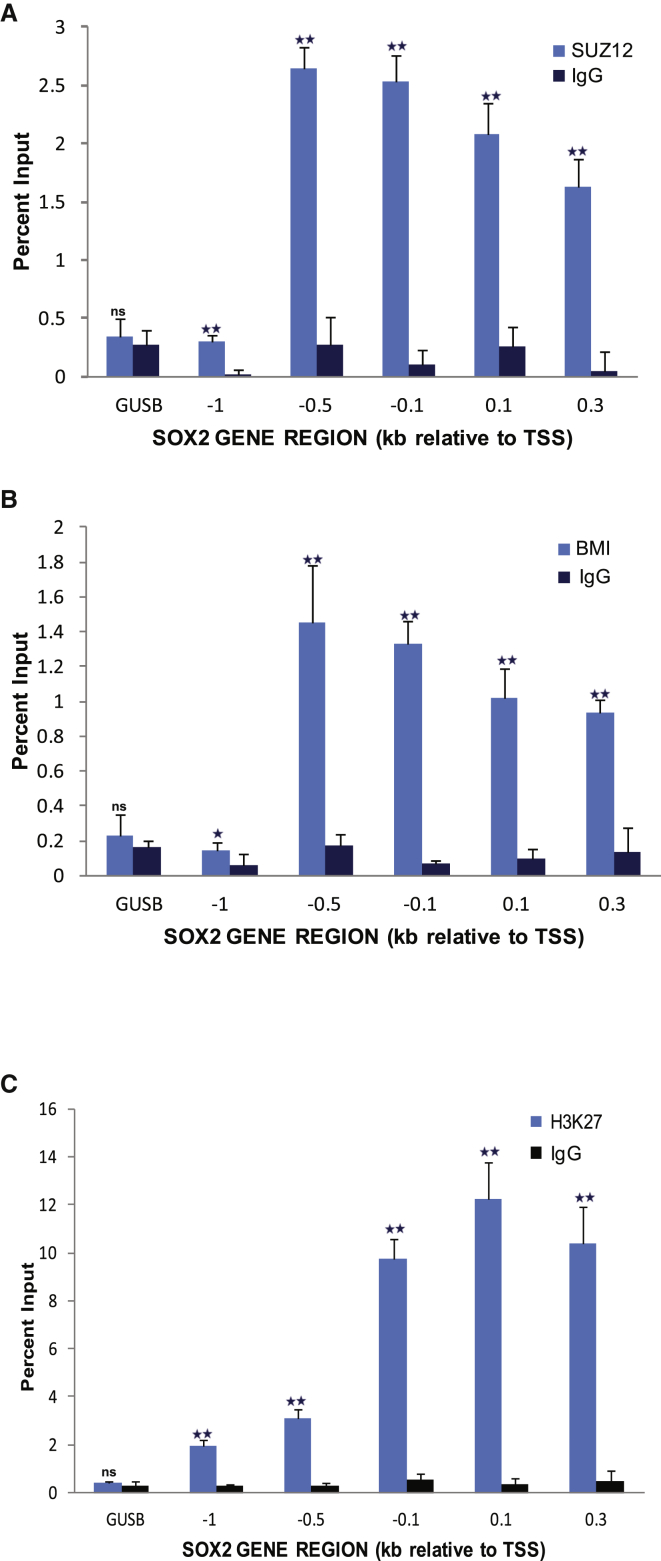
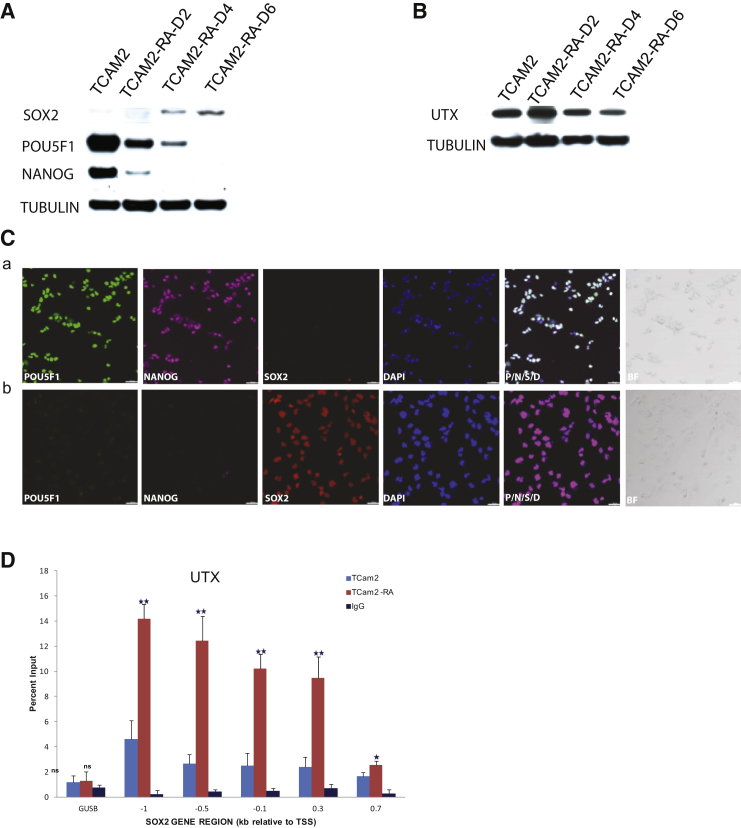
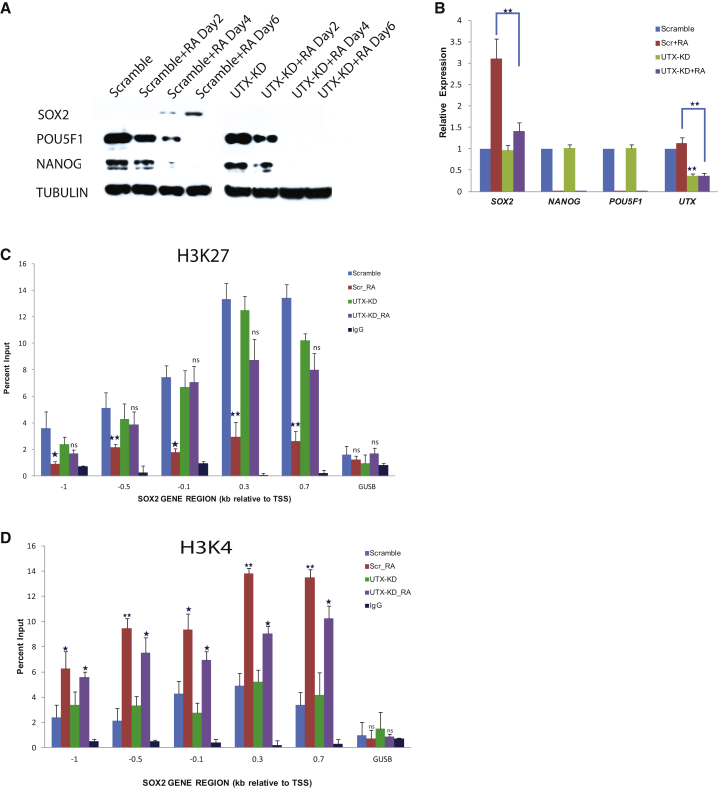
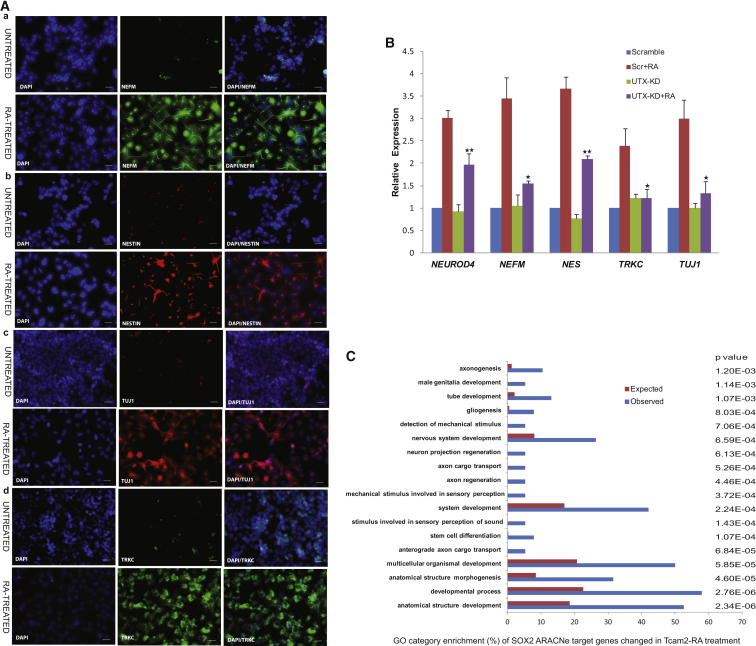
Human male germ cell tumors (GCTs) are derived from primordial germ cells (PGCs). The master pluripotency regulator and neuroectodermal lineage effector transcription factor SOX2 is repressed in PGCs and the seminoma (SEM) subset of GCTs. The mechanism of SOX2 repression and its significance to GC and GCT development currently are not understood. Here, we show that SOX2 repression in SEM-derived TCam-2 cells is mediated by the Polycomb repressive complex (PcG) and the repressive H3K27me3 chromatin mark that are enriched at its promoter. Furthermore, SOX2 repression in TCam-2 cells can be abrogated by recruitment of the constitutively expressed H3K27 demethylase UTX to the SOX2 promoter through retinoid signaling, leading to expression of neuronal and other lineage genes. SOX17 has been shown to initiate human PGC specification, with its target PRDM1 suppressing mesendodermal genes. Our results are consistent with a role for SOX2 repression in normal germline development by suppressing neuroectodermal genes.


Figures

None
Graphical abstract
Figure 1
Figure 1
Top GO Categories Enriched in GEPs of SEM and EC in Comparison with Normal Testis The graphs were prepared using the Cytoscape plugin (BiNGO). (A and B) Upregulated categories in SEM (A) and EC (B) compared with normal testis. (C and D) Downregulated categories in SEM (C) and EC (D) compared with normal testis.
Figure 2
Figure 2
ARACNe-Predicted SOX2 Targets Are Enriched in NT2D/1 Cells and EC Compared with TCam-2 Cells and SEM (A) GSEA enrichment analysis of targets of (a) SOX2 (p = 0.05), (b) POU5F1 (p = 0.04), and (c) NANOG (p = 0.0) in TCam-2 versus NT2/D1 cells. (B) GSEA enrichment analysis of targets in EC versus SEM of (a) SOX2 (0.027), (b) POU5F1 (0.5), and (c) NANOG (0.4). All p values are by two-tailed t test.
Figure 3
Figure 3
SOX2 Expression Is Not Altered in PRDM1-KD TCam-2 Cells (A) qRT-PCR analysis of (a) PRDM1 and (b) SOX2 expression in PRDM1-KD cells following normalization to PGK1 signal. Data represent mean ± SD of three independent experiments. ∗∗∗p > 0.001 by Student’s t test; ns, not significant. (B) Representative IF images of (a) NT2D-1, (b) TCam-2, and (c) PRDM1-KD TCam-2 cells stained for DAPI (blue), PRDM1 (green), and SOX2 (red), and merged images. Scale bars represent 100 μm.
Figure 4
Figure 4
PcG Proteins SUZ12 and BMI1 and the Repressive Chromatin Mark H3K27me3 Are Enriched at SOX2 Promoter in TCam-2 Cells ChIP analyses were performed using antibodies for (A) SUZ12, (B) BMI1, (C) H2K27me3, or immunoglobulin G (IgG) (as nonspecific control) in Tcam-2 cells. Plotted values are relative enrichment to 10% input and measured for indicated site in the SOX2 promoter and GUSB (β-glucuronidase) gene (control). Data represent mean ± SD of three independent experiments. Student’s t test: ns, not significant; ∗∗p < 0.01; p < 0.05.
Figure 5
Figure 5
SOX2 Is Expressed in TCam-2 Cells following RA Treatment (A) Immunoblot of RA-treated and untreated cells showing increased SOX2 (35 kDa) expression and decreased POU5F1 (39 kDa) and NANOG (34 kDa) expression over a 6-day time course. Tubulin (50 kDa) is loading control. (B) Immunoblot showing unchanged UTX (150 kDa) expression over a 6-day time course. Tubulin (50 kDa) is loading control. (C) IF showing SOX2, POU5F1, and NANOG expression following RA treatment. (a) Untreated TCam-2 cells showing POU5F1 (green), NANOG (magenta), and DAPI (blue), but not SOX2 (red) expression. (b) RA-treated TCam-2 cells showing SOX2 but not POU5F1 and NANOG expression. BF is brightfield image. Scale bars represent 100 μm. (D) RA-treated and untreated TCam-2 cells were subjected to ChIP-qPCR using UTX antibody or an IgG antibody (nonspecific control). The immunoprecipitated DNA was subjected to PCR using primers specific to the SOX2 promoter region. Data represent mean ± SD of three independent experiments. Student’s t test: ns, not significant; ∗∗p < 0.01; p < 0.05.
Figure 6
Figure 6
Epigenetic Modifications of SOX2 Promoter Leading to RA-Induced Derepression Are Modulated by UTX (A) Expression of SOX2, POU5F1, and NANOG in the RA-treated UTX-KD cells compared with scramble (scr) cells in a 6-day time-course experiment. (B) qRT-PCR showing expression level of SOX2, NANOG, POU5F1, and UTX in the untreated scr versus UTX-KD cells and treated scr versus UTX-KD cells. Data represent mean ± SD of the three independent experiments. ∗∗p < 0.01 between treated UTX-KD and scr by Student’s t test. (C) ChIP-qPCR showing loss of H3K27me3 enrichment at SOX2 promoter of RA-treated scr cells compared with untreated cells, whereas the enrichment is unchanged in RA-treated UTX-KD cells. Data represent mean ± SD of three independent experiments. Student’s t test: ns, not significant; ∗∗p < 0.01; p < 0.05. (D) ChIP-qPCR with H3K4me3 antibody showing enrichment at SOX2 promoter of RA-treated scr cells compared with untreated scr cells and RA-treated UTX-KD cells compared with untreated KD cells. Data represent mean ± SD of three independent experiments. Student’s t test: ns, not significant; ∗∗p < 0.01; p < 0.05.
Figure 7
Figure 7
Neuronal Marker Genes Are Upregulated following SOX2 Derepression in TCam-2 Cells in Response to Retinoid Signaling (A) Representative IF showing staining with (a) neurofilament (NEFM), (b) nestin (NES), (c) neuron-specific class III β-tubulin (TUJI), and (d) neurotrophic tyrosine kinase receptor type 3 (TRKC). Left image, DAPI; middle image, neuronal gene; right image, merged. For each antibody the upper panel represents untreated cells and the lower panel RA-treated cells. Scale bars represent 100 μm. (B) Expression of neuronal genes in RA-treated UTX-KD cells compared with RA-treated scramble cells by qRT-PCR. Data represent mean ± SD of three independent experiments. ∗∗ p < 0.01, p < 0.05 by Student’s t test. (C) GO categories enriched in ARACNe-predicted SOX2 targets of TCam-2 cells following RA treatment. Blue bar represents actual enriched number of genes; red bar represents expected enrichment by chance.

References

    1. Andrews P.W., Matin M.M., Bahrami A.R., Damjanov I., Gokhale P., Draper J.S. Embryonic stem (ES) cells and embryonal carcinoma (EC) cells: opposite sides of the same coin. Biochem. Soc. Trans. 2005;6:1526–1530. - PubMed
    1. Bracken A.P., Dietrich N., Pasini D., Hansen K.H., Helin K. Genome-wide mapping of Polycomb target genes unravels their roles in cell fate transitions. Genes Dev. 2006;20:1123–1136. - PMC - PubMed
    1. Chaganti R.S., Houldsworth J. Genetics and biology of adult human male germ cell tumors. Cancer Res. 2000;60:1475–1482. - PubMed
    1. Copur Ö., Müller J. The histone H3-K27 demethylase Utx regulates HOX gene expression in Drosophila in a temporally restricted manner. Development. 2013;140:3478–3485. - PMC - PubMed
    1. De Miguel M.P., Fuentes-Julián S., Alcaina Y. Pluripotent stem cells: origin, maintenance and induction. Stem Cell Rev. 2010;6:633–649. - PubMed

MeSH terms

Supplementary concepts