

Computer-aided Detection of Prostate Cancer with MRI: Technology and Applications
- PMID: 27133005
- PMCID: PMC5355004
- DOI: 10.1016/j.acra.2016.03.010
Computer-aided Detection of Prostate Cancer with MRI: Technology and Applications
Abstract
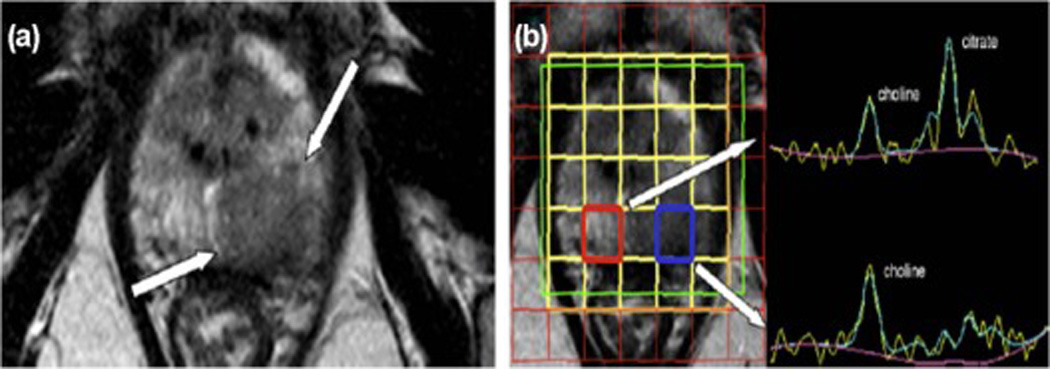
One in six men will develop prostate cancer in his lifetime. Early detection and accurate diagnosis of the disease can improve cancer survival and reduce treatment costs. Recently, imaging of prostate cancer has greatly advanced since the introduction of multiparametric magnetic resonance imaging (mp-MRI). Mp-MRI consists of T2-weighted sequences combined with functional sequences including dynamic contrast-enhanced MRI, diffusion-weighted MRI, and magnetic resonance spectroscopy imaging. Because of the big data and variations in imaging sequences, detection can be affected by multiple factors such as observer variability and visibility and complexity of the lesions. To improve quantitative assessment of the disease, various computer-aided detection systems have been designed to help radiologists in their clinical practice. This review paper presents an overview of literatures on computer-aided detection of prostate cancer with mp-MRI, which include the technology and its applications. The aim of the survey is threefold: an introduction for those new to the field, an overview for those working in the field, and a reference for those searching for literature on a specific application.
Keywords: MR imaging; Prostate cancer; computer-aided detection; image quantification.
Copyright © 2016 The Association of University Radiologists. Published by Elsevier Inc. All rights reserved.
Figures
Similar articles
-
Multiparametric MR imaging of the Prostate: Interpretation Including Prostate Imaging Reporting and Data System Version 2.Radiol Clin North Am. 2018 Mar;56(2):223-238. doi: 10.1016/j.rcl.2017.10.005. Epub 2017 Nov 29. Radiol Clin North Am. 2018. PMID: 29420978 Review.
-
Computer aided-diagnosis of prostate cancer on multiparametric MRI: a technical review of current research.Biomed Res Int. 2014;2014:789561. doi: 10.1155/2014/789561. Epub 2014 Dec 1. Biomed Res Int. 2014. PMID: 25525604 Free PMC article. Review.
-
Multiparametric MRI in detection and staging of prostate cancer.Dan Med J. 2017 Feb;64(2):B5327. Dan Med J. 2017. PMID: 28157066 Review.
-
Multicenter validation of prostate tumor localization using multiparametric MRI and prior knowledge.Med Phys. 2017 Mar;44(3):949-961. doi: 10.1002/mp.12086. Med Phys. 2017. PMID: 28039927
-
A fully automatic computer aided diagnosis system for peripheral zone prostate cancer detection using multi-parametric magnetic resonance imaging.Comput Med Imaging Graph. 2015 Dec;46 Pt 2:219-26. doi: 10.1016/j.compmedimag.2015.09.001. Epub 2015 Sep 12. Comput Med Imaging Graph. 2015. PMID: 26391055
Cited by
-
Precise Identification of Prostate Cancer from DWI Using Transfer Learning.Sensors (Basel). 2021 May 25;21(11):3664. doi: 10.3390/s21113664. Sensors (Basel). 2021. PMID: 34070290 Free PMC article.
-
Assessment of prostate cancer prognostic Gleason grade group using zonal-specific features extracted from biparametric MRI using a KNN classifier.J Appl Clin Med Phys. 2019 Feb;20(2):146-153. doi: 10.1002/acm2.12542. Epub 2019 Feb 3. J Appl Clin Med Phys. 2019. PMID: 30712281 Free PMC article.
-
A classifier model for prostate cancer diagnosis using CNNs and transfer learning with multi-parametric MRI.Front Oncol. 2023 Nov 9;13:1225490. doi: 10.3389/fonc.2023.1225490. eCollection 2023. Front Oncol. 2023. PMID: 38023149 Free PMC article.
-
Prostate zonal segmentation in 1.5T and 3T T2W MRI using a convolutional neural network.J Med Imaging (Bellingham). 2019 Jan;6(1):014501. doi: 10.1117/1.JMI.6.1.014501. Epub 2019 Feb 22. J Med Imaging (Bellingham). 2019. PMID: 30820440 Free PMC article.
-
The role of MRI in prostate cancer: current and future directions.MAGMA. 2022 Aug;35(4):503-521. doi: 10.1007/s10334-022-01006-6. Epub 2022 Mar 16. MAGMA. 2022. PMID: 35294642 Free PMC article. Review.
References
-
- Siegel RL, Miller KD, Jemal A. Cancer statistics, 2015. CA Cancer J Clin. 2015;65:5–29. - PubMed
-
- Pokorny MR, de Rooij M, Duncan E, Schroder FH, Parkinson R, Barentsz JO, Thompson LC. Prospective study of diagnostic accuracy comparing prostate cancer detection by transrectal ultrasound-guided biopsy versus magnetic resonance (MR) imaging with subsequent MR-guided biopsy in men without previous prostate biopsies. Eur Urol. 2014;66:22–29. - PubMed
-
- Schoots IG, Roobol MJ, Nieboer D, Bangma CH, Steyerberg EW, Hunink MG. Magnetic Resonance Imaging-targeted Biopsy May Enhance the Diagnostic Accuracy of Significant Prostate Cancer Detection Compared to Standard Transrectal Ultrasound-guided Biopsy: A Systematic Review and Meta-analysis. Eur Urol. 2014 - PubMed
Publication types
MeSH terms
Grants and funding
LinkOut - more resources
Full Text Sources
Other Literature Sources
Medical
