. 2016 May 10;23(5):821-36.
doi: 10.1016/j.cmet.2016.04.003. Epub 2016 Apr 28.

Chronic Activation of γ2 AMPK Induces Obesity and Reduces β Cell Function

Affiliations

Chronic Activation of γ2 AMPK Induces Obesity and Reduces β Cell Function

Arash Yavari et al. Cell Metab. .

Abstract

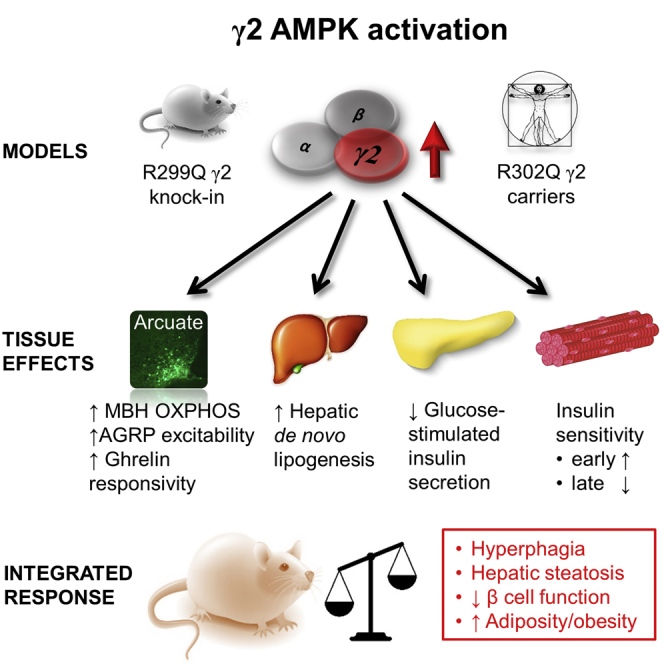
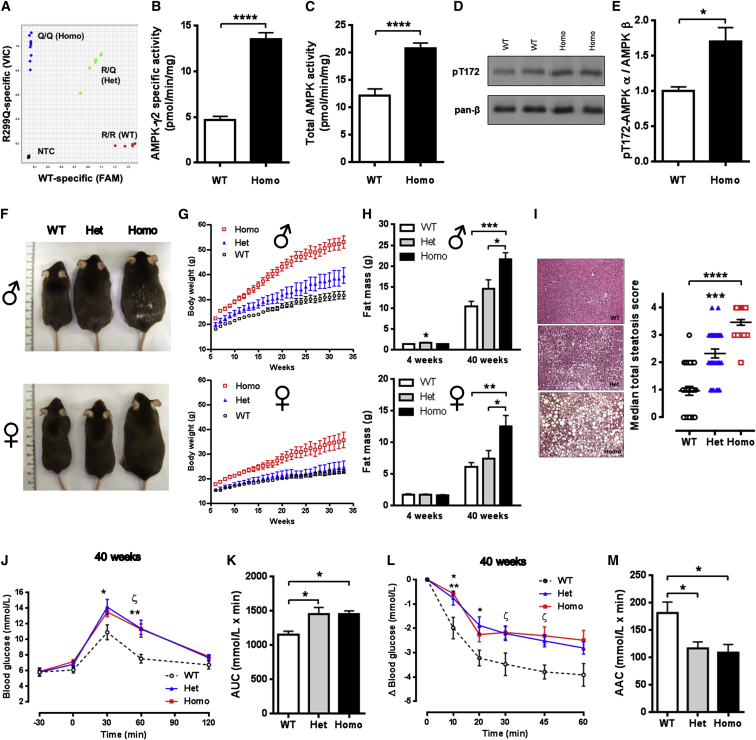
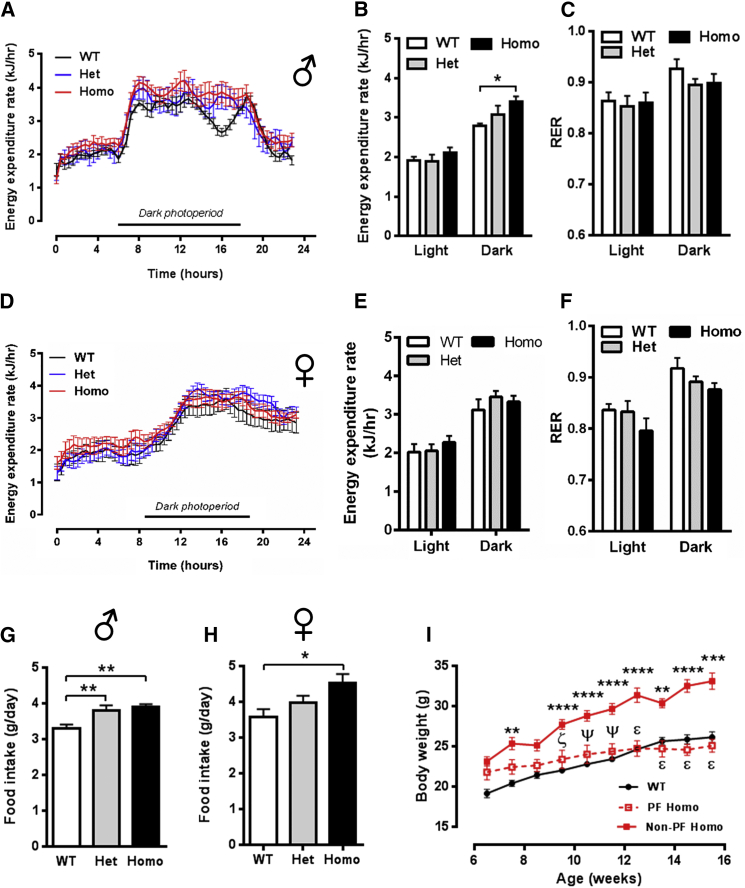
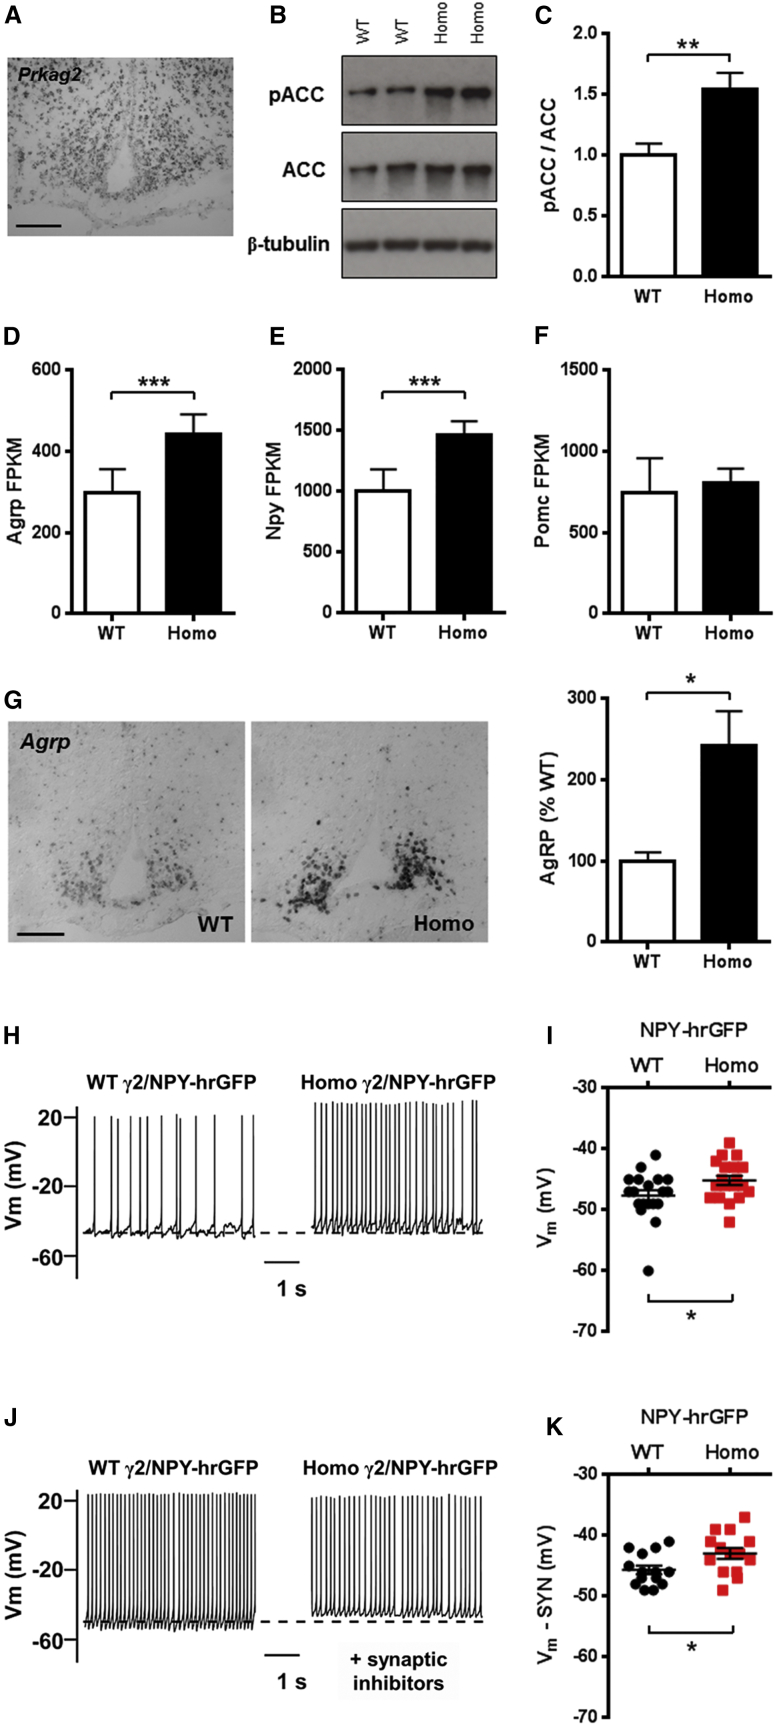
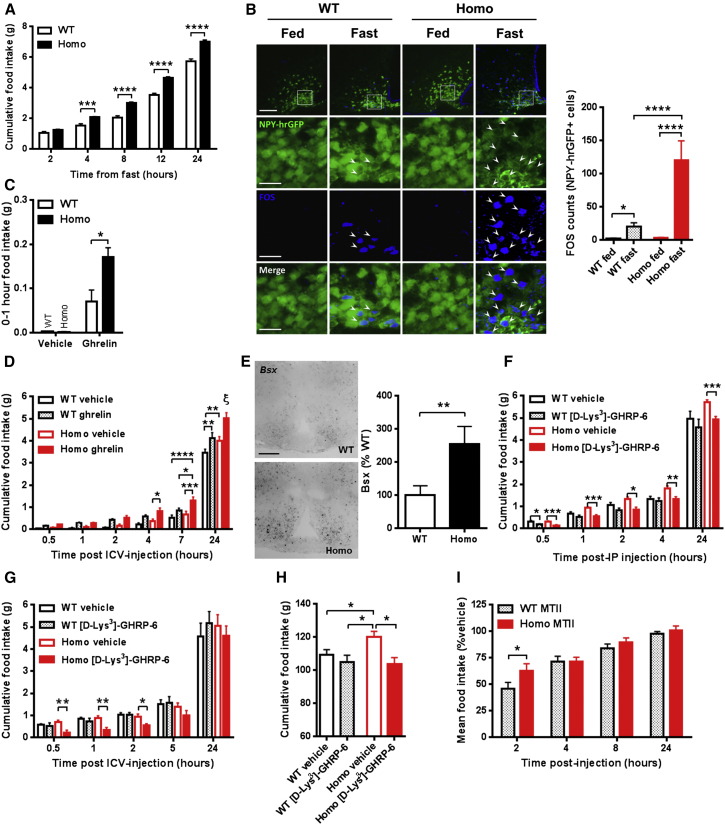
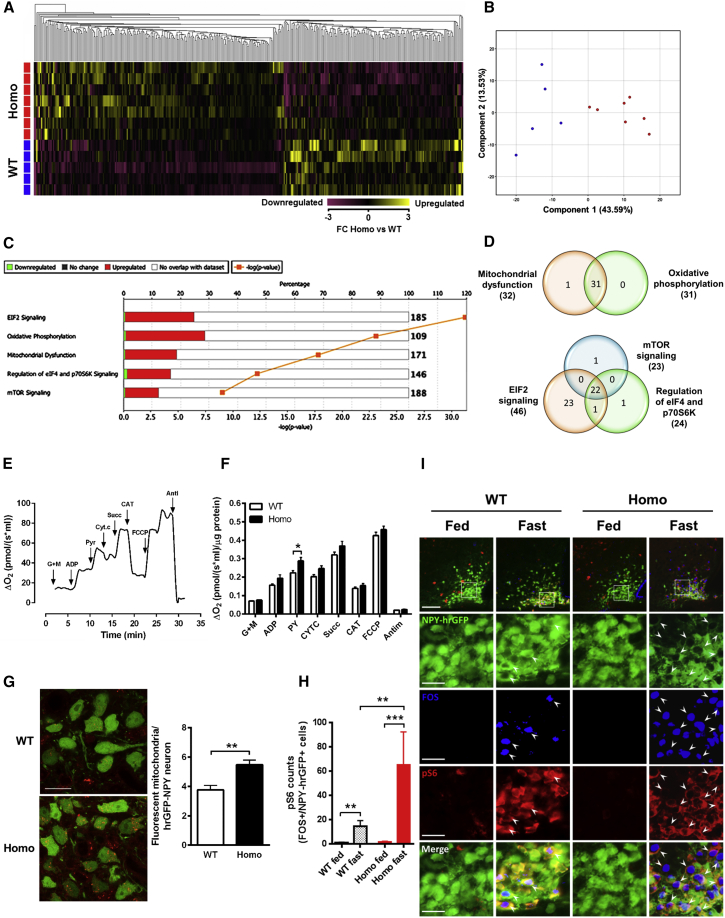
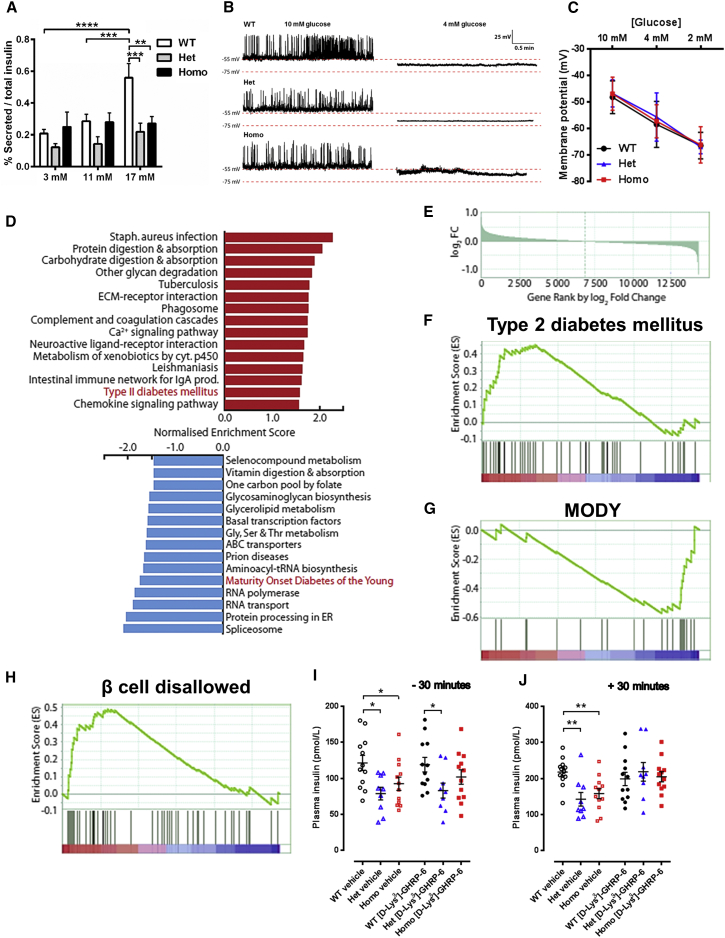
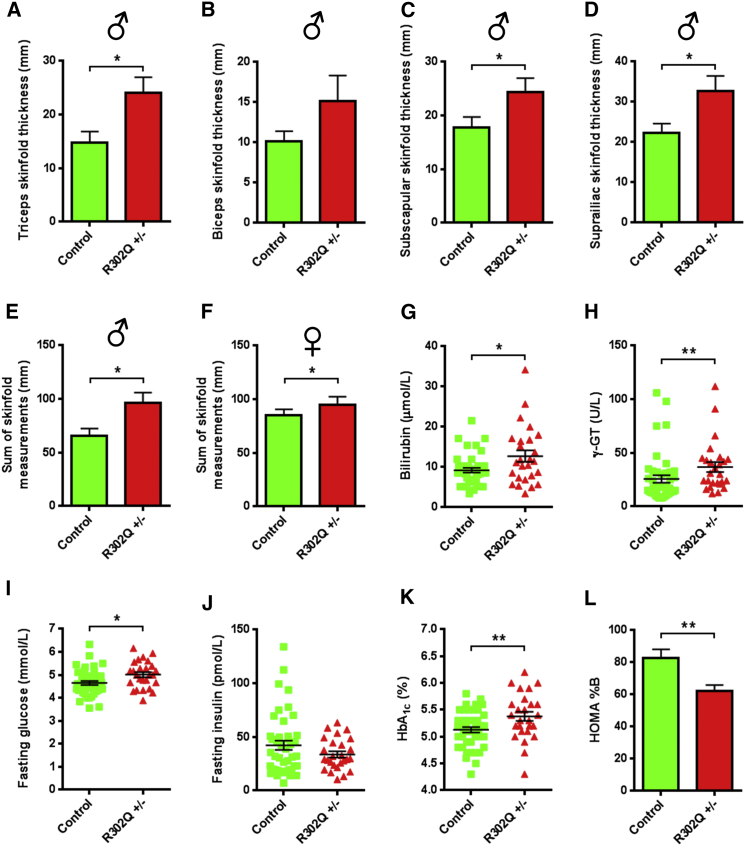
Despite significant advances in our understanding of the biology determining systemic energy homeostasis, the treatment of obesity remains a medical challenge. Activation of AMP-activated protein kinase (AMPK) has been proposed as an attractive strategy for the treatment of obesity and its complications. AMPK is a conserved, ubiquitously expressed, heterotrimeric serine/threonine kinase whose short-term activation has multiple beneficial metabolic effects. Whether these translate into long-term benefits for obesity and its complications is unknown. Here, we observe that mice with chronic AMPK activation, resulting from mutation of the AMPK γ2 subunit, exhibit ghrelin signaling-dependent hyperphagia, obesity, and impaired pancreatic islet insulin secretion. Humans bearing the homologous mutation manifest a congruent phenotype. Our studies highlight that long-term AMPK activation throughout all tissues can have adverse metabolic consequences, with implications for pharmacological strategies seeking to chronically activate AMPK systemically to treat metabolic disease.


Figures

None
Graphical abstract
Figure 1
Figure 1
R299Q γ2 AMPK Mice Develop Obesity (A) R299Q allelic discrimination plot from hepatic cDNA. (B and C) Isolated hepatocyte basal γ2-specific (B) and total (C) AMPK activity (n = 12). (D and E) Representative immunoblot (D) and quantitation (E) of total α AMPKThr172 phosphorylation from isolated hepatocytes (n = 3). (F) Male and female appearances aged 20 weeks. (G) Growth curves on normal chow diet (n = 7). (H) Total body fat mass at 4 and 40 weeks (n = 4–7). (I) Hepatic H&E staining and steatosis quantification from male mice aged 40 weeks (n = 5); magnification 100×. (J and K) Oral glucose tolerance and area (J) under the curve (AUC) for glucose (K) at 40 weeks (n = 9). (J) p < 0.05 versus WT. ∗∗p < 0.01 Het versus WT. ζ p < 0.001 Homo versus WT. (L and M) Insulin tolerance (L) and area above the curve (AAC) (M) for glucose at 40 weeks (n = 6). (L) p < 0.05 Het versus WT. ∗∗p < 0.01 Homo versus WT. ζ p < 0.01 Homo versus WT. NTC, non-template control. Data are mean ± SEM. p < 0.05. ∗∗p < 0.01. ∗∗∗p < 0.001. ∗∗∗∗p < 0.0001. See also Figures S1 and S2 and Table S1.
Figure 2
Figure 2
Energy Expenditure and Food Intake of R299Q γ2 AMPK Mice (A–F) Energy expenditure and respiratory exchange ratio (RER) in males (A–C, n = 5) and females (D–F, n = 7) at 6 weeks. (G and H) Food intake in male (G) and female (H) mice aged 8 weeks (male n = 11, female n = 4). (I) Effect on body weight of pair-feeding homozygous R299Q γ2 mice to WT food intake (n = 6–12). PF = pair fed. ∗∗p < 0.01 versus WT. ∗∗∗p < 0.001 versus WT. ∗∗∗∗p < 0.0001 versus WT. ζ p < 0.01 versus non-PF Homo. ψ p < 0.001 versus non-PF Homo. ε p < 0.0001 versus non-PF Homo. Data are mean ± SEM. p < 0.05. ∗∗p < 0.01. See also Figure S3.
Figure 3
Figure 3
Hypothalamic Expression of γ2 AMPK and Consequences of Its Activation on ARC Neuropeptide Expression and AGRP Neuron Electrophysiology (A) Expression pattern of Prkag2 in normal murine hypothalamus using digoxigenin ISH. Scale bar, 100 μm. (B and C) Representative immunoblot (B) and quantitation (C) of ACCSer79 phosphorylation in MBH (n = 6). (D–F) ARC gene expression of orexigenic (Agrp, D and Npy, E) and anorexigenic (Pomc, F) neuropeptides (n = 5). FPKM, fragments per kilobase per million mapped reads. (G) Hypothalamic Agrp expression by digoxigenin ISH and quantification (n = 4). Scale bar, 100 μm. (H–K) Current-clamp recordings from WT/NPY-hrGFP and homozygous R299Q γ2/NPY-hrGFP ARC neurons at baseline (H) and in the presence of fast synaptic inhibitors (J), together with Vm scatterplots (I and K) (n = 14). Action potential spike amplitudes truncated to demonstrate changes in Vm. Data are mean ± SEM. p < 0.05. ∗∗p < 0.01. ∗∗∗p < 0.001. See also Table S2.
Figure 4
Figure 4
Influence of Physiological and Hormonal Modulation on Food Intake in R299Q γ2 AMPK Mice (A) Cumulative food intake following overnight fast (n = 11). (B) Representative images and quantification of MBH FOS IR of WT/NPY-hrGFP and homozygous R299Q γ2/NPY-hrGFP mice in fed and fasted states (n = 3–6). Scale bar, 100 μm (top row) or 25 μm (lower rows). (C) Acute feeding response of mice aged 6 weeks to peripheral ghrelin (30 μg, i.p.) (n = 5). (D) Feeding response to 0.01 μg intracerebroventricular (i.c.v.) ghrelin (n = 7). ξ p < 0.0001 Homo ghrelin versus all other groups at 24 hr. (E) Hypothalamic Bsx expression by ISH and quantification (n = 4). Scale bar, 100 μm. (F) Effect of peripherally administered GHSR antagonist [D-Lys3]-GHRP-6 (200 nmol, i.p.) on food intake (n = 8). (G) Effect of central [D-Lys3]-GHRP-6 (1 nmol, i.c.v.) on food intake (n = 8). (H) Cumulative food intake after 4 weeks i.p. of [D-Lys3]-GHRP-6 (100 nmol twice daily) (n = 9–11). (I) Cumulative food intake following MT-II (1 mg/kg, i.p.) as percent of vehicle-treated mice of the same genotype (n = 12–13). Data are mean ± SEM. p < 0.05. ∗∗p < 0.01. ∗∗∗p < 0.001. ∗∗∗∗p < 0.0001. See also Figure S4.
Figure 5
Figure 5
ARC Transcriptome, Pathway Analysis, and Mediobasal Hypothalamic Mitochondrial Respiratory Activity in R299Q γ2 AMPK Mice (A) Hierarchical clustering and heat map visualization of differentially expressed genes (1.5-fold change, FC; 361 genes) from the ARC of ad libitum-fed male mice aged 8 weeks. (B) Principle component analysis plot indicating segregation of genotypes. (C) Top five canonical pathways in the ARC identified by pathway analysis. (D) Venn diagram illustrating gene overlap in (C). (E) Representative mitochondrial oxygen consumption trace from pooled mediobasal hypothalamic homogenates. Glutamate plus malate (GM), ADP, pyruvate (Pyr), cytochrome c (Cyt c), carboxyatractylozide (CAT), uncoupler (FCCP, carbonyl cyanide 4-(trifluoromethoxy)phenylhydrazone), and antimycin A (Anti) were given as indicated. (F) Effects of substrates on mediobasal hypothalamic mitochondrial oxygen consumption (n = 4–5 of 3 pooled mediobasal hypothalami). (G) In situ ROS generation detected by dihydroethidium (DHE) (red fluorescence) in arcuate NPY-hrGFP positive (green fluorescence) neurons of WT/NPY-hrGFP and homozygous R299Q γ2/NPY-hrGFP mice (n = 5–7 mice). Scale bar, 25 μm. (H and I) Quantification (H) and representative images (I) of MBH FOS and pS6 IR of NPY-hrGFP mice in fed and fasted state (n = 3–6). Scale bar, 100 μm (top row) or 25 μm (lower rows). Data are mean ± SEM. p < 0.05. ∗∗p < 0.01. ∗∗∗p < 0.001. See also Table S3.
Figure 6
Figure 6
Isolated Islet Insulin Secretion and Gene Expression Profile of R299Q γ2 AMPK Mice (A) Insulin secretion from isolated islets in response to variable glucose (n = 3). (B and C) Representative perforated patch-clamp recordings of the electrical (B) and membrane potential response (C) of isolated β cells to glucose level variation (n = 6). (D) Top 15 KEGG gene sets most significantly enriched for upregulated (red bar) and downregulated (blue bar) genes. Gene sets highly relevant to β cell function highlighted in red. (E) Plot of all measured genes ranked by log2 fold change in gene expression with those most upregulated in heterozygotes on the left. (F and G) Enrichment plots of gene sets relevant to β cell function. Clustering of genes (black vertical lines) at the left or right side indicate enrichment for upregulated genes in the T2DM gene set (F) and for downregulated genes in the maturity onset diabetes of the young (MODY) (G) gene set. (H) Enrichment plot of GSEA undertaken using a β cell disallowed gene set. (I and J) Baseline (−30 min, I) and stimulated (+30 min, J) plasma insulin level following glucose tolerance test in mice treated with 100 nmol [D-Lys3]-GHRP-6 i.p. twice daily (n = 9). Data are mean ± SEM. p < 0.05. ∗∗p < 0.01. ∗∗∗p < 0.001. ∗∗∗∗p < 0.0001. See also Figure S5.
Figure 7
Figure 7
Adiposity and Glucose Homeostasis of Human R302Q γ2 AMPK Mutation Carriers (A–D) Individual skinfold thickness measures of triceps (A), biceps (B), subscapular (C), and suprailiac (D) sites in male heterozygous R302Q carriers (R302Q ±, n = 13) and controls (n = 19). (E and F) Summated skinfold thickness measures for males (E) and females (F) (latter control n = 25, R302Q ±, n = 13). (G and H) Scatterplots of plasma bilirubin (G) and γ-glutamyl transferase (γ-GT) (H). (I–K) Scatterplots of fasting plasma glucose (I) and insulin (J), together with haemoglobin A1c (HbA1c) (K). (L) Homeostatic model assessment (HOMA) of basal β cell function (%B). Data are mean ± SEM. p < 0.05. ∗∗p < 0.01. See also Figure S6 and Table S4.

References

    1. Andersson U., Filipsson K., Abbott C.R., Woods A., Smith K., Bloom S.R., Carling D., Small C.J. AMP-activated protein kinase plays a role in the control of food intake. J. Biol. Chem. 2004;279:12005–12008. - PubMed
    1. Andrews Z.B., Liu Z.W., Walllingford N., Erion D.M., Borok E., Friedman J.M., Tschöp M.H., Shanabrough M., Cline G., Shulman G.I. UCP2 mediates ghrelin’s action on NPY/AgRP neurons by lowering free radicals. Nature. 2008;454:846–851. - PMC - PubMed
    1. Ashcroft F.M., Rorsman P. Diabetes mellitus and the β cell: the last ten years. Cell. 2012;148:1160–1171. - PMC - PubMed
    1. Ayala J.E., Bracy D.P., Malabanan C., James F.D., Ansari T., Fueger P.T., McGuinness O.P., Wasserman D.H. Hyperinsulinemic-euglycemic clamps in conscious, unrestrained mice. J. Vis. Exp. 2011 - PMC - PubMed
    1. Bauer U.E., Briss P.A., Goodman R.A., Bowman B.A. Prevention of chronic disease in the 21st century: elimination of the leading preventable causes of premature death and disability in the USA. Lancet. 2014;384:45–52. - PubMed

Publication types

MeSH terms