. 2016 May 10;23(5):909-20.
doi: 10.1016/j.cmet.2016.04.002. Epub 2016 Apr 28.

Age-Dependent Pancreatic Gene Regulation Reveals Mechanisms Governing Human β Cell Function

Affiliations

Age-Dependent Pancreatic Gene Regulation Reveals Mechanisms Governing Human β Cell Function

H Efsun Arda et al. Cell Metab. .

Abstract

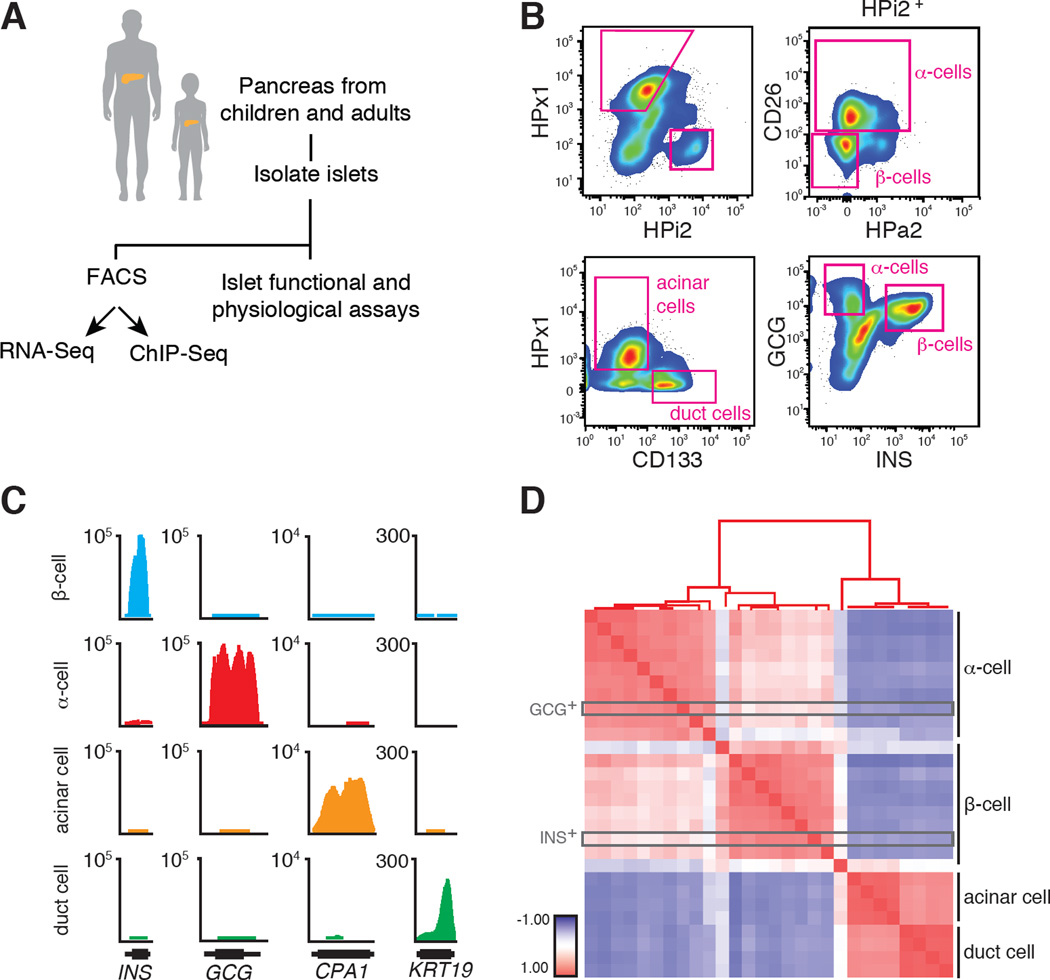
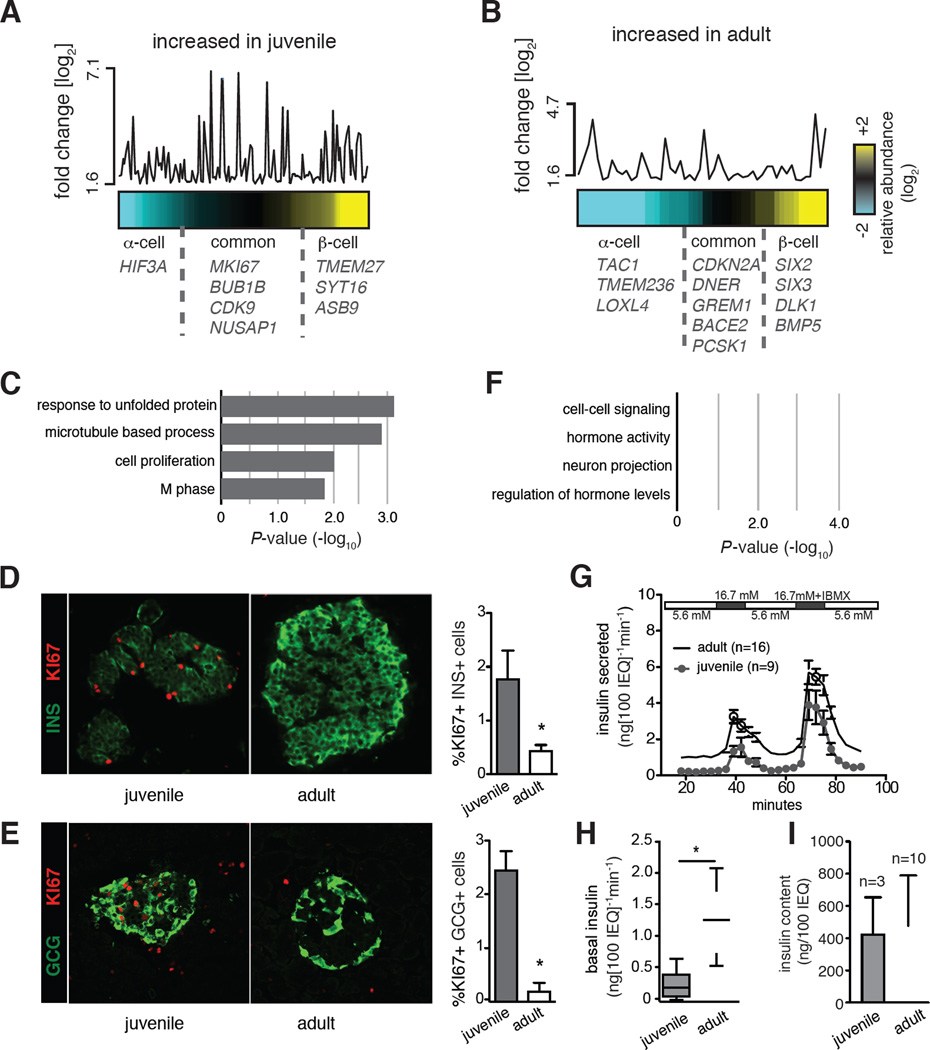
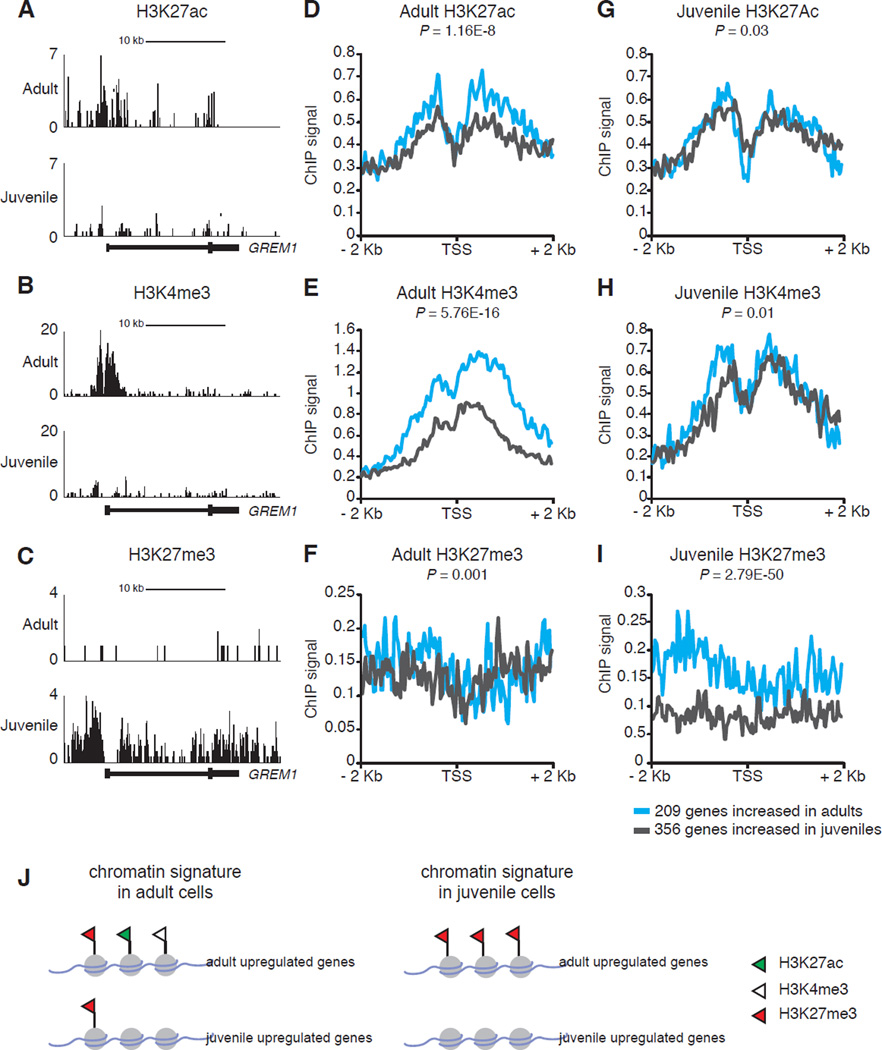
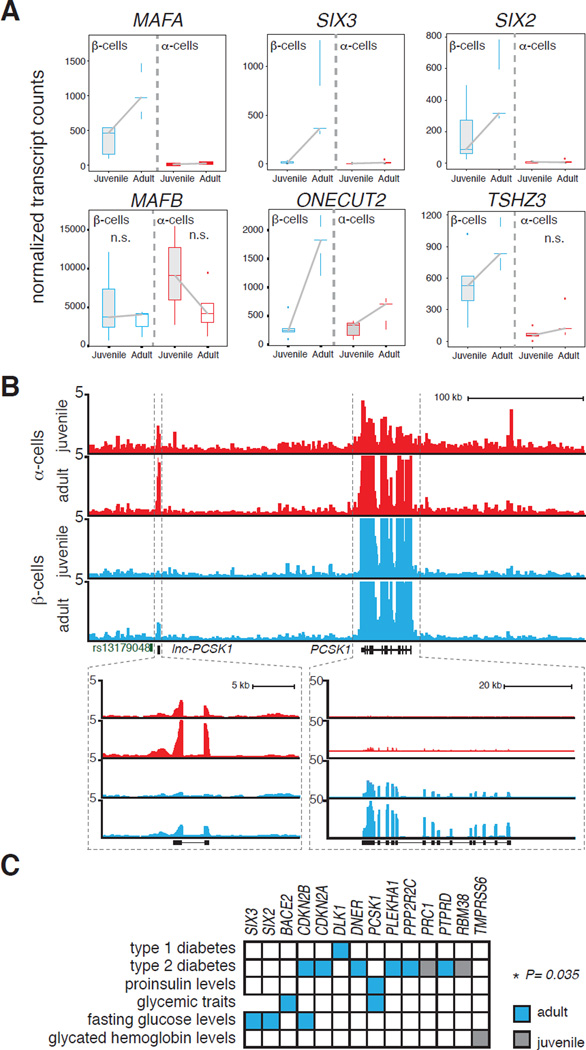
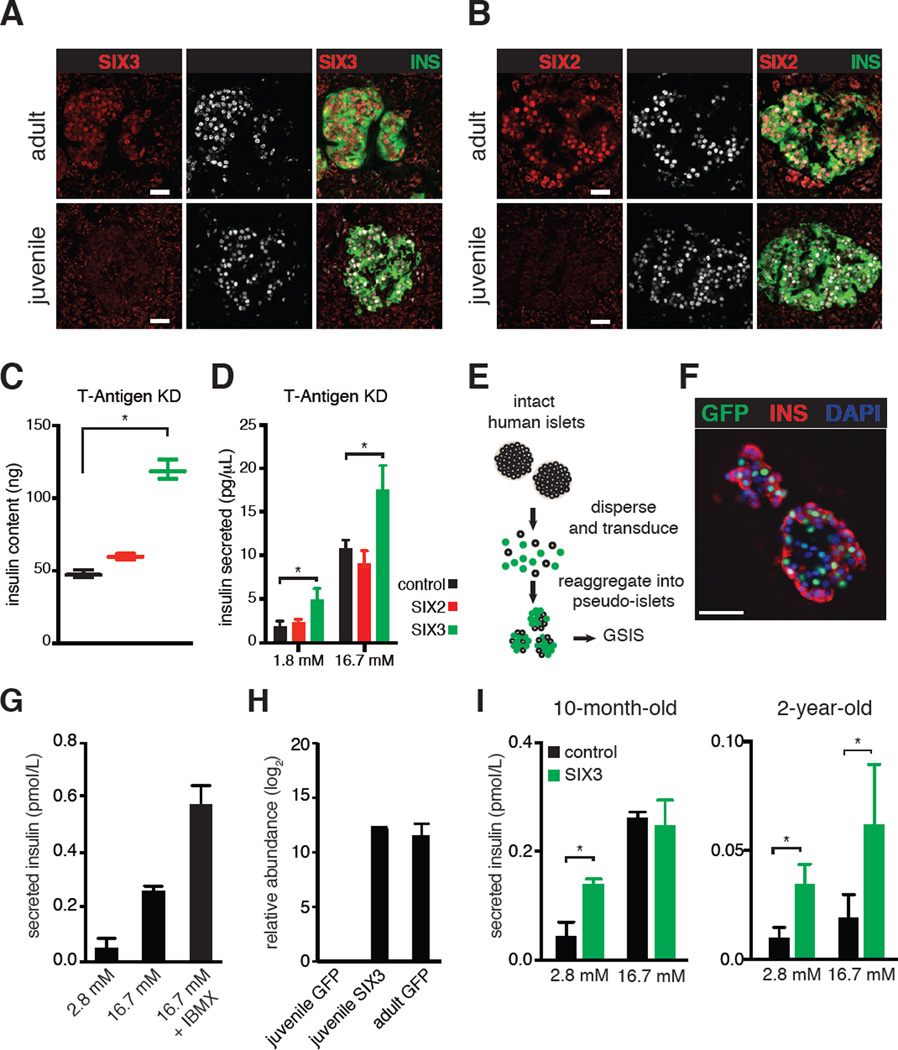
Intensive efforts are focused on identifying regulators of human pancreatic islet cell growth and maturation to accelerate development of therapies for diabetes. After birth, islet cell growth and function are dynamically regulated; however, establishing these age-dependent changes in humans has been challenging. Here, we describe a multimodal strategy for isolating pancreatic endocrine and exocrine cells from children and adults to identify age-dependent gene expression and chromatin changes on a genomic scale. These profiles revealed distinct proliferative and functional states of islet α cells or β cells and histone modifications underlying age-dependent gene expression changes. Expression of SIX2 and SIX3, transcription factors without prior known functions in the pancreas and linked to fasting hyperglycemia risk, increased with age specifically in human islet β cells. SIX2 and SIX3 were sufficient to enhance insulin content or secretion in immature β cells. Our work provides a unique resource to study human-specific regulators of islet cell maturation and function.


Figures

Figure 1
Figure 1. Cell purification approach to isolate native juvenile and adult islet cell subpopulations
(A) Schematic summary of this study design. (B) FACS plots showing the distribution of distinct pancreatic cell populations. (C) RNA-Seq tracks representing the enrichment of transcript reads in GCG, INS, CPA1 and KRT19 loci. Gene model (black, 5’ to 3’) excludes introns. (D) Pearson Correlation Coefficient matrix of all RNA-Seq samples used in this study. +1 indicates perfect correlation (red), 0 indicates no correlation (white), −1 indicates anti-correlation (blue). The positions of intracellular sorted juvenile samples are boxed in grey.
Figure 2
Figure 2. Age-dependent gene expression and functional changes in human islet cells
Heat maps representing the relative abundance of age-dependent genes increased either in juvenile (A) or adult (B) samples. The y-axis shows the fold change of expression between different age groups. Each point corresponds to an age-dependent gene and its position is aligned with the column position in the heat map. Age-dependent genes more abundant in β-cells are colored yellow, in α-cells colored cyan, equal abundance is represented in black. Names of select genes are indicated on the plots. For the full list, see Table S2. (c) GO Term enrichment analysis of genes increased in juvenile (C) or adult (F) samples. Top scoring biological process terms are graphed. Immunostaining for KI67 and (D) Insulin (INS) or (E) Glucagon (GCG) in juvenile (2-year-old) and adult (31-year-old) pancreatic sections. Quantifications on the right (* t-test P < 0.05). Error bars indicate S.D. (G) Dynamic GSIS results of perifused human juvenile (n=9) and adult (n=16) islets, IEQ: islet equivalent. (H) Box plots show secreted insulin levels of juvenile (n=9) and adult (n=16) islets in the last fraction exposed to 5.6 mM glucose (basal) before a step increase to 16.7 mM glucose. (I) Insulin content of equivalent numbers of juvenile (n=3) and adult islets (n=10). Also see Experimental Procedures (* t-test P<0.05; Error bars indicate S.E.).
Figure 3
Figure 3. Histone ChIP-seq maps reveal distinct modes of chromatin modifications associated with age-dependent genes in human islets
UCSC browser tracks showing (A) H3K27ac, (B) H3K4me3, (C) H3K27me3 normalized ChIP-Seq signal at the GREM1 locus. (D–I) Plots represent mean aggregate signal 2 kb upstream or downstream around the transcriptional start site (TSS) of age-dependent genes that are increased in adult (cyan lines, total of 209 genes) or juvenile samples (grey lines, total of 356 genes). For a complete list of genes see Table S2. Histone ChIP-Seq signals obtained from (D–F) 48-year-old adult donor, (G) 0.8-year-old and (H–I) 0.5-year-old juvenile donors. Wilcoxon rank sum test was used to calculate the P values. (J) Schematic depicting histone modifications found at genes expressed in an age-dependent manner in juvenile and adult islet samples.
Figure 4
Figure 4. Age-dependent islet genes are enriched for genes linked to diabetes and related metabolic traits
(A) Box plots displaying normalized transcript counts of TFs whose expression changes significantly with age (except for MAFB) in human α- or β-cells, (n=5 juvenile, n=5 adult). (B) RNA-Seq profiles of α- and β-cells from juvenile and adult samples highlighting the PCSK1 and lncPCSK1-1 locus. (C) Matrix indicating the overlap of age-dependent genes and GWAS genes linked to diabetes and associated metabolic traits (* Chi-square test with Yates' correction).
Figure 5
Figure 5. SIX3 and SIX2 increase with age specifically in human β-cells and enhance β-cell maturation
SIX3 (A) and SIX2 (B) immunostaining of adult (31-year-old) and juvenile (4-year-old) human pancreas sections, scale bar: 100 µm. Insulin content (C) and secreted insulin levels (D) of EndoC-βH1 cells expressing GFP, SIX2 or SIX3 without T-Antigen (T-Antigen KD). Asterisks indicate statistically significant results reproduced in multiple experimental replicates (P < 0.05, two-way ANOVA followed by Fisher’s Least Significant Difference test). Bars indicate S.D. (E) Schematic detailing pseudo-islet techniques. Human islet cells are enzymatically dispersed, and transduced with lentivirus which co-expresses a GFP transgene. 5–7 days after dispersion, islet cells spontaneously re-aggregate into pseudo-islet clusters can be assayed using glucose-stimulated insulin secretion (GSIS) in vitro. (F) Representative immunohistologic images of human pseudo-islets stained with Insulin, GFP or DAPI, scale bar: 50 µm. (G) Bar graphs show secreted insulin levels of cultured human pseudo-islets exposed to glucose or glucose +IBMX. Secreted insulin is normalized to total insulin content. (H) Bar graphs indicate relative abundance of SIX3 transcript detected in pseudo-islets after transduction with GFP or SIX3 lentiviral vectors. (I) Graphs show secreted insulin levels from cultured pseudo-islets obtained from juvenile donors, expressing GFP alone (control) or SIX3. Secreted insulin is normalized to total insulin content (* P < 0.05, t-test). Error bars indicate S.D.

References

    1. Aguayo-Mazzucato C, Koh A, El Khattabi I, Li W-C, Toschi E, Jermendy A, Juhl K, Mao K, Weir GC, Sharma A, et al. Mafa expression enhances glucose-responsive insulin secretion in neonatal rat beta cells. Diabetologia. 2011;54:583–593. - PMC - PubMed
    1. Anders S, Huber W. Differential expression analysis for sequence count data. Genome Biol. 2010;11:R106. - PMC - PubMed
    1. Arda HE, Benitez CM, Kim SK. Gene Regulatory Networks Governing Pancreas Development. Dev. Cell. 2013;25:5–13. - PMC - PubMed
    1. Artner I, Blanchi B, Raum JC, Guo M, Kaneko T, Cordes S, Sieweke M, Stein R. MafB is required for islet β cell maturation. Proc. Natl. Acad. Sci. 2007;104:3853–3858. - PMC - PubMed
    1. Artner I, Hang Y, Mazur M, Yamamoto T, Guo M, Lindner J, Magnuson MA, Stein R. MafA and MafB regulate genes critical to beta-cells in a unique temporal manner. Diabetes. 2010;59:2530–2539. - PMC - PubMed

Publication types