. 2016 May 18;90(4):839-52.
doi: 10.1016/j.neuron.2016.03.036. Epub 2016 Apr 28.

Network Homeostasis and State Dynamics of Neocortical Sleep

Affiliations

Network Homeostasis and State Dynamics of Neocortical Sleep

Brendon O Watson et al. Neuron. .

Abstract

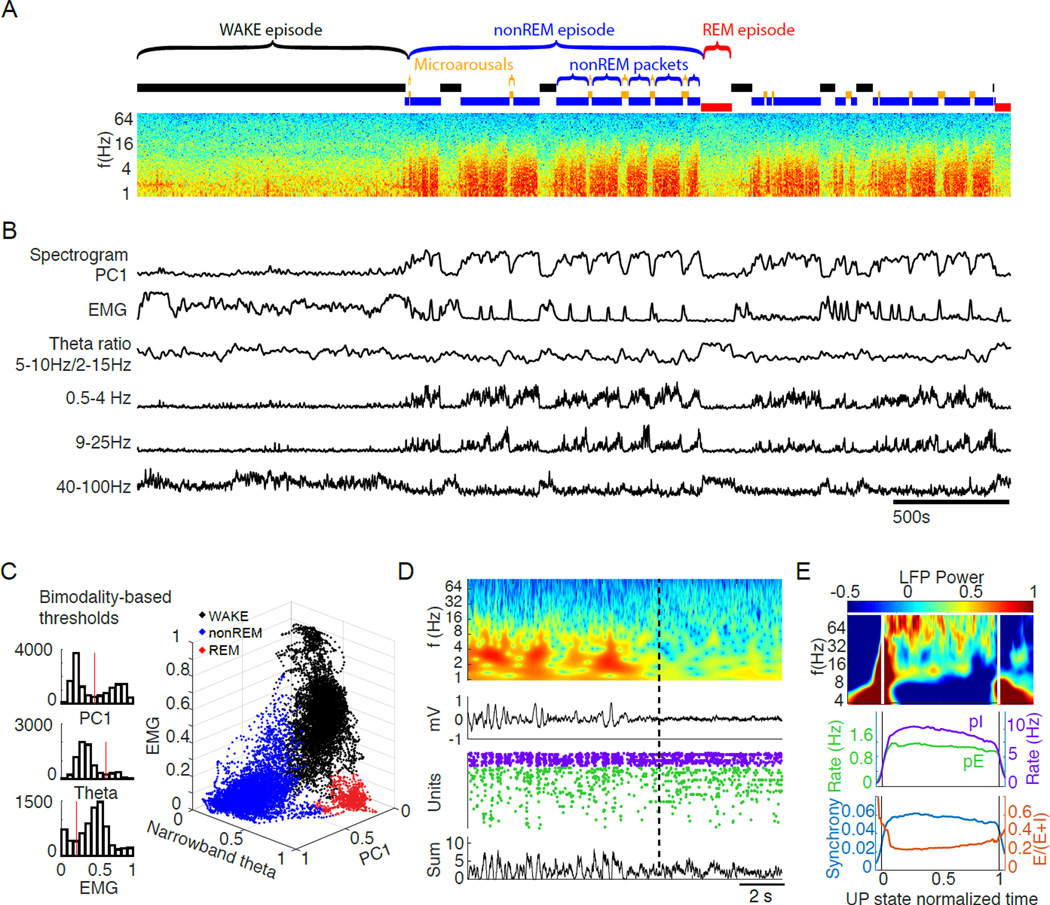
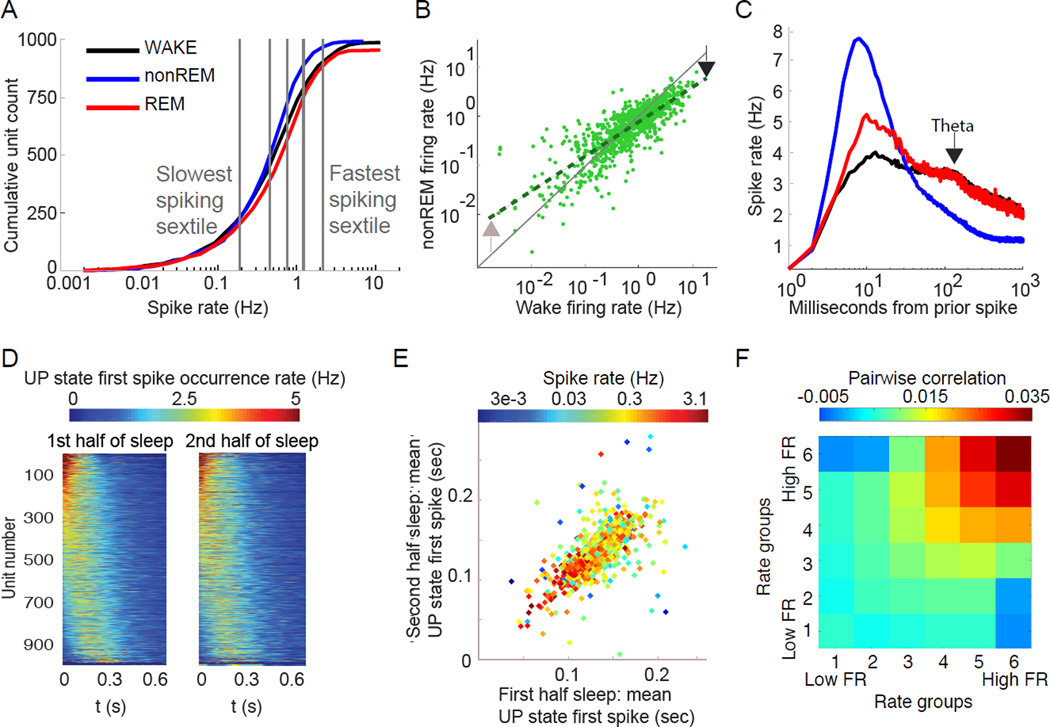
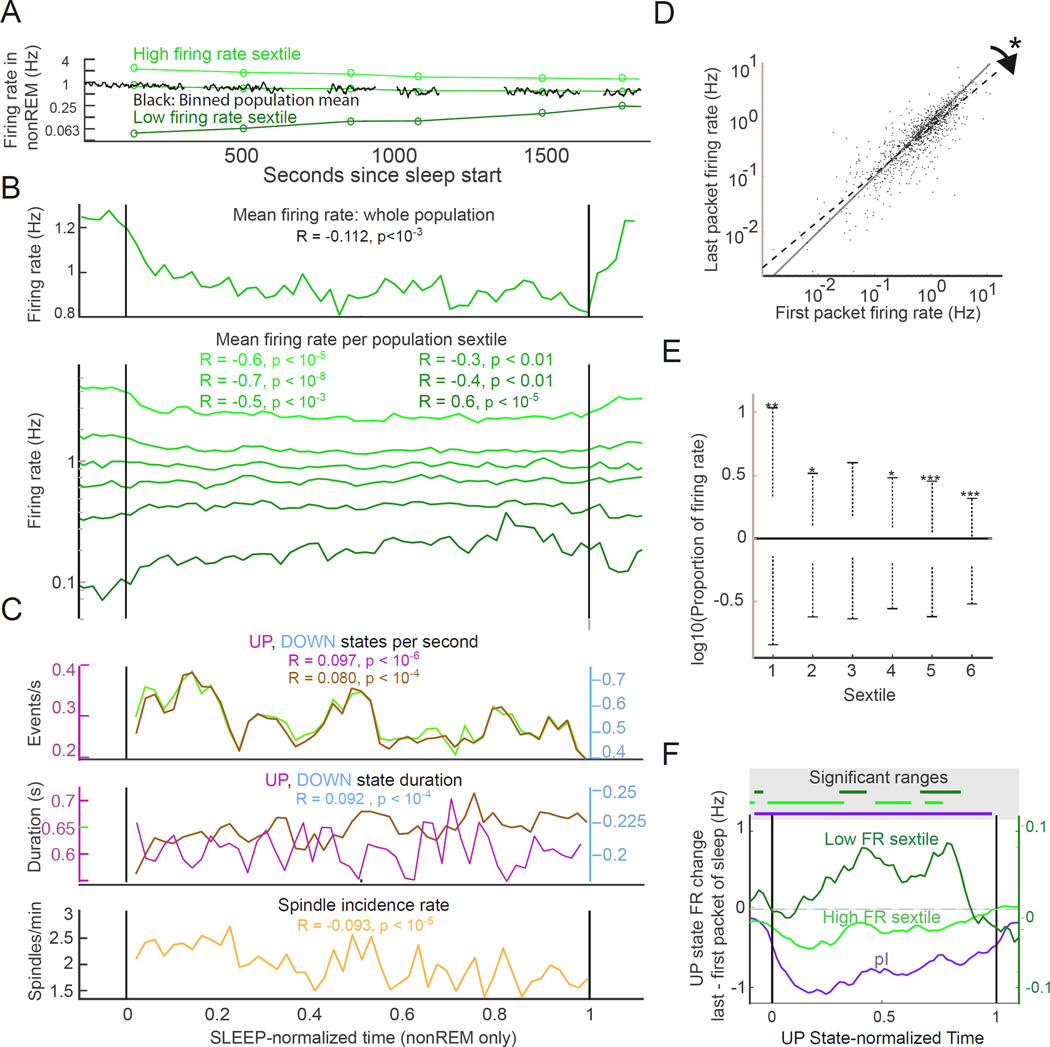
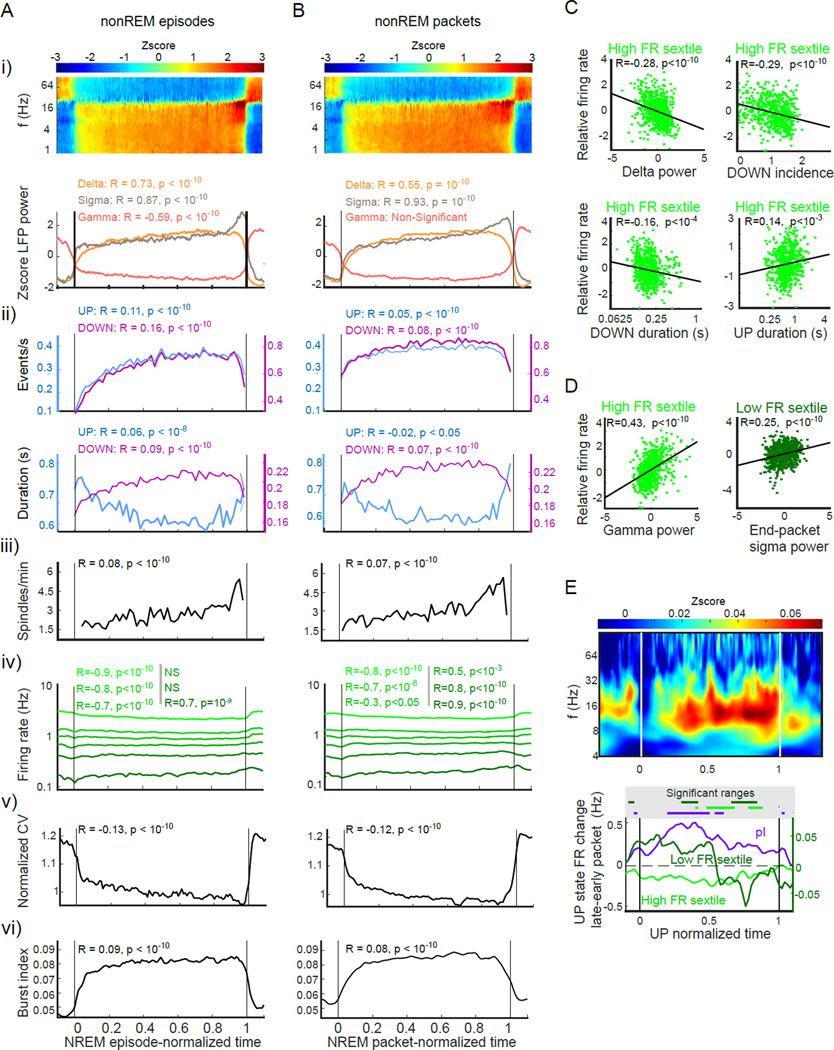
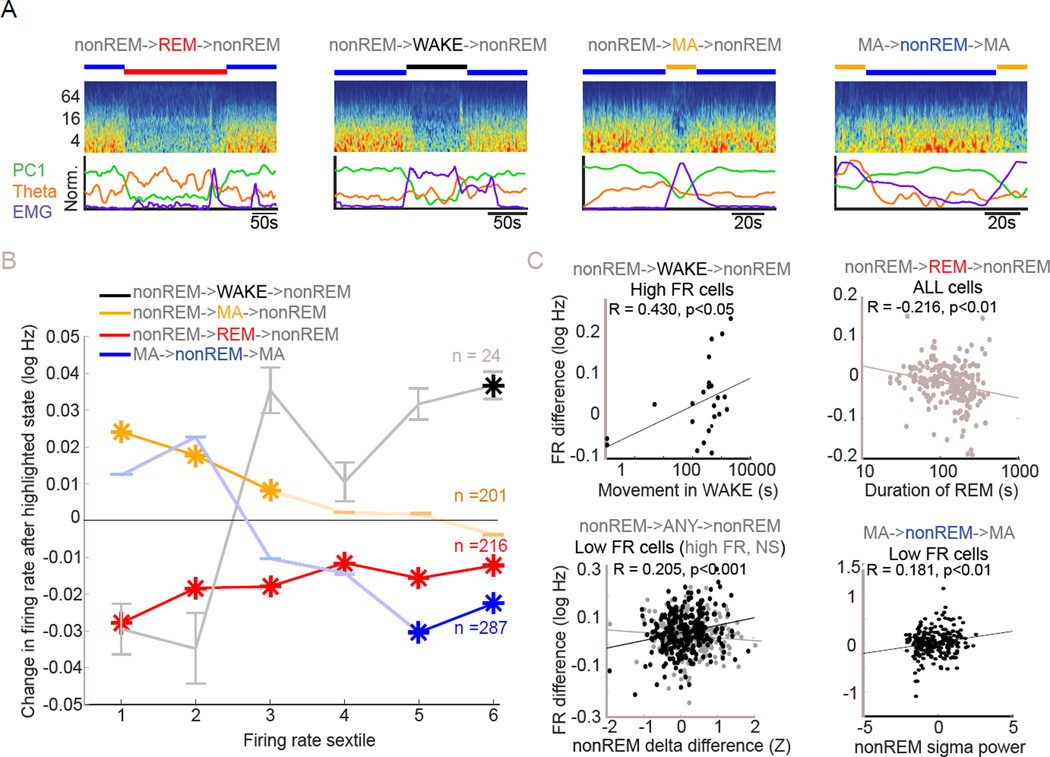
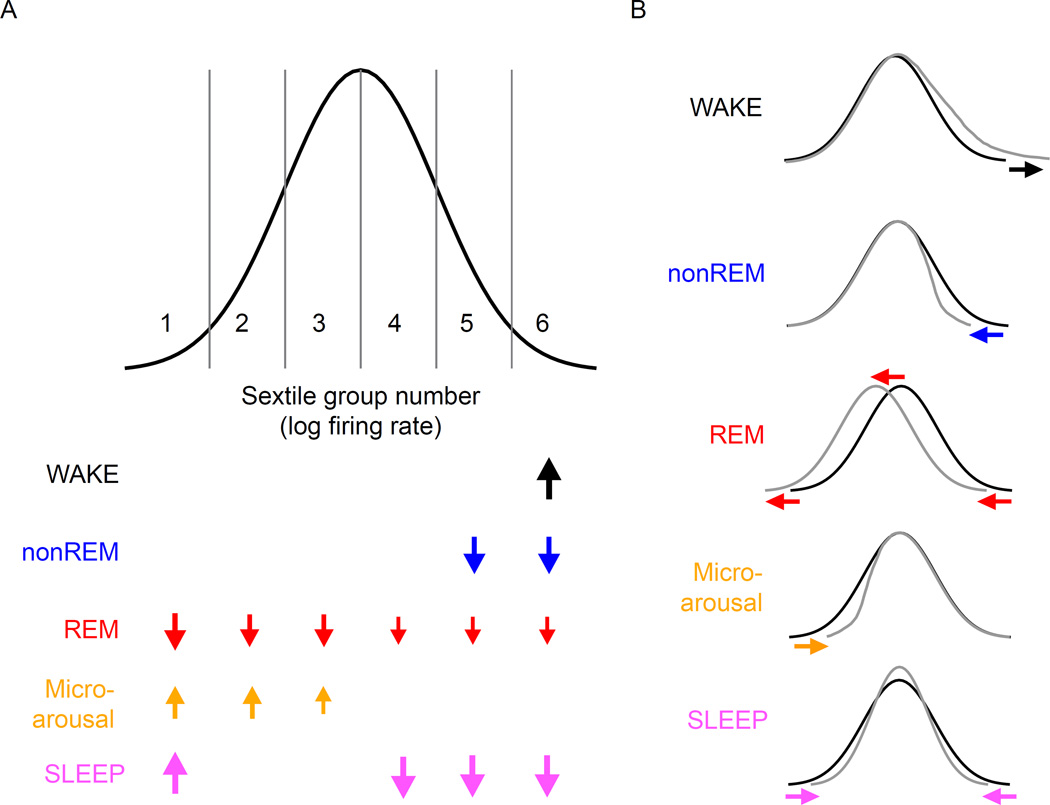
Sleep exerts many effects on mammalian forebrain networks, including homeostatic effects on both synaptic strengths and firing rates. We used large-scale recordings to examine the activity of neurons in the frontal cortex of rats and first observed that the distribution of pyramidal cell firing rates was wide and strongly skewed toward high firing rates. Moreover, neurons from different parts of that distribution were differentially modulated by sleep substates. Periods of nonREM sleep reduced the activity of high firing rate neurons and tended to upregulate firing of slow-firing neurons. By contrast, the effect of REM was to reduce firing rates across the entire rate spectrum. Microarousals, interspersed within nonREM epochs, increased firing rates of slow-firing neurons. The net result of sleep was to homogenize the firing rate distribution. These findings are at variance with current homeostatic models and provide a novel view of sleep in adjusting network excitability.


Figures

Figure 1
Figure 1. Classification of brain states
(A) Time-power analysis of cortical local field potentials (LFP). Time resolved fast Fourier transform-based power spectrum of the LFP recorded from one site of a 64–site silicon probe in layer 5 of the orbitofrontal cortex. Epochs generated by manually-approved automatic brain state segregation are shown above the spectrum. (B) Metrics extracted for state classification. The first principal component (PC1) of the LFP spectrogram segregated nonREM packets from ‘other’ epochs. Non-nonREM epochs with high theta power and low electromyogram (EMG) activity were designated as REM. Remaining epochs were termed either as WAKE (>40 sec) or microarousal (MA; < 40 sec; see Figure S1D and Results). Alternating epochs of nonREM packets and MAs comprise nonREM episodes. Integrated power in the delta (0.5 – 4 Hz), sigma (9 – 25 Hz) and gamma (40 – 100 Hz) bands over time are also shown. (C) State separation. Left: Bimodal distributions and threshold values (red vertical lines) of PC1, theta power and EMG, respectively. These were used for state segregation in the example session in A. Right: 3-dimensional plot showing the automatic state segregation. Each point corresponds to one second of recording time, with color indicating the identified state during that second as labeled. (D) Example state transition. Top two panels show time-resolved wavelet power spectrum and corresponding raw LFP across a nonREM-REM state transition. Concurrent spikes of putative interneurons (purple dots) and pyramidal cells (green) are shown. Below: summed spikes of all pyramidal cells. Note correspondence between silent periods of spike rasters (DOWN state) and large positive waves in the LFP. This change between intermittent activity and persistent activity differentiates nonREM from REM in the cortex and is also represented in PC1 of the LFP spectrogram. (E) Characterization of UP states within nonREM. See supplemental methods for details of identification algorithm. Top: average wavelet spectrum of LFP from UP states normalized in time for comparison (0 to 1). Middle: mean firing rates of the putative pyramidal cells and interneurons during normalized and averaged UP states from all sessions, all rats. Bottom, population synchrony of pyramidal cells (fraction of spiking neurons in 50 ms bins) and the ratio of the fraction of pyramidal cells and combined fraction of pyramidal cells and interneurons in 50 ms bins (E/E+I ratio) during normalized UP states from all sessions, all rats.
Figure 2
Figure 2. Cortical neuronal firing patterns in different states
(A) State-wise differences of average firing rate. Cumulative distribution of the firing rates of individual putative pyramidal neurons (log scale). Note brain state-dependent differences (color). Vertical lines separate equal number of neurons into 6 subgroups (sextiles) based on WAKE firing rate – used in later analyses. (B) Differential effect of brain state on neurons of different firing rates. Comparison of the firing rates (log scale) of the same pyramidal neurons during WAKE and nonREM – each point is the same neuron in two states. During nonREM neurons at the right end of the distribution are decreased, but neurons at the left end of the distribution increase their rates compared to WAKE (arrows). (C) Temporal relationships of spikes across brain states. Average single cell spike autocorrelogram shows largest peak at 8 ms during nonREM and small peaks at 125 ms (~8 Hz theta frequency) during REM and WAKE (arrow) and a fast decay of spiking especially in nonREM. (D) Spike-timing in UP states is consistent. Cell-wise histograms of time-resolved likelihood distribution of the first spike time fired by each pyramidal neuron across all DOWN-UP state transition (set to 0 ms) shown separately for the first and second halves of SLEEP episodes. Color represents the normalized firing likelihood for that unit. Each unit is a horizontal color line, vertically sorted identically in both columns by the mean onset time during the first half of SLEEP. (E) UP state spike timing correlates with cell firing rate. Comparison of the mean latency to the first spike of each neuron during the first and second halves of the recording session (same data as D). Note that faster firing neurons tend to fire at shorter latencies. (F) Firing rate predicts co-firing. Mean pairwise correlation of pairs of neurons in nonREM sleep based on 100 ms bins, separated into 6 firing rate groups based on mean rate. Note high correlations between high firing rate pairs of cells and negative correlation between slow and fast firing neuron pairs. All comparisons, except 4,4, are significant (see Supplementary Methods).
Figure 3
Figure 3. Firing pattern changes over the course of SLEEP
(A) Example of opposite modulation of firing rate over sleep. Population mean firing rates (black traces), and mean packet firing rate for the fastest and lowest firing sextiles (green circles) of pyramidal neurons in an example session. Only nonREM packets are shown for clarity. High firing rate cells show downregulation over sleep, low firing rate cells increase firing over sleep. (B) Firing rate changes across sleep. Top panel, population arithmetic mean firing rate. R, slope of the rate change within time-normalized sleep from all neurons in all recordings (n = 995 cells; n = 54 sessions; 11 rats). Bottom panel, firing rate changes in each of six groups defined by WAKE firing rate (see figure 2A), all cells all sessions. R and p values for correlations of each mean firing rate versus normalized time shown in colors corresponding to plot for each sextile. Measures are per restricted to nonREM, therefore changes are not due to relative ratios of nonREM to REM/MA. High firing rate neurons show decreasing activity, low firing rate cells increase activity over sleep. (C) Slow oscillations and spindles over SLEEP. UP and DOWN state occurrence rates (top) and UP and DOWN state durations (middle) within SLEEP. Bottom, spindle incidence. UP state duration not significantly correlated with time, all other significances shown including decreasing UP, DOWN and spindle occurrence rates. All values are restricted to nonREM times to control for state changes over sleep. (D) Opposite modulation of neurons of different firing rates. Comparison of individual neuron firing rates during the first and last packets of SLEEP. The regression line is significantly different from unity (slope 95% confidence interval 0.83–0.88) showing that high and low firing rate neurons are oppositely modulated over sleep. (E) Firing rate changes from SLEEP persist into subsequent WAKE. Comparison of sextile-wise firing rates during the 5 minutes of WAKE before versus the 5 minutes of WAKE after SLEEP. Asterisks above bars indicate significance of one-tailed Wilcoxon: *: p < 0.005, **:p < 0.001,***:p < 0.0001. (F) Within-UP state firing rate changes across SLEEP. Lines correspond to the difference of UP state values of last versus first packets of SLEEP. Putative interneurons (pI) and excitatory cells (pE) from the fastest sextile showed a rate decrease, whereas the slowest sextile (right Y axis) showed an increase over SLEEP. We also show time-resolved changes across the span of the average UP state (0 to 1 on abcissa).
Figure 4
Figure 4. Comparison of changes within nonREM episodes and nonREM packets
Comparisons of metrics across (A) time-normalized nonREM episodes (B) time-normalized nonREM packets. All R and p values of metrics versus normalized time are displayed above data. i) Time-normalized spectrogram (top) and evolution of delta (1–4Hz), sigma (9–25Hz) and gamma (40–100Hz) power (bottom) within nonREM episodes and packets. ii) Evolution of UP and DOWN state incidence and duration iii) Spindle incidence iv) Firing rate changes in the sextile groups v) Coefficient of variation of within-session population firing rates vi) Incidence of spike bursts (fraction of spikes with <15 ms intervals) (C) Correlation between packet delta oscillation parameters and within-nonREM packet firing rate. High firing rate neurons show significant negative correlations with slow-wave metrics with the exception of a positive correlation with UP state duration. Low firing rate neurons do not show significant correlations. (D) Sigma and gamma band correlates of firing rate. Gamma power in packets correlates with higher firing rate in high-rate cells. Low firing rate neurons fire more in packets with higher sigma-band power at the end of the packet. (E) Within-UP state changes across nonREM packets. Top: subtraction of spectrogram from last third of packets from that of first third of packets. Note increased spindle power at the end of nonREM packet, which is present throughout UP state duration. Bottom: Spike rate changes from first to last thirds of packets of the top and bottom sextiles of putative excitatory (pE) units and putative inhibitory (pI) units. Note that pI units increased their within-UP state firing later in packets, whereas the fastest sextile of pyramidal cells decreased their rates.
Figure 5
Figure 5. Persisting effects of WAKE, REM sleep and MA on firing rates
(A) Examples of state triplets involving two iterations of a state spanning an intervening state. Scored states are indicated above time-resolved FFT spectrum of the LFP for each example. Below spectrograms are shown the PC1 power, EMG power and theta power metrics used in state scoring. (B) Persisting rate changes across state triplets. Black, red and yellow plots show firing rate changes in the sextile groups between nonREMn and nonREMn+1 epochs respectively spanning WAKE, REM or MA states. Changes from subtraction of average per-cell firing rate in nonREMn from nonREMn are plotted for each firing rate sextile and are attributed to effects of the intervening state. Asterisks indicate significant change. Also shown are the firing rate changes between MAn+1 and MAn brought about by intervening nonREM state. Noted are n’s for each class of triplet, error bars represent SEM for all points. While WAKE brings up spiking of high firing rate cells, nonREM brings down the firing rate of that group. MAs elevate spiking of low firing rate cells and REM reduces spike rates across the firing rate spectrum. (C) Correlates of rate change magnitudes across state triplets. Upper left: Degree of movement within inter-packet WAKE correlates with degree of rate increase in the highest firing rate sextile group. Upper right: Duration of inter-packet REM correlates with degree of firing rate drop across all cells. Lower left: Difference in delta power between consecutive packets (calculated as within-session normalized delta power), regardless of intervening state correlates positively with degree of spike rate change in the lowest firing rate sextile. Same finding not replicated in highest firing rate sextile. Lower right: Sigma band power in the last 20 seconds of a packet between two MAs correlates with the increase in firing of the lowest firing rate sextile group from one MA to the next.
Figure 6
Figure 6. Effects of brain states on neural firing rates
Idealized distribution of the log firing rates of cortical neurons, divided into 6 sextiles to match our analyses here. Arrow size indicates the magnitude of the observed significant effects on firing rate of WAKE, nonREM, REM and microarousal (MA) states on subsequent states, based on numbers from Figure 5B. In addition, the rate changes brought about by SLEEP relative to WAKE are also shown (bottom), based on numbers from Figure 3E. Note that the overall effect of SLEEP is mimicked by the combination of the contributions of multiple sub-states of sleep. Right panels illustrate the impact of brain states (color-coded) on the idealized distribution of population firing rates.

References

    1. Avramescu S, Timofeev I. Synaptic strength modulation after cortical trauma: a role in epileptogenesis. J. Neurosci. 2008;28:6760–6772. - PMC - PubMed
    1. Axmacher N, Mormann F, Fernández G, Elger CE, Fell J. Memory formation by neuronal synchronization. Brain Res. Rev. 2006;52:170–182. - PubMed
    1. Bergmann BM, Winter JB, Rosenberg RS, Rechtschaffen A. NREM sleep with low-voltage EEG in the rat. Sleep. 1987;10:1–11. - PubMed
    1. Besedovsky L, Lange T, Born J. Sleep and immune function. Pflugers Arch. 2012;463:121–137. - PMC - PubMed
    1. Bienenstock EL, Cooper LN, Munro PW. Theory for the development of neuron selectivity: orientation specificity and binocular interaction in visual cortex. J. Neurosci. 1982;2:32–48. - PMC - PubMed

Publication types

LinkOut - more resources