. 2016 May 18;90(4):795-809.
doi: 10.1016/j.neuron.2016.03.034. Epub 2016 Apr 28.

Cannabinoid Type 2 Receptors Mediate a Cell Type-Specific Plasticity in the Hippocampus

Affiliations

Cannabinoid Type 2 Receptors Mediate a Cell Type-Specific Plasticity in the Hippocampus

A Vanessa Stempel et al. Neuron. .

Abstract

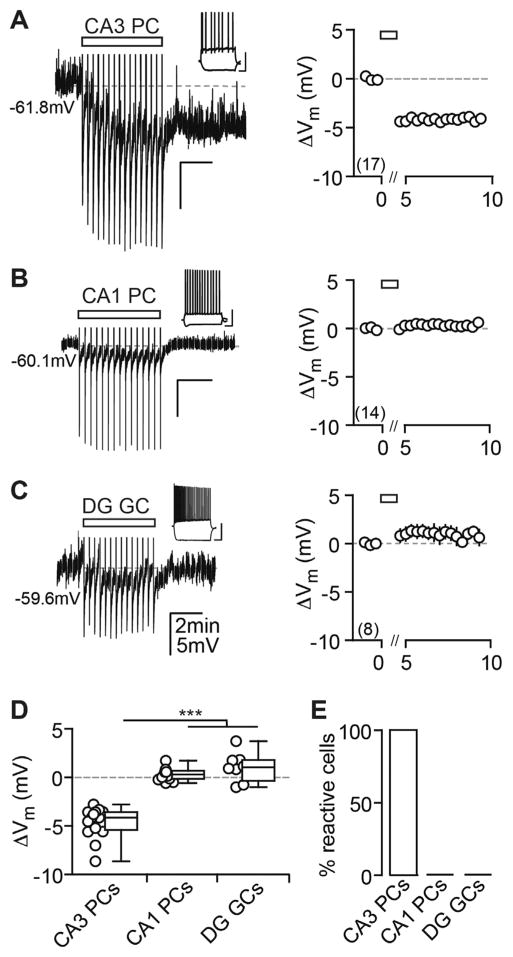
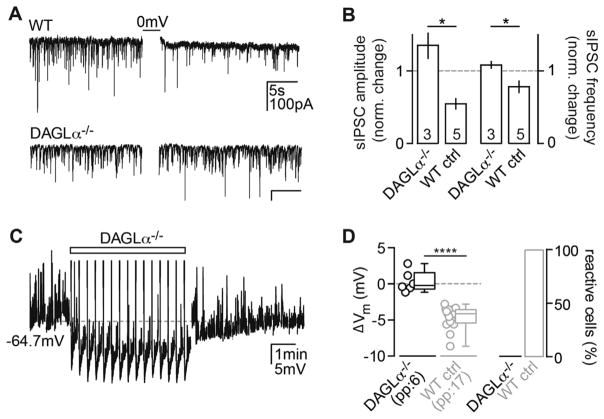
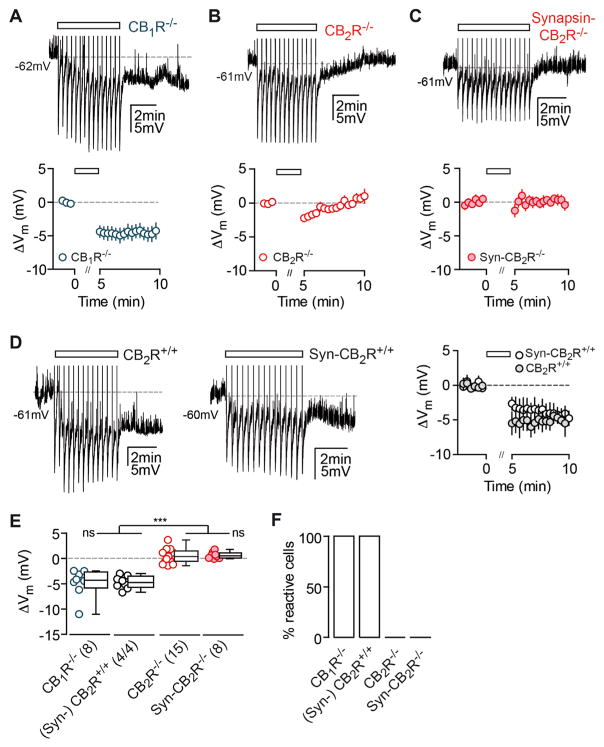
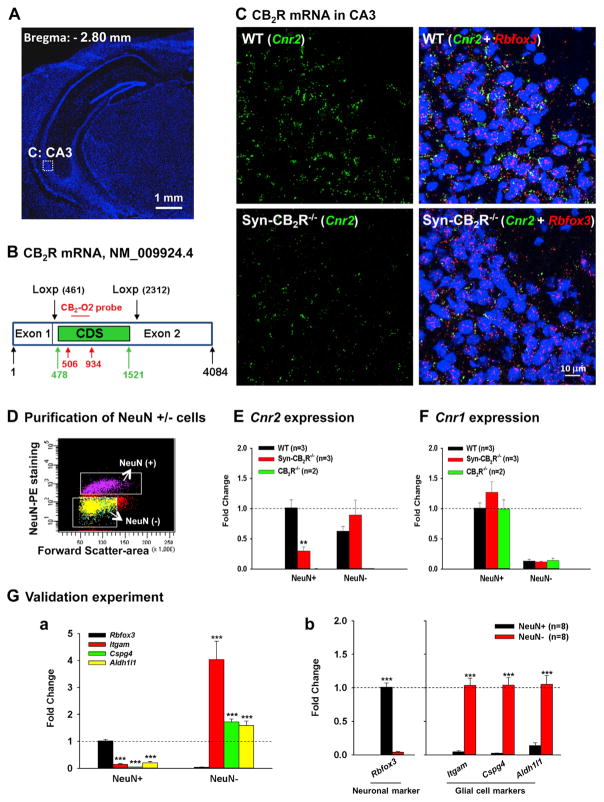
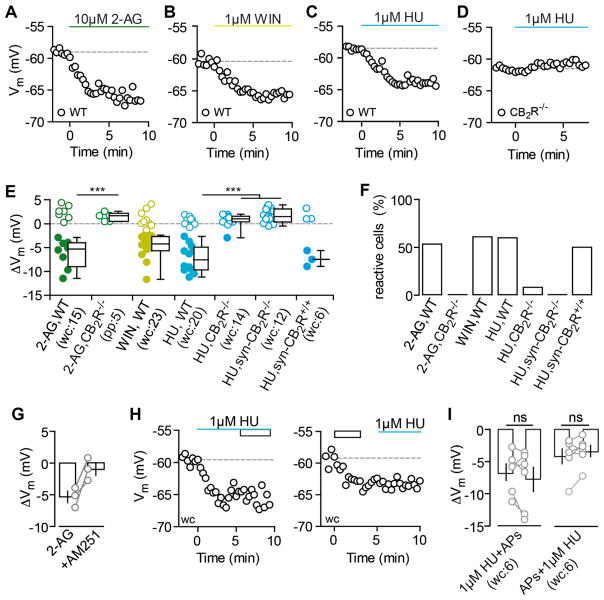
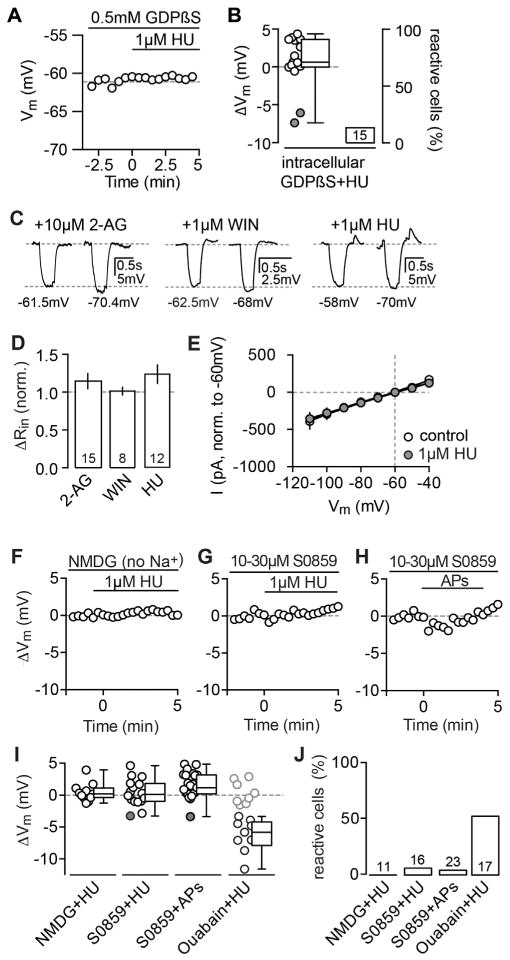
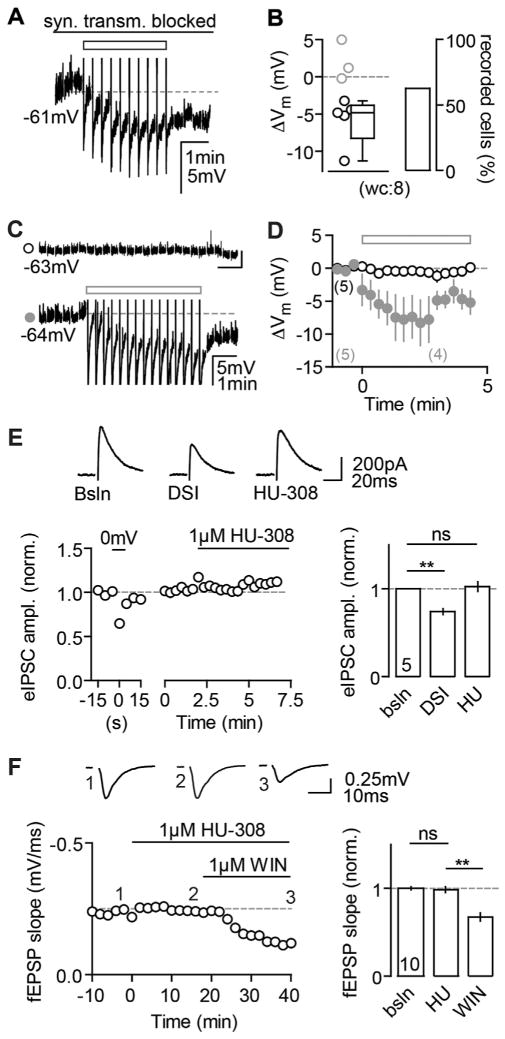
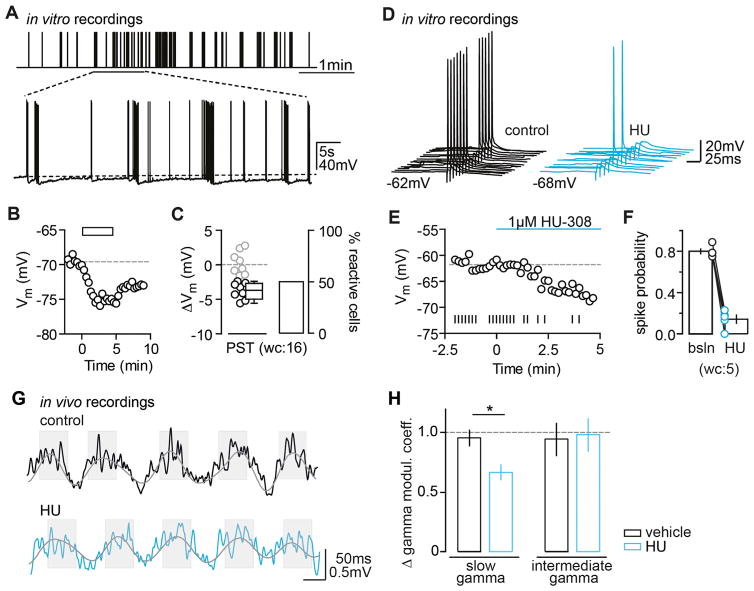
Endocannabinoids (eCBs) exert major control over neuronal activity by activating cannabinoid receptors (CBRs). The functionality of the eCB system is primarily ascribed to the well-documented retrograde activation of presynaptic CB1Rs. We find that action potential-driven eCB release leads to a long-lasting membrane potential hyperpolarization in hippocampal principal cells that is independent of CB1Rs. The hyperpolarization, which is specific to CA3 and CA2 pyramidal cells (PCs), depends on the activation of neuronal CB2Rs, as shown by a combined pharmacogenetic and immunohistochemical approach. Upon activation, they modulate the activity of the sodium-bicarbonate co-transporter, leading to a hyperpolarization of the neuron. CB2R activation occurred in a purely self-regulatory manner, robustly altered the input/output function of CA3 PCs, and modulated gamma oscillations in vivo. To conclude, we describe a cell type-specific plasticity mechanism in the hippocampus that provides evidence for the neuronal expression of CB2Rs and emphasizes their importance in basic neuronal transmission.


Figures

Figure 1
Figure 1. AP Firing Induces a Cell Type-Specific Vm Hyperpolarization in Hippocampal Principal Cells
(A–C) Current injection-triggered AP trains (rectangle) induce a long-lasting Vm hyperpolarization in CA3 PCs (A), but not in CA1 PCs (B) and DG GCs (C). Left: exemplary pp recordings of each principal cell population are shown. APs have been truncated and test pulses cut for display purposes in this and all later figures. Insets: firing patterns are shown (scale bar, 40 mV, 0.2 s). Right: summary time course shows the ΔVm average for CA3 PCs: n(N) = 17(13), CA1 PCs: n(N) = 14(4), and DG GCs: n(N) = 8(4). The x axis is discontinued for the duration of the AP train. (D) The ΔVm of each recorded cell (circles) and the median and 25th and 75th percentiles of the average ΔVm calculated from the first minute after the last AP train are shown for CA3 PCs (−4.1, −5.4, and −3.6 mV), CA1 PCs (0.30, −0.15 to 0.68 mV) and DG GCs (1.04, −0.35 to 1.8 mV). Kruskal-Wallis with Dunn’s post-test, p < 0.05 for CA3 PCs versus CA1 PCs and DG GCs. (E) Percentage (%) of reactive cells is shown.
Figure 2
Figure 2. The eCB 2-AG Mediates the Hyperpolarization
(A) As a control, sIPSCs were recorded from WT and DAGLα−/− CA3 PCs to test for the presence of DSI. In contrast to a DSI+ WT CA3 PC (upper trace), depolarization of a DAGLα−/− CA3 PC (0 mV for 3 × 1 s) failed to induce DSI (lower trace). (B) The normalized change in amplitude (left) and frequency (right) of sIPSCs in DAGLα−/− CA3 PCs (n(N) = 3(1): 1.4 ± 0.17 and 1.2 ± 0.05) differed significantly from WT controls (n(N) = 5(1)), 0.55 ± 0.1 and 0.78 ± 0.1, Mann-Whitney test, p = 0.036). The absolute sIPSC amplitude and frequency after DSI induction in the DAGLα KO do not differ from baseline (Wilcoxon test, p = 0.25). (C) Example Vm response of a DAGLα−/− CA3 PC to the AP stimulus (rectangle) is shown. (D) Left: the ΔVm of each recorded cell (circles) and the median and 25th and 75th percentiles of the average ΔVm are shown for n(N) = 6(3) experiments in pp (−0.2, −0.7, and 1.5 mV; Wilcoxon test, p = 0.84 in comparison to baseline). Right: Percentage of reactive cells is shown. For statistical comparison, the Vm values from WT CA3 PCs (Figure 1) are re-plotted in gray (Mann Whitney test, p < 0.0001).
Figure 3
Figure 3. The Long-Lasting Hyperpolarization Is Absent in CB2R-Deficient Mice
(A–C) AP trains (rectangle) induce a long-lasting hyperpolarization in CB1R−/− CA3 PCs (A), but not in CA3 PCs of CB2R−/− (B) and Syn-CB2R−/− mice (C). Left: exemplary pp recordings of KO CA3 PCs are shown. Right: summary time course shows the average ΔVm of CA3 PCs recorded from CB1R−/−: n(N) = 8(6), CB2R−/−: n(N) = 15(7), and Syn- CB2R−/−: n(N) = 8(5). The x axis is discontinued for the duration of the AP train. (D) Same is shown as for (A)–(C) except for WT littermate controls of CB2R−/− and Syn-CB2R−/− mice: n(N) = 4(3)/4(2). (E) The ΔVm of each recorded cell (circles) and the median and 25th and 75th percentiles of the average ΔVm (min 9–10) are shown for CA3 PCs recorded in CB1R−/− (−4.3, −5.8, and −2.6 mV), (Syn-)CB2R+/+ littermates (−4.7, −5.8 to −3.5 mV), CB2R−/− (0.39, −0.57 to 1.4 mV), and Syn- CB2R−/− (0.53, 0.086 to 1.1 mV). Kruskal-Wallis with Dunn’s post test, p < 0.0001 for [WT and CB1R−/−] versus [CB2R−/− and Syn-CB2R−/−]. The average ΔVm of WT versus CB1R−/− and CB2R−/− versus Syn-CB2R−/− did not differ significantly. (F) Percentage of reactive cells are shown.
Figure 4
Figure 4. Neuronal CB2R mRNA Expression in the Hippocampus by RNAscope ISH and FACS-qPCR Assays
(A) Hippocampal image (DAPI staining) illustrates the target region (CA3) in (C). (B) The CB2R mRNA structure in CB2R-floxed mice and the target gene region of a CB2R RNAscope probe (CB2-O2, 506–934 bp) used to detect CB2R mRNA. The CB2-O2 probe targets the floxed region of mouse CB2R mRNA (NM_009924.4) in CB2R-floxed mice. CDS, (CB2R)-coding DNA sequence (478–1,521 bp). (C) CB2R mRNA staining illustrates significant CB2R (Cnr2, green) and NeuN (Rbfox, red) mRNA co-localization in WT hippocampal CA3 neurons (upper panels), while such co-localization is substantially diminished in Syn-CB2R−/− (lower panels). (D) A representative image shows FACS-sorted NeuN+ neurons and NeuN− non-neuronal cells in the hippocampus. (E) The qPCR assays show that CB2R mRNA is detected mainly in NeuN+ hippocampal cells of WT mice, while the CB2R mRNA in NeuN+ hippocampal cells in Syn-CB2R−/− mice was substantially reduced (~70% reduction), and abolished in the CB2R−/− mice. (F) The qPCR assays for CB1R mRNA (as controls) in the same samples demonstrate similar levels of CB1R mRNA expression in NeuN+ neurons and NeuN− cells in WT, Syn-CB2R−/−, and const. CB2R−/− mice. (G) The qPCR assay results of neuronal and glial markers in two cell populations to examine the purity of sorted cells, illustrating that Rbfox3 was detected mainly in FACS-sorted NeuN+ neurons (a), but not in NeuN− cells (b). In contrast, the glial marker genes Itgam, Cspg4, and Aldh1l1 were mainly detected in NeuN− nonneuronal cells (b), but not in NeuN+ hippocampal neurons (a). Data shown in (a) were normalized to Rbfox3 expression in the NeuN+ population, which was defined as 1. Data shown in (b) were normalized to each respective marker gene level in NeuN+ (Rbfox3) and NeuN− cells (all three glial markers).
Figure 5
Figure 5. CB2R Agonists Mimic and Occlude the AP-Driven Hyperpolarization
(A–D) Exemplary Vm time courses of wc CA3 PC recordings are shown for the application of 10 μM2-AG (A), 1 μM WIN (B), and 1 μM HU (C) that hyperpolarize CA3 PCs. The hyperpolarizing effect of HU is gone in the CB2R−/− (D). (E and F) The ΔVm of each recorded cell (circles) and the median and 25th and 75th percentiles of the average ΔVm (E) as well as the percentage of reactive cells (F) are shown for the application of 2-AG in WT (wc, n(N) = 15(5): −5.3, −9.0 to −3.9 mV; 53.3%) and in CB2R−/− (pp, n(N) = 5(2): 1.6, 0.5 to 2.2 mV; 0%), WIN in WT (wc, n(N) = 23(15): −4.2, −5.6 to −2.7 mV; 60.9%), HU in WT (wc, n(N) = 20(10): −7.6, −9.7 to −4.9 mV; 60%), HU in CB2R−/− (wc, n(N) = 12(3): 0.9, 0.3 to 1.5 mV; 8.3%), HU in Syn-CB2R−/− (wc, n(N) = 14(5): 1.4, 0.3 to 3 mV, 0%), and HU in Syn-CB2R+/+ (wc, n(N) = 6(4): −7.5, −9 to −5.7 mV; 50%). Note that the filled circles indicate reactive cells. Green, 2-AG; yellow, WIN; blue, HU. Kruskal-Wallis with Dunn’s post-test, p < 0.05 for 2-AG and HU in CB2R−/− versus WT. (G) AM-251 reverses the hyperpolarization induced by 2-AG in n(N) = 3(3) CA3 PCs (−5.3 ± 0.9 mV and −0.9 ± 1 mV, respectively). (H) The HU-induced hyperpolarization (blue line) occludes further hyperpolarization of CA3 PCs in response to APs (rectangle) and vice versa. Exemplary ΔVm time courses of CA3 PCs that hyperpolarize in response to HU (left) and AP trains (right) are shown. (I) Single-occlusion experiments (gray circles) and mean ± SEM (black) are shown for each condition. Average ΔVm for HU followed by APs (left, n(N) = 6(4): −6.6 ± 1.3 and −7.8 ± 1.9 mV; paired t test, p = 0.24) and APs followed by HU (right, n(N) = 6(6): −4.2 ± 1.2 and −3.4 ± 0.9 mV, p = 0.19).
Figure 6
Figure 6. The Hyperpolarization Is Mediated by a G Protein- and Na+-Dependent Modulation of the NBC
(A) Exemplary ΔVm time courses of wc CA3 PC recordings with internal application of 0.5 mM GDPβS. The subsequent application of 1 μM HU fails to hyperpolarize the CA3 PC. (B) The ΔVm of each recorded cell (circles) and the median and 25th and 75th percentiles of the average ΔVm (left) as well as the percentage of reactive cells (right) are shown for GDPβS+HU (n(N) = 15(5): 0.6, −0.04 and 3.6 mV; 13.3%) and are significantly different from control WT cells (ΔVm: p < 0.0001, compare to Figure 5E). Note that the remaining reactive cells (indicted by filled circles) are most likely caused by an insufficient diffusion of GDPβS given the short incubation of 5 min to prevent washout. (C) Exemplary Vm traces of reactive CA3 PCs recorded in wc configuration that hyperpolarized in response to 10 μM 2-AG (left), 1 μM WIN (middle), and 1 μM HU (right). The Rin was calculated from the steady-state response to a −80-pA test pulse. In each panel, the left trace represents the control condition (1 min before agonist application) and the right trace is taken from 5 to 10 min after the drug was bath applied. The respective Vm values are indicated below each trace. (D) Summary bar graph of all reactive cells shows the normalized ΔRin (mean ± SEM) after drug application for 2-AG (n = 8: 1.1 ± 0.1), WIN (n = 14: 1.01 ± 0.05), and HU (n = 12: 1.2 ± 0.1) that does not differ significantly from baseline levels (paired t test for 2-AG, WIN, and HU: p = 0.30, 0.99, and 0.12). (E) IV plot of n(N) = 4(2) reactive CA3 PCs that were recorded at different holding potentials in voltage clamp (−110 to 40 mV, 10-mV steps) before and after the application of HU. The hyperpolarization was not accompanied by a change in the IV relationship (normalized to −60 mV, paired t test: p = 0.66). (F–H) Replacement of Na+ with NMDG in the ACSF as well as block of the NBC by preincubation of the antagonist S0859 abolished the hyperpolarization. Examples of ΔVm values for the application of HU in NMDG (F), HU in S0859 (G), and AP stimulation in S0859 in CA3 PCs (H) are shown. (I) The ΔVm of each recorded cell (circles) and the median and 25th and 75th percentiles of the average ΔVm (left) as well as the percentage of reactive cells (right) are shown for the application of HU in NMDG (wc, n(N) = 11(5): 1.9, −1.1 to 2.8 mV; 0%), HU in S0859 (wc, n(N) = 16(6): 0.01, −1.1 to 1.7 mV, 6.25%), APs in S0859 (wc, n(N) = 23(9): 1.1, 0.1 to 3 mV, 4.3%), and, as a control, HU in 10 μM ouabain (wc, n(N) = 17(6), −5.8, −7.9 to −4.2 mV, 52.9%).
Figure 7
Figure 7. Comparison of CB2R- versus Presynaptic CBR-Mediated Effects
(A and B) The continuous block of glutamatergic (20 μM NBQX, 50 μM D-AP5) as well as GABAergic (1 μM Gabazine, 1 μM CGP) transmission does not abolish the AP-induced hyperpolarization. (A) Example wc recording of a reactive CA3 PC in response to the AP train (rectangle) is shown. (B) The ΔVm of each recorded cell (circles) and the median and 25th and 75th percentiles of the average ΔVm of all reactive cells are shown for n(N) = 8(2) experiments (−4.8, −8.3, and −3.8 mV; left). The percentage of reactive cells is 62.5% (right). (C) Dual pp recording of 2 CA3 PCs. AP firing in a control cell (lower trace) elicits a hyperpolarization in this, but not in the other cell (upper trace). The AHPs of the control cell are clipped for display purposes. (D) In 5/5 recordings (N = 5), the control cell hyperpolarized in response to the AP trains (filled gray circles, ΔVm: −6.0 ± 1.5 mV), whereas the unstimulated cell did not (open black circles, ΔVm: 0.02 ± 0.6 mV). (E and F) CB2R agonists cannot mimic CB1R-mediated depression of synaptic transmission. (E) HU has no effect on DSI-positive eIPSCs. Left: example of a CA3 PC recorded in wc configuration is shown. Depolarization of the neuron results in a transient reduction of eIPSC amplitude, whereas bath application of HU does not. Right: mean normalized eIPSC amplitudes of n(N) = 5(4) experiments for DSI (0.7 ± 0.03) and HU application (1 ± 0.05) in comparison to baseline (paired t test, p = 0.0016 and p = 0.67) are shown. (F) WIN, but not HU, suppresses evoked field responses in CA3. Left: exemplary fEPSP recording with HU and WIN bath application is shown. Right: mean normalized fEPSP slopes for HU (1 ± 0.03) and WIN (0.7 ± 0.05) in comparison to baseline (paired t test, p = 0.33 and p < 0.001) are shown.
Figure 8
Figure 8. Functional Relevance of CB2R Activation Probed In Vitro and In Vivo
(A–C) PSTs trigger long-lasting hyperpolarization. (A) Schematic shows the presented PST (upper panel) as well as a segment of an exemplary Vm trace of a rat CA3 PC that fires in response to the respective stimulus (lower panel). (B) Vm time plot shows the same CA3 PC responding to the PST (rectangle) with a long-lasting hyperpolarization. (C) Left: the ΔVm of each recorded cell (circles) and the median and 25th and 75th percentiles of the average ΔVm of reactive rat CA3 PCs (wc, n(N) = 16(6): −4.5, −6.7, and −2.7 mV) are shown. Right: percentage of reactive cells (50%) is shown. (D–F) CB2R activation reduces the spike probability of CA3 PCs. (D) The spike probability of a CA3 PC in response to the application of the CB2R agonist HU is shown. Example traces show spikes elicited by synaptic stimulation during control conditions (black) and 5 min after HU application (red). The baseline and hyperpolarized Vm values are indicated below the traces. (E) Time plot of the Vm (circles) show the same cell and its AP firing (vertical lines) for each given Vm. (F) Summary graph shows the spike probability for n(N) = 5(3) reactive cells under baseline and agonist conditions (0.8 ± 0.02 and 0.14 ± 0.04, respectively). The change in spike probability was accompanied by an average Vm hyperpolarization of −6.3 ± 0.3 mV. (G and H) CB2Rs regulate hippocampal gamma oscillations in vivo: altered coupling of gamma and theta oscillations after HU application. (G) LFP signal traces (1–150 Hz band-pass filtered) were recorded in the CA3 area during exploratory behavior before (upper panel) and 30 min after (lower panel) the i.p. administration of HU (10 mg/kg). Note that the typical association of high-amplitude gamma oscillations with theta oscillation peaks (shades) and low-amplitude gamma oscillations with theta oscillation troughs is altered after the CB2R agonist administration. (H) The theta modulation of slow (30–85 Hz), but not intermediate (65–120 Hz), gamma oscillations was reduced by the agonist administration (vehicle: n(N) = 15(10), agonist: n(N) = 13(10), F1,13 = 9.1, p = 0.010, slow, F1,13 = 0.0, p = 0.86, ANOVA).

Comment in

  • A Central Move for CB2 Receptors.
    Quraishi SA, Paladini CA. Quraishi SA, et al. Neuron. 2016 May 18;90(4):670-1. doi: 10.1016/j.neuron.2016.05.012. Neuron. 2016. PMID: 27196970

References

    1. Bacci A, Huguenard JR, Prince DA. Long-lasting self-inhibition of neocortical interneurons mediated by endocannabinoids. Nature. 2004;431:312–316. - PubMed
    1. Baek JH, Darlington CL, Smith PF, Ashton JC. Antibody testing for brain immunohistochemistry: brain immunolabeling for the cannabinoid CB2 receptor. J Neurosci Methods. 2013;216:87–95. - PubMed
    1. Bieri KW, Bobbitt KN, Colgin LL. Slow and fast γ rhythms coordinate different spatial coding modes in hippocampal place cells. Neuron. 2014;82:670–681. - PMC - PubMed
    1. Bilkei-Gorzo A, Racz I, Valverde O, Otto M, Michel K, Sastre M, Zimmer A. Early age-related cognitive impairment in mice lacking cannabinoid CB1 receptors. Proc Natl Acad Sci USA. 2005;102:15670–15675. - PMC - PubMed
    1. Bouaboula M, Bianchini L, McKenzie FR, Pouyssegur J, Casellas P. Cannabinoid receptor CB1 activates the Na+/H+ exchanger NHE-1 isoform via Gi-mediated mitogen activated protein kinase signaling transduction pathways. FEBS Lett. 1999;449:61–65. - PubMed

Publication types

MeSH terms

Substances