

Differential effector gene expression underpins epistasis in a plant fungal disease
- PMID: 27133896
- PMCID: PMC5053286
- DOI: 10.1111/tpj.13203
Differential effector gene expression underpins epistasis in a plant fungal disease
Abstract
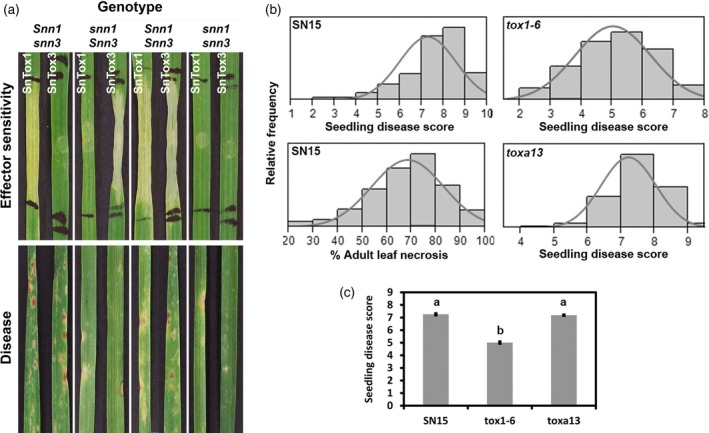
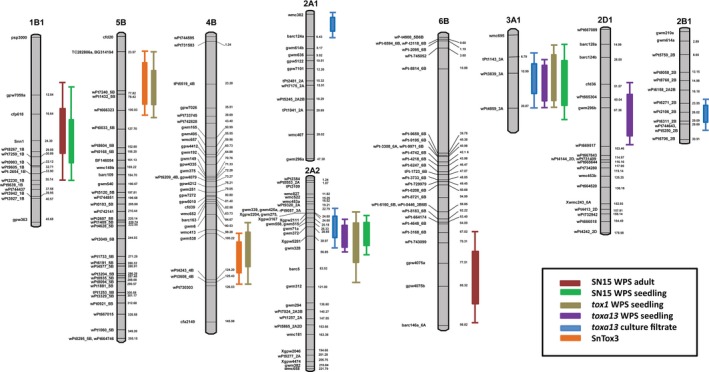
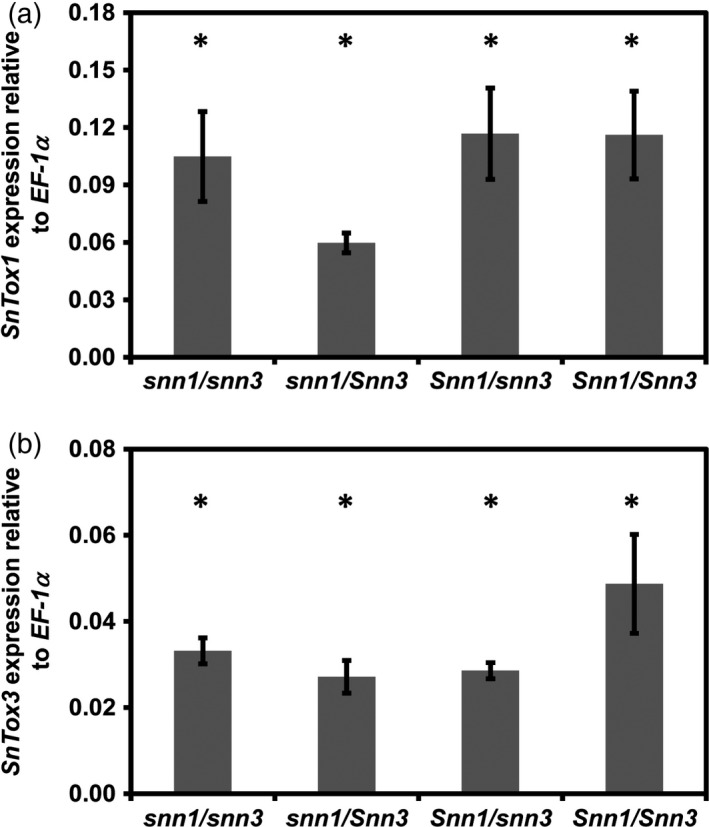
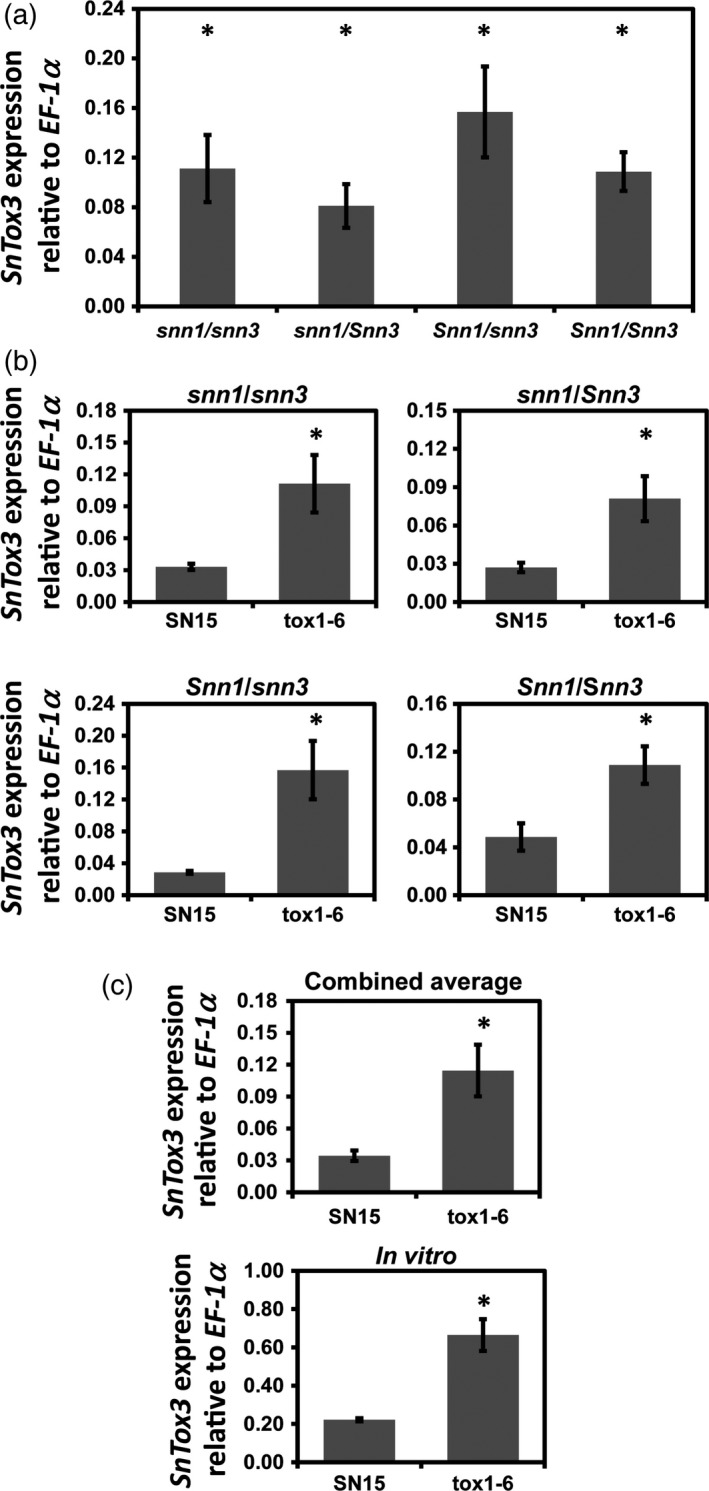
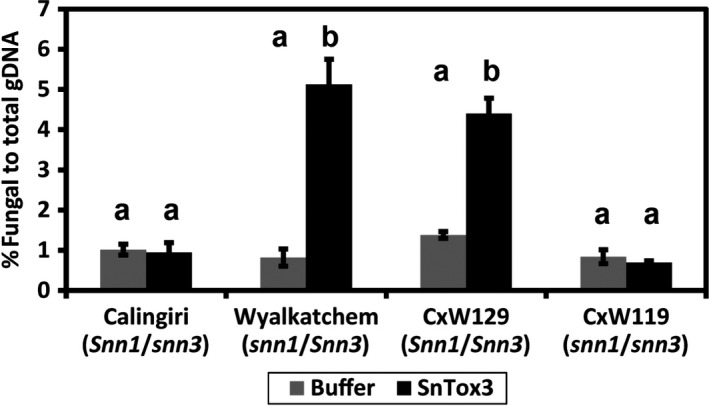
Fungal effector-host sensitivity gene interactions play a key role in determining the outcome of septoria nodorum blotch disease (SNB) caused by Parastagonospora nodorum on wheat. The pathosystem is complex and mediated by interaction of multiple fungal necrotrophic effector-host sensitivity gene systems. Three effector sensitivity gene systems are well characterized in this pathosystem; SnToxA-Tsn1, SnTox1-Snn1 and SnTox3-Snn3. We tested a wheat mapping population that segregated for Snn1 and Snn3 with SN15, an aggressive P. nodorum isolate that produces SnToxA, SnTox1 and SnTox3, to study the inheritance of sensitivity to SnTox1 and SnTox3 and disease susceptibility. Interval quantitative trait locus (QTL) mapping showed that the SnTox1-Snn1 interaction was paramount in SNB development on both seedlings and adult plants. No effect of the SnTox3-Snn3 interaction was observed under SN15 infection. The SnTox3-Snn3 interaction was however, detected in a strain of SN15 in which SnTox1 had been deleted (tox1-6). Gene expression analysis indicates increased SnTox3 expression in tox1-6 compared with SN15. This indicates that the failure to detect the SnTox3-Snn3 interaction in SN15 is due - at least in part - to suppressed expression of SnTox3 mediated by SnTox1. Furthermore, infection of the mapping population with a strain deleted in SnToxA, SnTox1 and SnTox3 (toxa13) unmasked a significant SNB QTL on 2DS where the SnTox2 effector sensitivity gene, Snn2, is located. This QTL was not observed in SN15 and tox1-6 infections and thus suggesting that SnToxA and/or SnTox3 were epistatic. Additional QTLs responding to SNB and effectors sensitivity were detected on 2AS1 and 3AL.
Keywords: NE; Parastagonospora nodorum; SnTox1; SnTox3; Triticum aestivum; epistasis; necrotrophic effector.
© 2016 The Authors. The Plant Journal published by Society for Experimental Biology and John Wiley & Sons Ltd.
Figures
Similar articles
-
Novel sources of resistance to Septoria nodorum blotch in the Vavilov wheat collection identified by genome-wide association studies.Theor Appl Genet. 2018 Jun;131(6):1223-1238. doi: 10.1007/s00122-018-3073-y. Epub 2018 Feb 22. Theor Appl Genet. 2018. PMID: 29470621 Free PMC article.
-
Characterization of the interaction of a novel Stagonospora nodorum host-selective toxin with a wheat susceptibility gene.Plant Physiol. 2008 Feb;146(2):682-93. doi: 10.1104/pp.107.108761. Epub 2007 Dec 7. Plant Physiol. 2008. PMID: 18065563 Free PMC article.
-
Identification and Characterization of the SnTox6-Snn6 Interaction in the Parastagonospora nodorum-Wheat Pathosystem.Mol Plant Microbe Interact. 2015 May;28(5):615-25. doi: 10.1094/MPMI-12-14-0396-R. Mol Plant Microbe Interact. 2015. PMID: 25608181
-
Genetics of resistance to septoria nodorum blotch in wheat.Theor Appl Genet. 2022 Nov;135(11):3685-3707. doi: 10.1007/s00122-022-04036-9. Epub 2022 Jan 20. Theor Appl Genet. 2022. PMID: 35050394 Review.
-
The Necrotrophic Pathogen Parastagonospora nodorum Is a Master Manipulator of Wheat Defense.Mol Plant Microbe Interact. 2023 Dec;36(12):764-773. doi: 10.1094/MPMI-05-23-0067-IRW. Epub 2023 Dec 22. Mol Plant Microbe Interact. 2023. PMID: 37581456 Review.
Cited by
-
Genes Associated with Foliar Resistance to Septoria Nodorum Blotch of Hexaploid Wheat (Triticum aestivum L.).Int J Mol Sci. 2021 May 25;22(11):5580. doi: 10.3390/ijms22115580. Int J Mol Sci. 2021. PMID: 34070394 Free PMC article.
-
Identification of Wheat Septoria tritici Resistance Genes in Wheat Germplasm Using Molecular Markers.Plants (Basel). 2024 Apr 16;13(8):1113. doi: 10.3390/plants13081113. Plants (Basel). 2024. PMID: 38674522 Free PMC article.
-
From effectors to effectomes: Are functional studies of individual effectors enough to decipher plant pathogen infectious strategies?PLoS Pathog. 2020 Dec 3;16(12):e1009059. doi: 10.1371/journal.ppat.1009059. eCollection 2020 Dec. PLoS Pathog. 2020. PMID: 33270803 Free PMC article. Review. No abstract available.
-
GWAS analysis reveals distinct pathogenicity profiles of Australian Parastagonospora nodorum isolates and identification of marker-trait-associations to septoria nodorum blotch.Sci Rep. 2021 May 12;11(1):10085. doi: 10.1038/s41598-021-87829-0. Sci Rep. 2021. PMID: 33980869 Free PMC article.
-
A specific fungal transcription factor controls effector gene expression and orchestrates the establishment of the necrotrophic pathogen lifestyle on wheat.Sci Rep. 2019 Nov 4;9(1):15884. doi: 10.1038/s41598-019-52444-7. Sci Rep. 2019. PMID: 31685928 Free PMC article.
References
-
- Abeysekara, N.S. , Friesen, T.L. , Keller, B. and Faris, J.D. (2009) Identification and characterization of a novel host‐toxin interaction in the wheat‐Stagonospora nodorum pathosystem. Theor. Appl. Genet. 120, 117–126. - PubMed
-
- Aguilar, V. (2004) Genetic Analysis and Early Testing of Stagonospora nodorum Blotch Resistance in Hexaploid Wheat (ETH No. 1562). Zurich: ETHZ.
-
- Aguilar, V. , Stamp, P. , Winzeler, M. , Winzeler, H. , Schachermayr, G. , Keller, B. , Zanetti, S. and Messmer, M.M. (2005) Inheritance of field resistance to Stagonospora nodorum leaf and glume blotch and correlations with other morphological traits in hexaploid wheat (Triticum aestivum L.). Theor. Appl. Genet. 111, 325–336. - PubMed
-
- Arseniuk, E. , Czembor, P.C. , Czaplicki, A. , Song, Q.J. , Cregan, P.B. , Hoffman, D.L. and Ueng, P.P. (2004) QTL controlling partial resistance to Stagonospora nodorum leaf blotch in winter wheat cultivar Alba. Euphytica, 137, 225–231.
Publication types
MeSH terms
Substances
Associated data
- Actions
- Actions
- Actions
- Actions
LinkOut - more resources
Full Text Sources
Other Literature Sources
