. 2016 May 10;15(6):1316-28.
doi: 10.1016/j.celrep.2016.04.012. Epub 2016 Apr 28.

Polarizing the Neuron through Sustained Co-expression of Alternatively Spliced Isoforms

Affiliations

Polarizing the Neuron through Sustained Co-expression of Alternatively Spliced Isoforms

Karen Yap et al. Cell Rep. .

Abstract

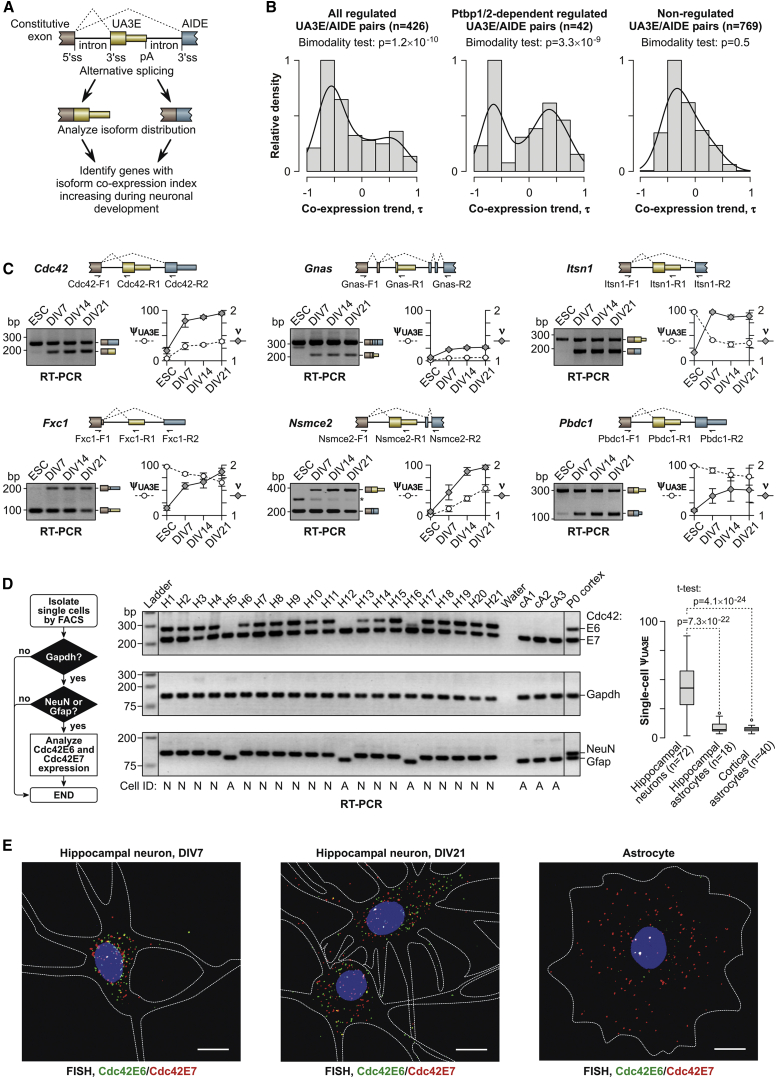
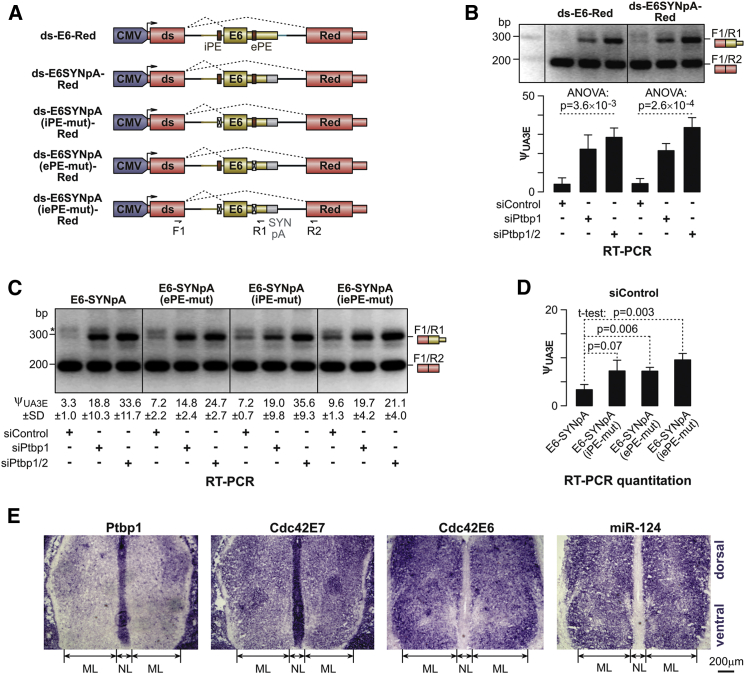
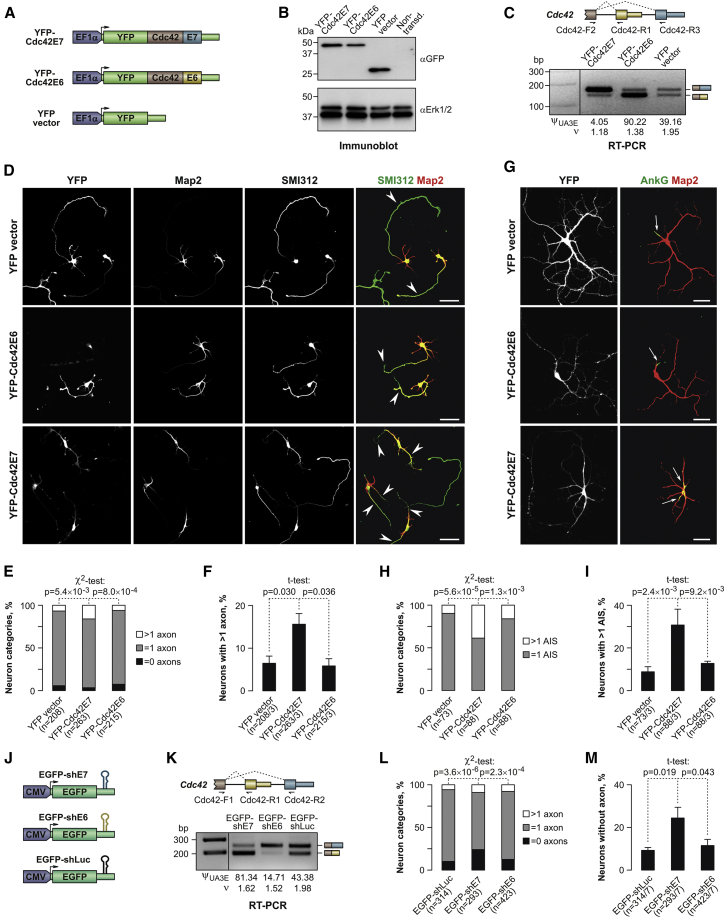
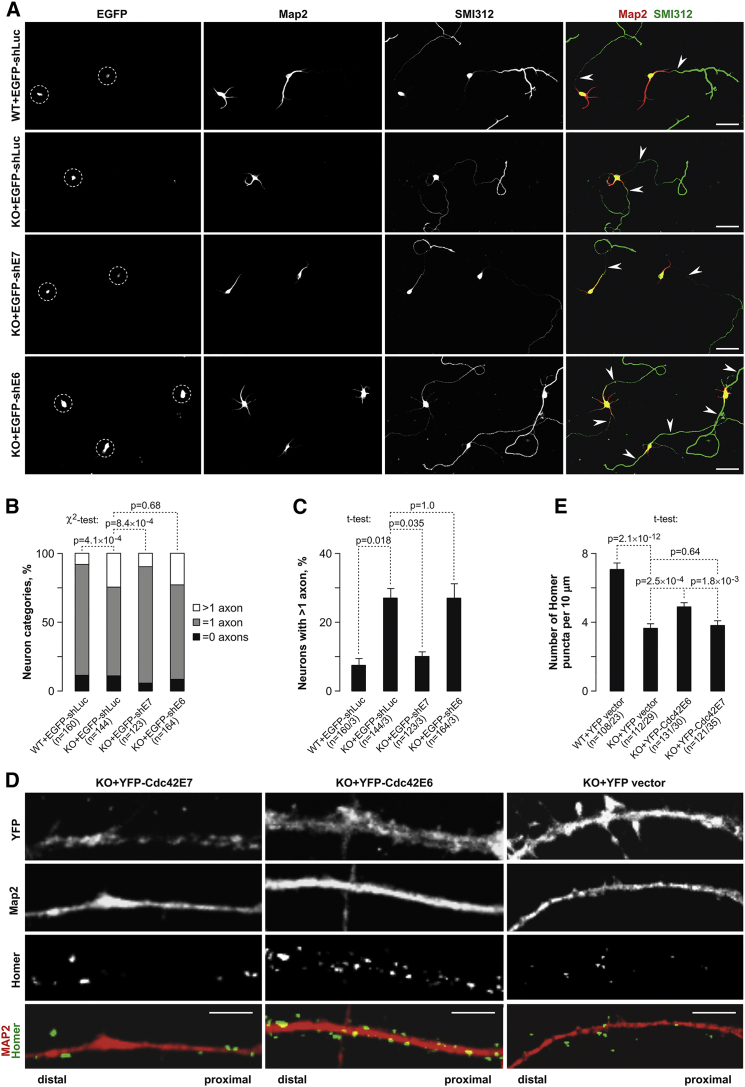
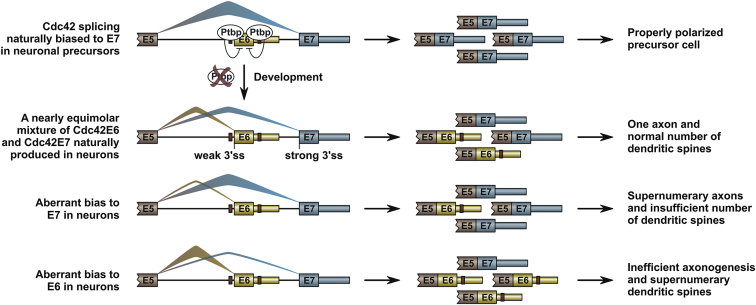
Alternative splicing (AS) is an important source of proteome diversity in eukaryotes. However, how this affects protein repertoires at a single-cell level remains an open question. Here, we show that many 3'-terminal exons are persistently co-expressed with their alternatives in mammalian neurons. In an important example of this scenario, cell polarity gene Cdc42, a combination of polypyrimidine tract-binding, protein-dependent, and constitutive splicing mechanisms ensures a halfway switch from the general (E7) to the neuron-specific (E6) alternative 3'-terminal exon during neuronal differentiation. Perturbing the nearly equimolar E6/E7 ratio in neurons results in defects in both axonal and dendritic compartments and suggests that Cdc42E7 is involved in axonogenesis, whereas Cdc42E6 is required for normal development of dendritic spines. Thus, co-expression of a precise blend of functionally distinct splice isoforms rather than a complete switch from one isoform to another underlies proper structural and functional polarization of neurons.


Figures

None
Graphical abstract
Figure 1
Figure 1
Co-expression of Alternative 3′-Terminal Exons in Developing Neurons (A) Bioinformatics approach used to identify pairs of UA3Es and corresponding AIDEs that are increasingly co-expressed during neuronal development. (B) Distributions of Kendall rank correlation coefficients (τ) of time-resolved ν trajectories for all (n = 426) and Ptbp1/2-dependent (n = 42) regulated UA3E/AIDE pairs, as well as for non-regulated events (n = 769). Shown are histograms normalized to the height of the most populated bin and the corresponding distribution density estimates. Note that the distributions are bimodal for both regulated subsets, with the two peaks corresponding to UA3E/AIDE pairs with increasing and decreasing co-expression trends, respectively. (C) Ptbp1/2-dependent (Cdc42, Gnas, and Itsn 1) and -independent (Fxc1, Nsmce2, and Pbdc1) UA3E/AIDE pairs with increasing co-expression trends were analyzed by multiplex RT-PCR in mouse ESCs and primary hippocampal neurons at different stages of maturation (DIV7–DIV21). Relevant gene fragments and PCR primers used for the analysis are depicted on the upper panel, whereas corresponding gel images and ΔψUA3E and ν quantitations are shown at the lower panel. Data are averaged from three experiments using independent cell cultures ± SE. (D) Single-cell analysis of Cdc42 isoform co-expression. As summarized in the flowchart on the left, cells were acutely isolated from newborn mouse hippocampi by FACS and assayed by RT-PCR for housekeeping (Gapdh), neuronal (NeuN), and astroglial (Gfap) markers prior to estimating proportional abundance of the Cdc42E6 and Cdc42E7 isoforms. The three RT-PCR panels in the middle show representative analyses of 21 hippocampal cells (H1–H21) identified as neurons (NeuN+/Gfap; N) or astrocytes (NeuN/Gfap+; A). Note that all hippocampal neurons express comparable amounts of Cdc42E6 and Cdc42E7, whereas hippocampal astrocytes express almost exclusively Cdc42E7. A similar preference for Cdc42E7 was detected in astrocytes enriched from newborn mouse cortex (cells cA1–cA3). As a control, we additionally analyzed total RNA extracted from an entire mouse cortex (lane “P0 cortex”). A boxplot quantitation of the Cdc42 isoform expression in the entire single-cell RT-PCR dataset collected for 72 hippocampal neurons, 18 hippocampal astrocytes, and 40 cortical astrocytes is shown on the right. Samples were compared by two-tailed t test, assuming unequal variance. (E) Individual mRNA molecule-resolution RNA FISH analyses showing that hippocampal neurons persistently co-express comparable amounts of the two Cdc42 isoforms from DIV7 through DIV21, whereas astrocytes express almost exclusively Cdc42E7. Scale bars, 10 μm. White dashed lines show cell contours. See also Figures S1 and S2.
Figure 2
Figure 2
E6 of Cdc42 Pre-mRNA Is an Example of UA3E Regulated by Ptbps (A) dsRed-based minigenes containing Cdc42 E6 with its natural or synthetic polyadenylation context and WT or mutated clusters of pyrimidine-rich elements (iPE and ePE). Arrows indicate primers used for multiplex RT-PCR analyses. (B) CAD cells pretreated for 48 hr with siControl, siPtbp1, or siPtbp1/2 were transfected for another 24 hr with either ds-E6-Red or ds-E6SYNpA-Red, and minigene-specific splicing patterns were analyzed by multiplex RT-PCR with F1/R1/R2 primers. Note that knockdown of Ptbp1 alone, and especially in combination with Ptbp2, stimulates utilization of Cdc42 E6 for both minigenes in a manner virtually indistinguishable from that of endogenous Cdc42 transcripts (Figure S2E). Upper: agarose gel analyses of the RT-PCR products. Lower: E6-specific percent-spliced-in values (ψUA3E). (C) Multiplex RT-PCR analysis of the effect of iPE and/or ePE mutations introduced in (A) on AS of minigene transcripts. (D) Quantitative comparison of ψUA3E values between WT and mutant versions of E6, showing that both PE mutations stimulate E6 inclusion in siControl samples. (E) Alkaline phosphatase in situ hybridization analyses of embryonic-day (E)13.5 developing mouse neural tube sectioned at the hindbrain level and stained with digoxigenin-labeled RNA probes against Ptbp1 or either of the two Cdc42 isoforms, Cdc42E6 or Cdc42E7. Also shown is staining for miR-124 with a complementary digoxigenin-labeled locked nucleic acid (LNA) probe (Makeyev et al., 2007). Note that Ptbp1 is expressed at a high level in mesenchymal cells surrounding the neural tube and the two closely opposed neuroepithelial layer (NL) sheets lining the fourth ventricle and containing NSCs. As expected (Makeyev et al., 2007), miR-124 downregulates Ptbp1 in the mantle layer (ML) containing developing neurons. Note that Cdc42E7 is expressed in the Ptbp1-positive regions at a relatively high level and in the Ptbp1-depleted ML at a reduced but detectable level, whereas Cdc42E6 expression is restricted to the ML. Data in (B) and (D) are averaged from three independent experiments ± SD and compared using two-tailed t test or one-way ANOVA. See also Figures S2 and S3.
Figure 3
Figure 3
Cdc42E7 Promotes Axonogenesis (A) Lentiviral expression constructs encoding YFP-tagged Cdc42E6 and Cdc42E7 protein isoforms and the corresponding YFP vector control. (B) Neuronal cultures were transduced with the lentiviral constructs shown in (A) at DIV0 and analyzed at DIV3 by immunoblotting with an anti-GFP antibody. An anti-Erk1/2 antibody was used as a lane loading control. Note that the two YFP-tagged Cdc42 isoforms are expressed at comparable levels. (C) RT-PCR analysis of the aforementioned samples with primers recognizing both endogenous and lentivirus-encoded Cdc42 mRNAs confirms that the recombinant Cdc42 isoforms alter the natural E6/E7 balance. Upper: RT-PCR primer annealing sites shown for endogenous Cdc42. Lower: agarose gel analysis of the RT-PCR products. (D–I) Immunostaining of hippocampal neurons transduced with the constructs in (A) reveals a higher incidence of cells with more than one axon in Cdc42E7-expressing samples as compared to Cdc42E6 and YFP. (D) Representative DIV3 neurons stained for the axonal marker SMI312 and dendritic marker Map2. (E) χ2 test analysis of neuronal categories with zero, one, and more than one axon in (D). (F) t test comparisons of neuronal fractions containing more than one SMI312-positive axon in (D). (G) Representative DIV14 neurons stained for the AIS marker AnkG. (H) χ2 test comparison of neurons with one and more than one AIS in (G). (I) Percentage of neurons in (G) with more than one AIS compared by t test. Scale bars, 50 μm in (D) and (G). (J) Lentiviral constructs expressing Cdc42-specific (shE7 or shE6) or control (shLuc) shRNAs. (K) Multiplex RT-PCR analysis showing that Cdc42-specific shRNAs introduced in (J) alter fractional abundance of the corresponding Cdc42 isoforms. (L) Primary hippocampal neurons were transduced with the constructs in (J) at DIV0 and immunostained for SMI312 at DIV3, and neuronal fractions with zero, one, and more than one positive axon were compared by χ2 test. Note significant accumulation of neurons lacking SMI312-positive axons in the shE7 sample as compared to shLuc and shE6. (M) Percentage of neurons in (L) containing no detectable axons was compared by t test. Data in (E), (F), (H), (I), (L), and (M) are from at least three independent litters, with the n values showing overall numbers of neurons analyzed, and in (F), (I), and (M), also the numbers of independent litters. Error bars in (F), (I), and (M) correspond to SE. See also Figure S4.
Figure 4
Figure 4
Generation of KO Mice Lacking Cdc42 E6 Sequence (A) Genomic structure of the WT and the E6 null Cdc42 alleles. Red lines indicate the probe used for Southern blotting. (B) Southern blot of BglII-digested genomic DNA detecting a WT allele-specific ∼6.8-kb product in the WT mice and an E6 null-specific ∼5.5-kb product in the KO animals. Both fragments are present in the heterozygotes (HZ). (C) Multiplex RT-PCR analysis of E17.5 brains, confirming the expected lack of the Cdc42E6 isoform in the KO sample. (D and E) In (D), qRT-PCR with Cdc42E7-specific primers (Cdc42-F1/Cdc42-R2; Table S5) reveals a significant increase in the abundance of this isoform in HZ and KO E17.5 brains upon E6 deletion. (E) qRT-PCR with primers against a constitutively spliced Cdc42 region (Cdc42-F3/Cdc42-R4; Table S5), showing that the overall Cdc42 mRNA levels remain virtually unchanged across the three brain samples. Data are averaged from at least three biological replicates for each genotype ± SD and compared using one-way ANOVA. Cdc42 expression in the WT samples is set to 1. (F) Time-resolved comparison between WT (n = 6) and KO (n = 6) male littermates, showing reduced weight gain in the KO cohort as compared to the WT. Data points are averages ± SE. (G) Log10-transformed p values from a two-tailed t test demonstrating that the weight difference between the WT and the KO groups reaches significance by 6 months of age. See also Figure S5 and Table S5.
Figure 5
Figure 5
Deregulation of Axo-dendritic Polarity in E6 KO Neurons (A and B) Staining of DIV3 WT and KO hippocampal neurons for axonal (SMI312) and dendritic (Map2) markers reveals a significantly increased incidence of supernumerary axons in the KO. (A) Representative confocal images. (B) Quantitative comparisons between WT and KO carried out as explained in Figures 3E and 3F. (C and D) DIV14 hippocampal neurons immunostained for Map2 and the AIS-specific marker AnkG confirms the supernumerary axon phenotype in the KO neurons. (C) Representative images. (D) Quantitations. (E and F) Staining for Map2, Homer, and PSD95 shows a significantly reduced density of dendritic spines in the KO DIV21 hippocampal neurons as compared to the WT. (E) Representative images with magnified dendritic segments. (F) t test comparisons of WT and KO dendritic spine densities deduced from Homer- and PSD95-specific signals. Scale bars, 50 μm in (A) and (C) and 5 μm in (E). Quantitations in (B), (D), and (F) were carried out using neurons derived from at least three independent litters with the n values showing (B) and (D) numbers of neurons and litters and (F) numbers of neurons and dendritic segments analyzed. Error bars in (B), (D), and (F) correspond to SE. See also Figures S6 and S7.
Figure 6
Figure 6
Excessive Axonogenesis in KO Neurons Is due to Cdc42E7 Upregulation, while Reduced Dendritic Spine Density Is a Result of Cdc42E6 Loss (A–C) Increased expression of Cdc42E7 in KO hippocampal neurons was countered by transducing them with the EGFP-shE7 lentivirus (KO+EGFP-shE7) at DIV0, and the neurons were immunostained for SMI312 and Map2 at DIV3. WT+EGFP-shLuc, KO+EGFP-shLuc, and KO+EGFP-shE6 samples were used as controls. (A) Representative images with EGFP-positive somas marked by dashed circles. (B and C) Pairwise comparisons carried out as explained in Figures 3E and 3F, showing that EGFP-shE7, but not EGFP-shLuc or EGFP-shE6, reduces the percentage of KO neurons containing more than one axon to a WT-like level. (D and E) Loss of the Cdc42E6 expression was rescued by transducing KO hippocampal neurons with the YFP-Cdc42E6 at DIV0 followed by immunostaining with Map2- and Homer-specific antibodies at DIV21. YFP vector and YFP-Cdc42E7 constructs were used as controls. (D) Representative dendritic segments of transduced neurons corresponding to lower magnification images in Figure S6H. (E) t test comparisons of dendritic spine densities for WT and KO neurons transduced with corresponding expression constructs showing that YFP-Cdc42E6 at least partially restores spines lost in the absence of endogenous Cdc42E6. Scale bars, 100 μm in (A) and 5 μm in (D). Data in (B), (C), and (E) are averaged from at least three independent experiments, with the error bars representing SE. Quantitations in (B), (C), and (E) were done using neurons from at least three independent litters with the n values showing (B) total numbers of neurons and (C and E) both numbers of neurons and litters analyzed. Error bars in (C) and (E) correspond to SE. See also Figures S6 and S7.
Figure 7
Figure 7
Model Outlining Functional Significance of Regulated Cdc42 Splicing in Developing Neurons Non-neuronal cells express relatively large amounts of Ptbp1, inhibiting E6 and biasing Cdc42 splicing towards E7 inclusion. Ptbp1 down-regulation in neurons promotes sustained co-expression of functionally specialized Cdc42E6 and Cdc42E7 isoforms. Deregulation of the natural balance between these two isoforms leads to defects in the axonal and the dendritic compartments. See text for more detail.

References

    1. Ameur A., Zaghlool A., Halvardson J., Wetterbom A., Gyllensten U., Cavelier L., Feuk L. Total RNA sequencing reveals nascent transcription and widespread co-transcriptional splicing in the human brain. Nat. Struct. Mol. Biol. 2011;18:1435–1440. - PubMed
    1. Andreassi C., Riccio A. To localize or not to localize: mRNA fate is in 3’UTR ends. Trends Cell Biol. 2009;19:465–474. - PubMed
    1. Braunschweig U., Gueroussov S., Plocik A.M., Graveley B.R., Blencowe B.J. Dynamic integration of splicing within gene regulatory pathways. Cell. 2013;152:1252–1269. - PMC - PubMed
    1. Bromberg K.D., Iyengar R., He J.C. Regulation of neurite outgrowth by G(i/o) signaling pathways. Front. Biosci. 2008;13:4544–4557. - PMC - PubMed
    1. Cappello S., Attardo A., Wu X., Iwasato T., Itohara S., Wilsch-Bräuninger M., Eilken H.M., Rieger M.A., Schroeder T.T., Huttner W.B. The Rho-GTPase cdc42 regulates neural progenitor fate at the apical surface. Nat. Neurosci. 2006;9:1099–1107. - PubMed

Publication types