Daily Mean Temperature Affects Urolithiasis Presentation in Seoul: a Time-series Analysis
- PMID: 27134497
- PMCID: PMC4835601
- DOI: 10.3346/jkms.2016.31.5.750
Daily Mean Temperature Affects Urolithiasis Presentation in Seoul: a Time-series Analysis
Abstract
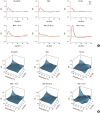
This study aimed to investigate the overall cumulative exposure-response and the lag response relationships between daily temperature and urolithiasis presentation in Seoul. Using a time-series design and distributing lag nonlinear methods, we estimated the relative risk (RR) of urolithiasis presentation associated with mean daily temperature, including the cumulative RR for a 20 days period, and RR for individual daily lag through 20 days. We analyzed data from 14,518 patients of 4 hospitals emergency department who sought medical evaluation or treatment of urolithiasis from 2005-2013 in Seoul. RR was estimated according to sex and age. Associations between mean daily temperature and urolithiasis presentation were not monotonic. Furthermore, there was variation in the exposure-response curve shapes and the strength of association at different temperatures, although in most cases RRs increased for temperatures above the 13°C reference value. The RRs for urolothiasis at 29°C vs. 13°C were 2.54 in all patients (95% confidence interval [CI]: 1.67-3.87), 2.59 in male (95% CI, 1.56-4.32), 2.42 in female (95% CI, 1.15-5.07), 3.83 in male less than 40 years old (95% CI, 1.78-8.26), and 2.47 in male between 40 and 60 years old (95% CI, 1.15-5.34). Consistent trends of increasing RR of urolithiasis presentation were observed within 5 days of high temperatures across all groups. Urolithiasis presentation increased with high temperature with higher daily mean temperatures, with the strongest associations estimated for lags of only a few days, in Seoul, a metropolitan city in Korea.
Keywords: Interrupted Time Series Analysis; Temperature; Urolithiasis.
Conflict of interest statement
Figures

References
-
- Sirohi M, Katz BF, Moreira DM, Dinlenc C. Monthly variations in urolithiasis presentations and their association with meteorologic factors in New York city. J Endourol. 2014;28:599–604. - PubMed
-
- Lo SS, Johnston R, Al Sameraaii A, Metcalf PA, Rice ML, Masters JG. Seasonal variation in the acute presentation of urinary calculi over 8 years in Auckland, New Zealand. BJU Int. 2010;106:96–101. - PubMed
-
- Chen YK, Lin HC, Chen CS, Yeh SD. Seasonal variations in urinary calculi attacks and their association with climate: a population based study. J Urol. 2008;179:564–569. - PubMed
-
- Park HK, Bae SR, Kim SE, Choi WS, Paick SH, Ho K, Kim HG, Lho YS. The effect of climate variability on urinary stone attacks: increased incidence associated with temperature over 18 °C: a population-based study. Urolithiasis. 2015;43:89–94. - PubMed
Publication types
MeSH terms
LinkOut - more resources
Full Text Sources
Other Literature Sources

