. 2016 Nov;14(11):2147-2157.
doi: 10.1111/pbi.12571. Epub 2016 May 26.

Subgenome-specific assembly of vitamin E biosynthesis genes and expression patterns during seed development provide insight into the evolution of oat genome

Affiliations

Subgenome-specific assembly of vitamin E biosynthesis genes and expression patterns during seed development provide insight into the evolution of oat genome

Juan J Gutierrez-Gonzalez et al. Plant Biotechnol J. 2016 Nov.

Abstract

Vitamin E is essential for humans and thus must be a component of a healthy diet. Among the cereal grains, hexaploid oats (Avena sativa L.) have high vitamin E content. To date, no gene sequences in the vitamin E biosynthesis pathway have been reported for oats. Using deep sequencing and orthology-guided assembly, coding sequences of genes for each step in vitamin E synthesis in oats were reconstructed, including resolution of the sequences of homeologs. Three homeologs, presumably representing each of the three oat subgenomes, were identified for the main steps of the pathway. Partial sequences, likely representing pseudogenes, were recovered in some instances as well. Pairwise comparisons among homeologs revealed that two of the three putative subgenome-specific homeologs are almost identical for each gene. Synonymous substitution rates indicate the time of divergence of the two more similar subgenomes from the distinct one at 7.9-8.7 MYA, and a divergence between the similar subgenomes from a common ancestor 1.1 MYA. A new proposed evolutionary model for hexaploid oat formation is discussed. Homeolog-specific gene expression was quantified during oat seed development and compared with vitamin E accumulation. Homeolog expression largely appears to be similar for most of genes; however, for some genes, homoeolog-specific transcriptional bias was observed. The expression of HPPD, as well as certain homoeologs of VTE2 and VTE4, is highly correlated with seed vitamin E accumulation. Our findings expand our understanding of oat genome evolution and will assist efforts to modify vitamin E content and composition in oats.

Keywords: homeolog expression; oat evolution; oat homeologs; seed composition; tocols; vitamin E.


Conflict of interest statement

The authors declare that they have no conflict of interests.

Figures
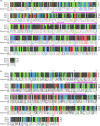
Figure 1
Figure 1
Examples of oat homeolog amino acid alignment of (a) HGGT and (b) VTE4. Residues colour‐coded by polarity: nonpolar side chains (black), polar (green), negative (−) electrical charge (red) and positive (+) electrical charge (blue). Purple bars on top of alignments represent main Pfam domains. Sequence logos colour‐coded using RasMol colours.
Figure 2
Figure 2
Amino acid conservation within principal enzymes in the vitamin E pathway. (a) Heat map of conserved regions showing areas with high (red) and low (blue) homology among the oat homeologous proteins and the amino acid sequences of other grass relatives: wheat, barley, Brachypodium, rice, maize and sorghum. Colour bars on top of alignments represent main Pfam domains. A rule at the top represents length in amino acids (b) Radial phylogenetic tree representation of the oat predicted homeologous proteins and those of grass relatives.
Figure 3
Figure 3
Developmental expression profiles of vitamin E biosynthesis genes in oat seeds. Heat maps show variance stabilization transformed homeolog normalized expression count values for (a) each individual replicate and (b) average of the three replicates per stage. Samples taken at the grain developmental stages 7, 14, 21 and 28 days after anthesis: daa7, daa14, daa21 and daa28, respectively. Replications are noted with the suffixes R1, R2 and R3. Darker blue colour implies higher expression. Circles show homeologs colour‐coded by gene for easier identification.
Figure 4
Figure 4
Expression of oat gene homeologs comprising vitamin E biosynthesis in developing oat seeds. Each enzymatic step is linked to a graph. Each column in the graph represents the expression of a homeolog form, gene_1, gene _2 and gene_3 for the first, second and third homeologs, respectively, and grouped by developmental stage (x‐axis). GGR has a fourth column for GGR_4 and VTE2 two extra columns ( VTE2_4 and VTE2_5). Lines in the graph represent tocopherol (red dashed line), tocotrienol (purple dashed line) and total tocol accumulation (brown solid liner) values throughout seed development, as reported by Gutierrez‐Gonzalez et al. (2013a). Values on the y‐axis refer to absolute counts (left axis) and μg/g (right). DMGGBQ: 2,3‐dimethyl‐5‐geranylgeranylbenzoquinol; DMPBQ: 2,3‐dimethyl‐6‐phytyl‐1,4‐benzoquinone; GGDP: geranylgeranyl diphosphate; GGR: geranylgeranyl diphosphate reductase; HGA: homogentisic acid; HPP: p‐hydroxyphenylpyruvic acid; HPT: homogentisate phytyltransferase; HPPD: 4‐hydroxyphenylpyruvate dioxygenase; HGGT: homogentisate geranylgeranyl transferase; MGGBQ: 2‐methyl‐6‐geranylgeranylbenzoquinol; MPBQ: 2‐methyl‐6‐phytylbenzoquinol; PDP: phytyl‐diphosphate; VTE1: 2‐methyl‐6‐phytyl‐1,4‐benzoquinone cyclase; VTE2: homogentisate phytyltransferase; VTE3: 2‐methyl‐6‐phytyl‐1,4‐benzoquinone/2‐methyl‐6‐solanyl‐1,4‐benzoquinone methyltransferase; VTE4: tocopherol methyltransferase; T: tocopherol; T3: tocotrienol.

References

    1. Abrouk, M. , Murat, F. , Pont, C. , Messing, J. , Jackson, S. , Faraut, T. , Tannier, E. et al. (2010) Palaeogenomics of plants: synteny‐based modelling of extinct ancestors. Trends Plant Sci. 15, 479–487. - PubMed
    1. Adams, K.L. , Cronn, R. , Percifield, R. and Wendel, J.F. (2003) Genes duplicated by polyploidy show unequal contributions to the transcriptome and organ‐specific reciprocal silencing. Proc. Natl Acad. Sci. USA, 100, 4649–4654. - PMC - PubMed
    1. Akhunova, A.R. , Matniyazov, R.T. , Liang, H. and Akhunov, E.D. (2010) Homoeolog‐specific transcriptional bias in allopolyploid wheat. BMC Genom. 11, 505. - PMC - PubMed
    1. Anders, S. and Huber, W. (2010) Differential expression analysis for sequence count data. Genome Biol. 11, R106. - PMC - PubMed
    1. Badaeva, E.D. , Yu Shelukhina, O. , Goryunova, S.V. , Loskutov, I.G. and Pukhalskiy, V.A. (2010) Phylogenetic relationships of tetraploid AB‐genome Avena species evaluated by means of cytogenetic (C‐banding and FISH) and RAPD analyses. J. Bot. 2010: 1–13. doi:10.1155/2010/742307. - DOI

LinkOut - more resources