. 2016 Oct;123(5):481-509.
doi: 10.1037/rev0000030. Epub 2016 Apr 28.

The discovery of processing stages: Extension of Sternberg's method

Affiliations

The discovery of processing stages: Extension of Sternberg's method

John R Anderson et al. Psychol Rev. 2016 Oct.

Abstract

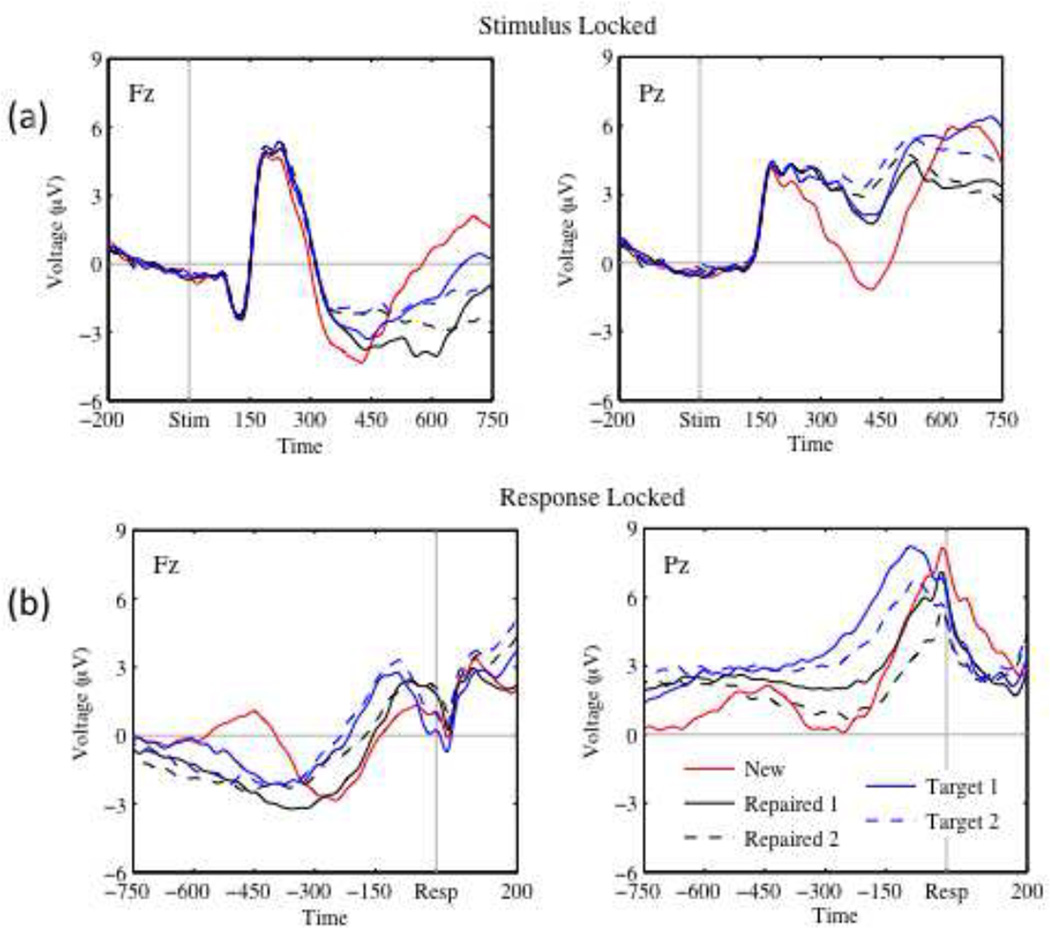
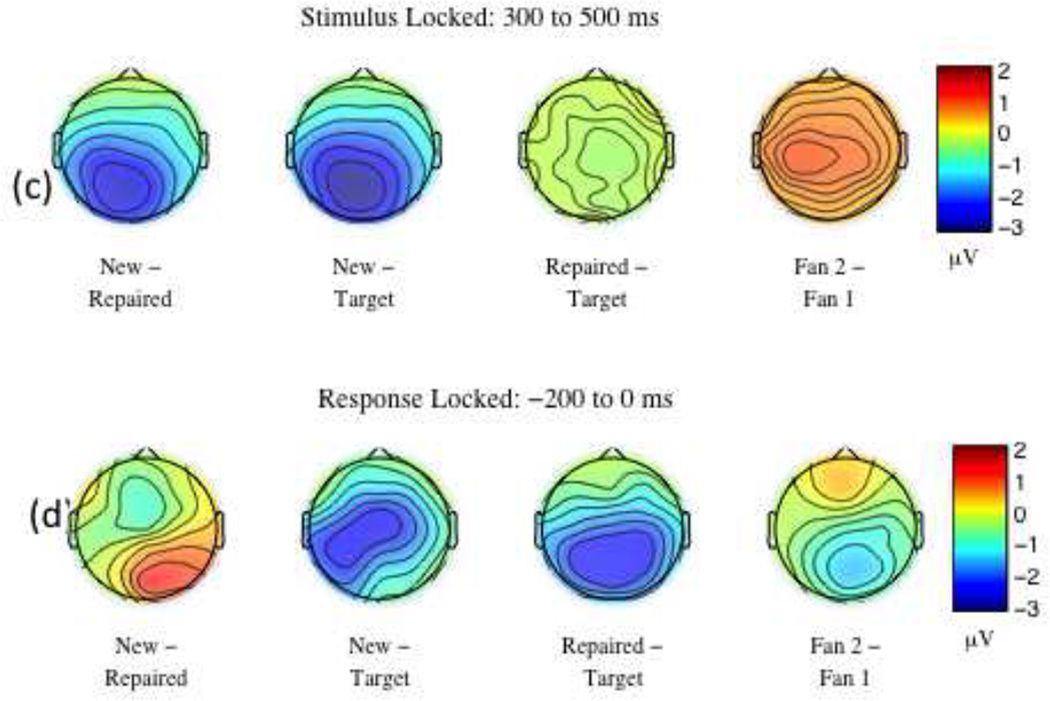
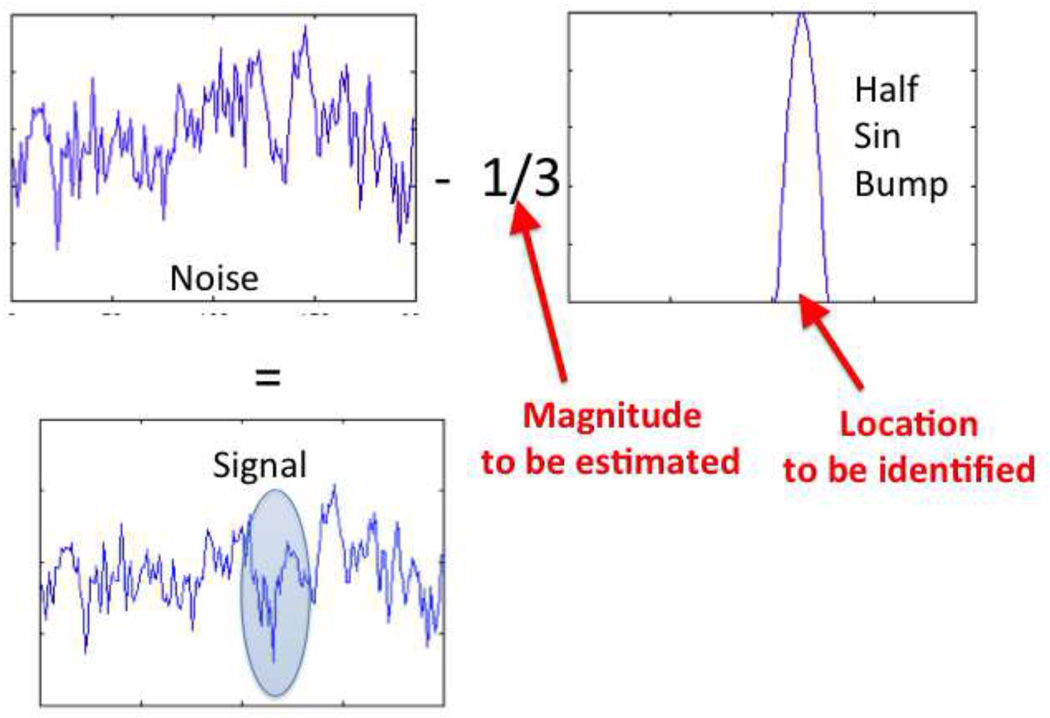
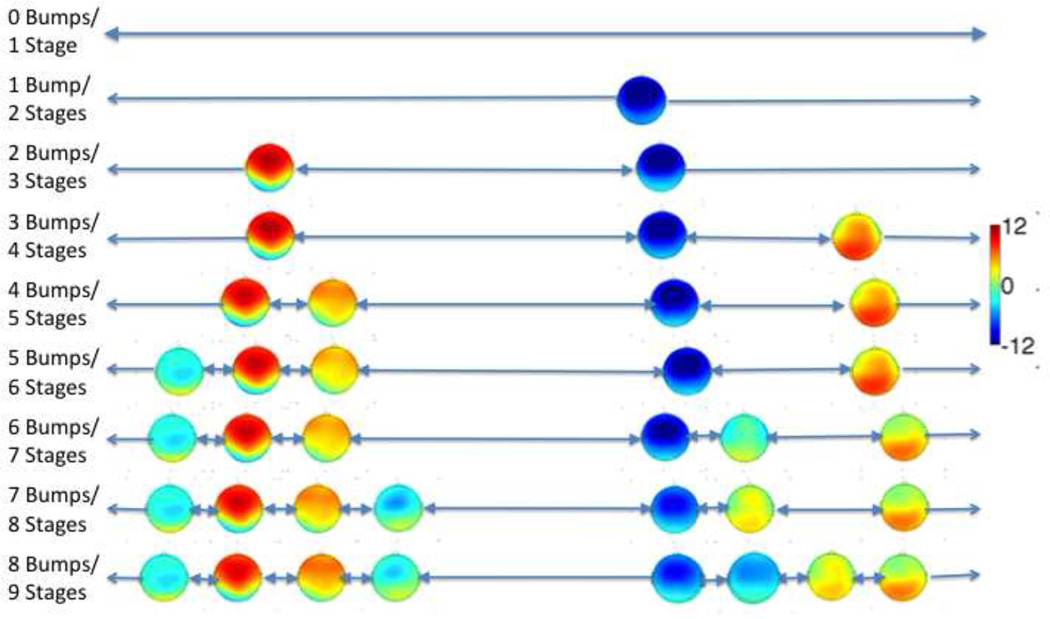
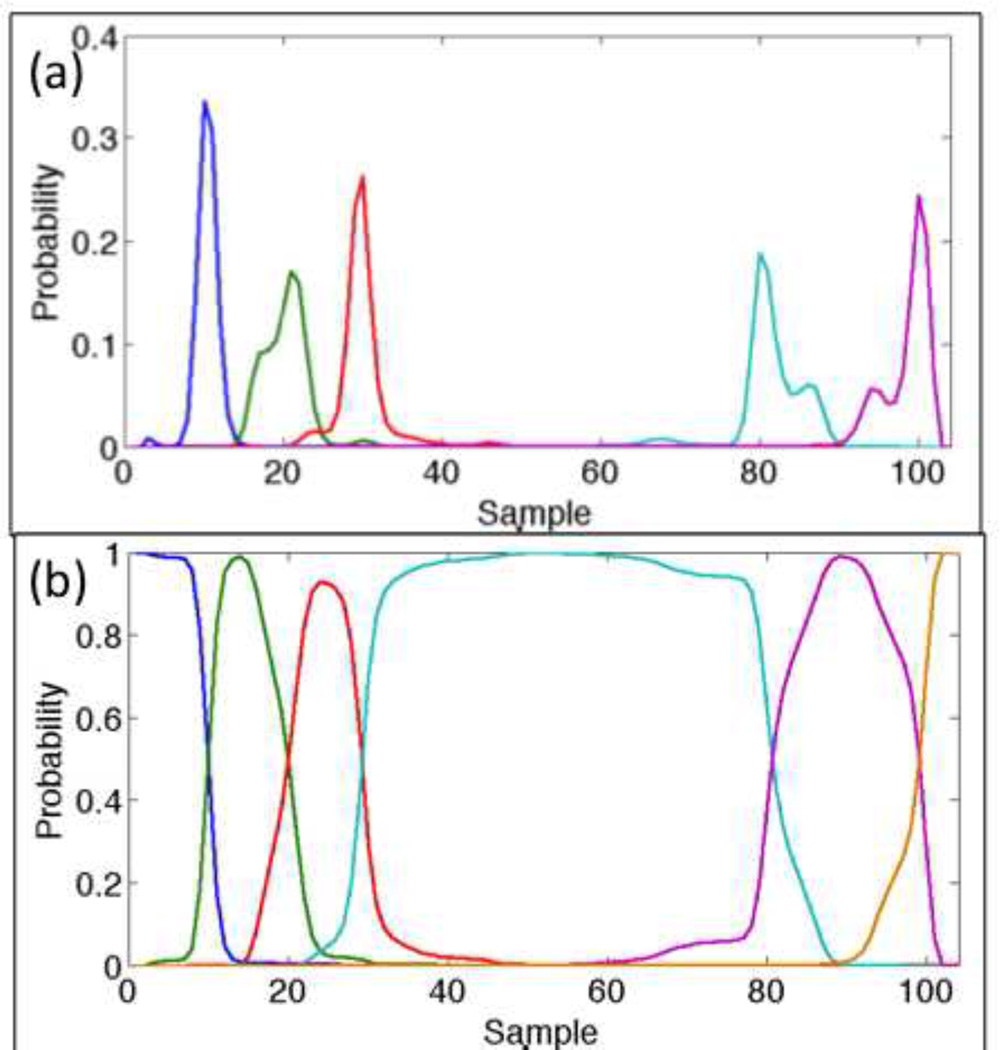
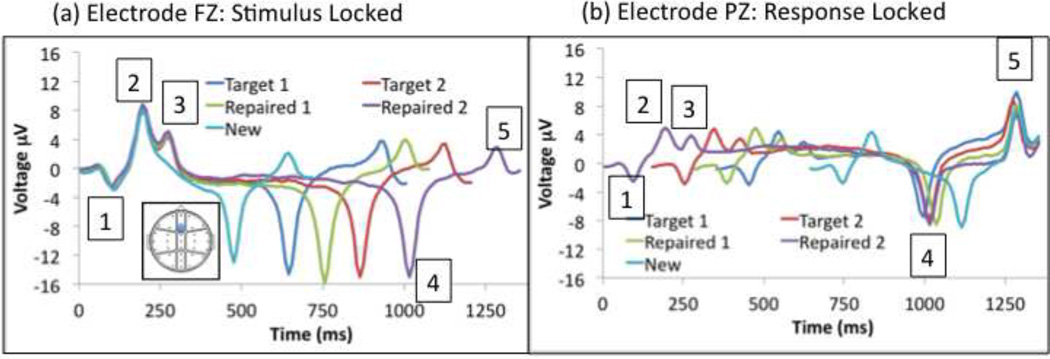
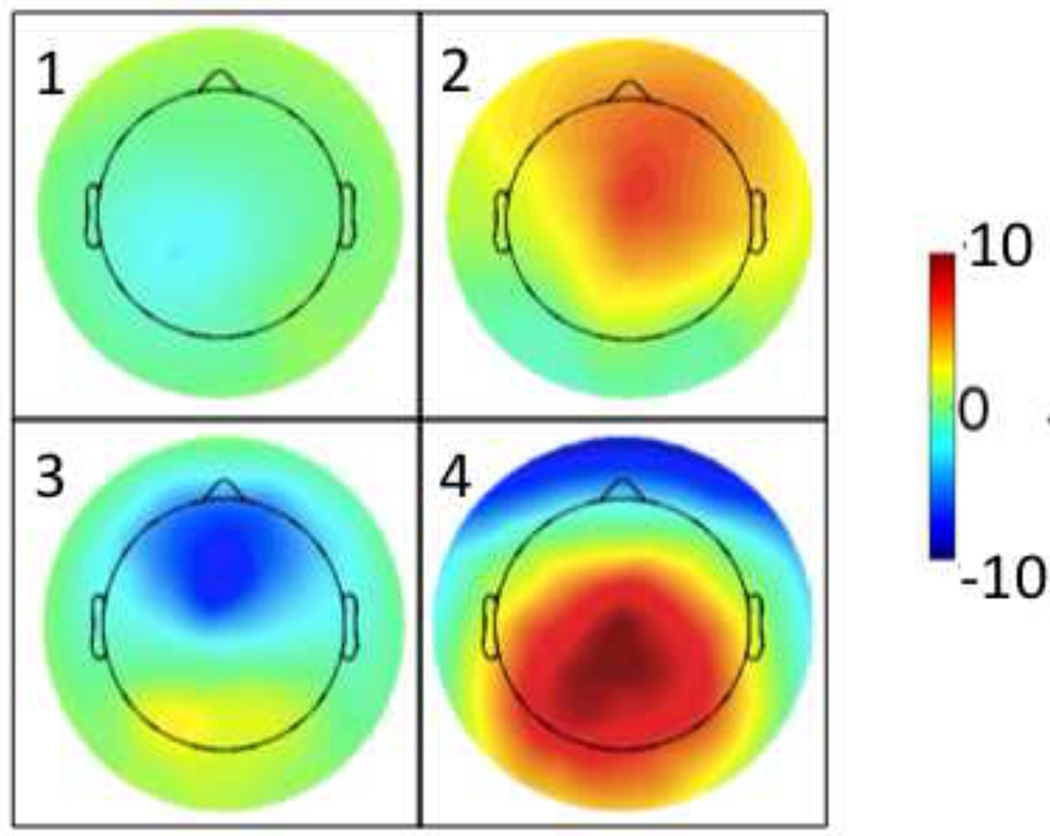
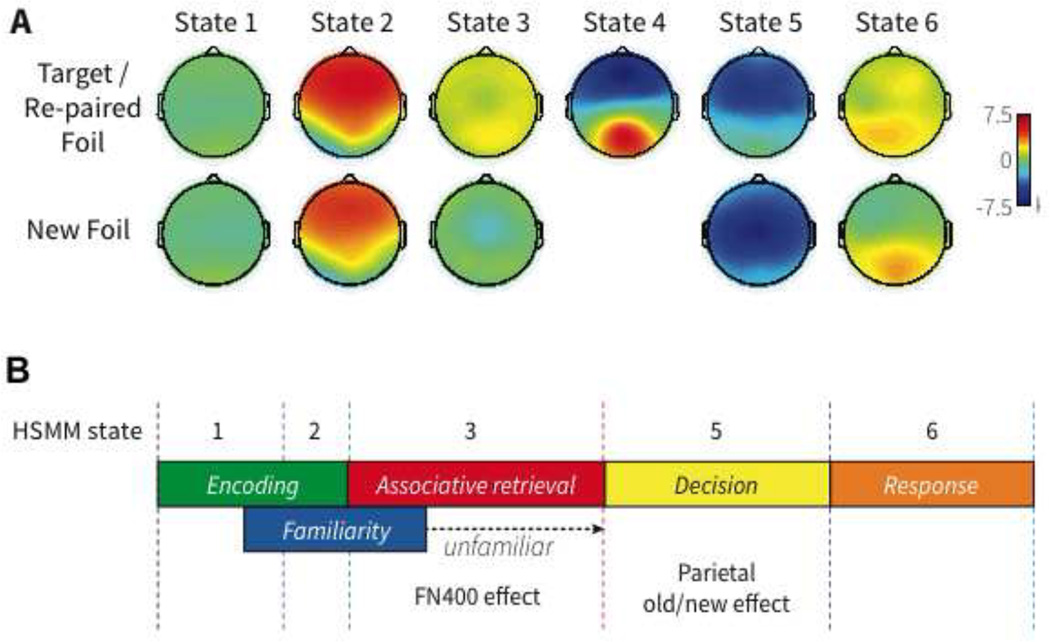
We introduce a method for measuring the number and durations of processing stages from the electroencephalographic signal and apply it to the study of associative recognition. Using an extension of past research that combines multivariate pattern analysis with hidden semi-Markov models, the approach identifies on a trial-by-trial basis where brief sinusoidal peaks (called bumps) are added to the ongoing electroencephalographic signal. We propose that these bumps mark the onset of critical cognitive stages in processing. The results of the analysis can be used to guide the development of detailed process models. Applied to the associative recognition task, the hidden semi-Markov models multivariate pattern analysis method indicates that the effects of associative strength and probe type are localized to a memory retrieval stage and a decision stage. This is in line with a previously developed the adaptive control of thought-rational process model, called ACT-R, of the task. As a test of the generalization of our method we also apply it to a data set on the Sternberg working memory task collected by Jacobs, Hwang, Curran, and Kahana (2006). The analysis generalizes robustly, and localizes the typical set size effect in a late comparison/decision stage. In addition to providing information about the number and durations of stages in associative recognition, our analysis sheds light on the event-related potential components implicated in the study of recognition memory. (PsycINFO Database Record


Figures

Figure 1
Figure 1
Illustration of the components in the approach developed for fMRI: (a) Brain signatures that define stages; (b) Distribution of stage durations in different conditions; (c) A swimlane representation of an ACT-R model with subgoals corresponding to the stages. The boxes in a row represent when a module is engaged.
Figure 2
Figure 2
(a) Stimulus-locked averages of the FZ and PZ electrodes (b) Response-locked averages of the FZ and PZ electrodes; (c) Topographic distribution of differences between conditions from 300–500 ms after the stimulus onset; (d) Topographic distribution of differences between conditions from −200 to 0 ms prior to response.
Figure 2
Figure 2
(a) Stimulus-locked averages of the FZ and PZ electrodes (b) Response-locked averages of the FZ and PZ electrodes; (c) Topographic distribution of differences between conditions from 300–500 ms after the stimulus onset; (d) Topographic distribution of differences between conditions from −200 to 0 ms prior to response.
Figure 3
Figure 3
Illustration of the Yeung et al. (2004, 2007) addition of a bump to an ongoing signal of sinusoidal noise.
Figure 4
Figure 4
An illustration of the 5-bump solution for the full data set: the scalp profiles of the 5 bumps and the distributions of the durations of the 6 flats for Fan 1 Targets. The individual blue line graphs are the probability distributions for the durations of the flats.
Figure 5
Figure 5
An illustration of the scalp profiles and mean durations between bumps for fits of 0 to 8 bump HSMMs to the data.
Figure 6
Figure 6
Mean improvement of multi-bump models (ranging from 1 to 8) over 0 bump model based on LOOCV.
Figure 7
Figure 7
(a) Standard deviation (+/− 1) in estimates of flat durations when fit to individual subjects. (b) Standard deviation (+/− 1) in estimates of scalp profiles when fit to individual subjects.
Figure 8
Figure 8
(a) Probability that the 5 bumps are centered on each time point of a prototypical trial. (b) The probability that various time points fall within each of the 6 stages for that trial.
Figure 9
Figure 9
Mean duration of the stages in the various conditions. Note that these values were obtained fitting the 5-bump HSMM to all the data (no separate parameter estimation per condition).
Figure 10
Figure 10
(a) Swimlane representation of the ACT-R retrieve-to-reject model for targets and re-paired foils. (b) Swimlane representation of the ACT-R model for new foils. Stage 1 is 85 ms (35 ms to trigger first production plus 50 ms for the production). Stage 2 and 3 are 95 ms (45 ms for visual encoding plus 50 ms for the production). Stage 4 is the retrieval time plus production time. Stage 5 in panel A is 250 ms in (200 ms for comparison plus 50 ms for the production). Stage 5 in panel B is 150 ms (100 ms for motor preparation plus 50 ms for the production). The final stage is 110 ms (50 ms to complete motor preparation and 60 ms for response execution).
Figure 11
Figure 11
(a) The predicted durations of the stages according to the ACT-R model. See text and Figure 10 for an explanation of these durations. (b) The estimated durations obtained by fitting targets and re-paired foils to a 5-bump HSMM separately for the 4 conditions and fitting new foils to a 4-bump HSMM (with the third bump excluded).
Figure 12
Figure 12
Average EEG data after warping every trial so that the maximum likelihood locations of the bumps correspond to the average locations for that condition. (a) The FZ electrode with all conditions starting from stimulus presentation. (b) The PZ electrode with all conditions ending with the response. The locations of the bumps are noted for the Re-paired 2 condition.
Figure 13
Figure 13
(a) Sternberg’s model of the working memory task; (b) the ACT-R model; and (c) How they map onto the 5 stages of a 4-bump model.
Figure 14
Figure 14
(a) The mean gain in log-likelihood per participant in LOOCV for multi-bump models (ranging from 0 to 6) over a 0-bump model. (b) The mean gain in LOOCV by allowing each stage of the 4-bump model to vary with set size versus a model in which all stage durations are constant across conditions.
Figure 15
Figure 15
Mean electrode activity reconstructed for the 4 bumps by averaging the observed voltages at the time of the maximum-likelihood samples for each bump and during each trial.
Figure 16
Figure 16
Mean stage durations for the Sternberg task as a function of set size.
Figure 17
Figure 17
Average FZ and PZ activity in the Sternberg experiment as a function of probe type (a) and set size (b). FZ and PZ activity after warping every trial so that the maximum likelihood locations of the bumps correspond to the average locations for that condition of probe type (c) and set size (d). The bumps are numbered in (c) and (d).
Figure 18
Figure 18
Normalized theta power at electrode P3 in the Sternberg experiment after warping every trial so that the maximum likelihood locations of the bumps correspond to the average locations for that condition. (a) Effect of set size. (b) Effect of Target versus foil. Locations of the bumps in each condition are indicated by circles.
Figure 19
Figure 19
(a) The scalp profiles corresponding to the states identified in Borst & Anderson (2015). (b) The final model proposed by Borst & Anderson (2015).

References

    1. Almeida D, Poeppel D. Word-specific repetition effects revealed by MEG and the implications for lexical access. Brain and Language. 2013;127(3):497–509. - PMC - PubMed
    1. Assecondi S, Bianchi AM, Hallez H, Staelens S, Casarotto S, Lemahieu I, Chiarenza GA. Automated identification of ERP peaks through Dynamic Time Warping: An application to developmental dyslexia. Clinical Neurophysiology. 2009;120(10):1819–1827. - PubMed
    1. Anderson JR. How Can the Human Mind Occur in the Physical Universe? New York: Oxford University Press; 2007.
    1. Anderson JR, Carter CS, Fincham JM, Qin Y, Ravizza SM, Rosenberg-Lee M. Using fMRI to test models of complex cognition. Cognitive Science. 2008;32(8):1323–1348. - PubMed
    1. Anderson JR, Fincham JM. Discovering the sequential structure of thought. Cognitive Science. 2014a;38(2):322–352. - PubMed