. 2016 Jul;17(7):797-805.
doi: 10.1038/ni.3423. Epub 2016 May 2.

Origin, fate and dynamics of macrophages at central nervous system interfaces

Affiliations

Origin, fate and dynamics of macrophages at central nervous system interfaces

Tobias Goldmann et al. Nat Immunol. 2016 Jul.

Abstract

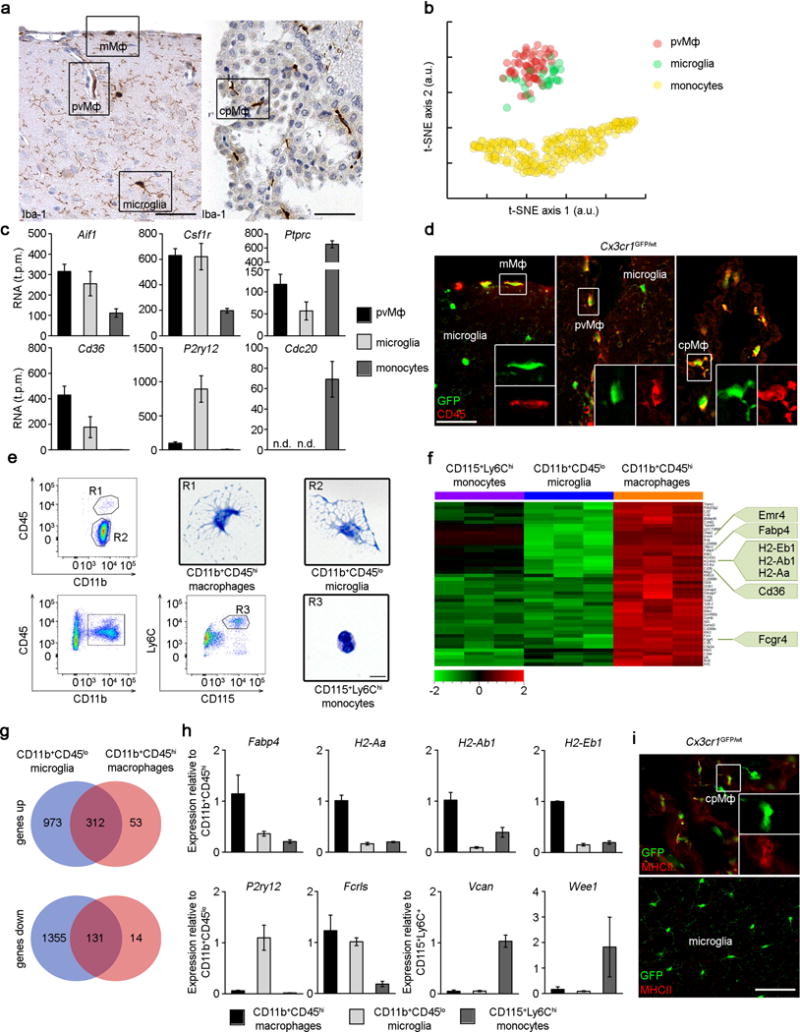
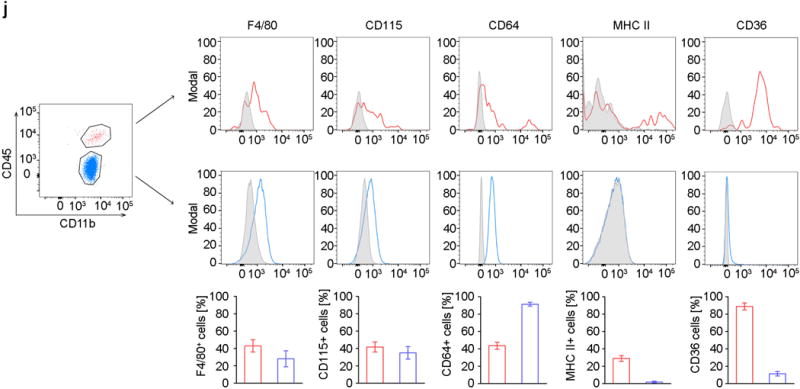
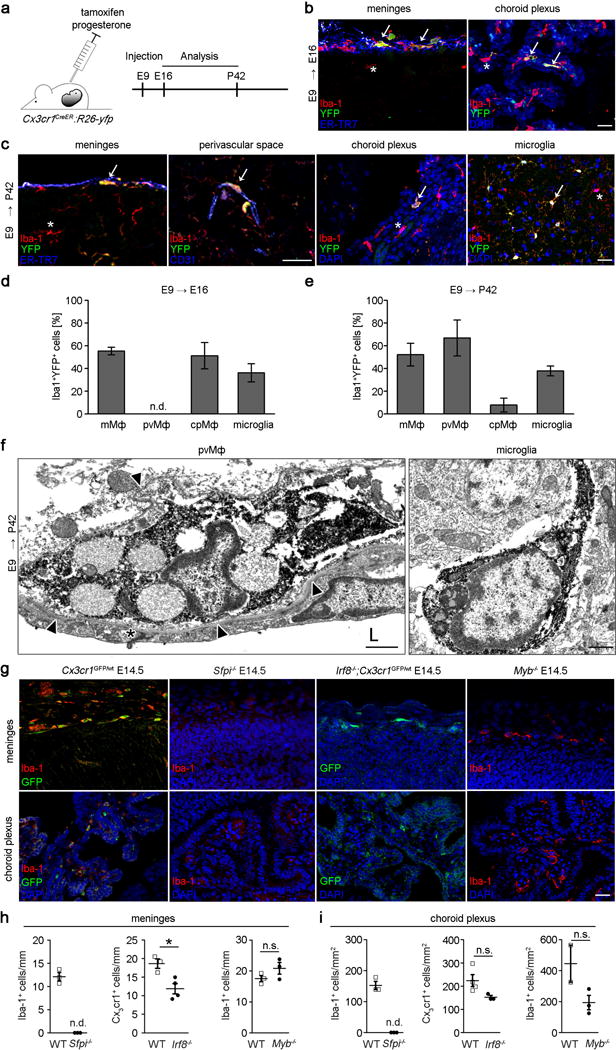
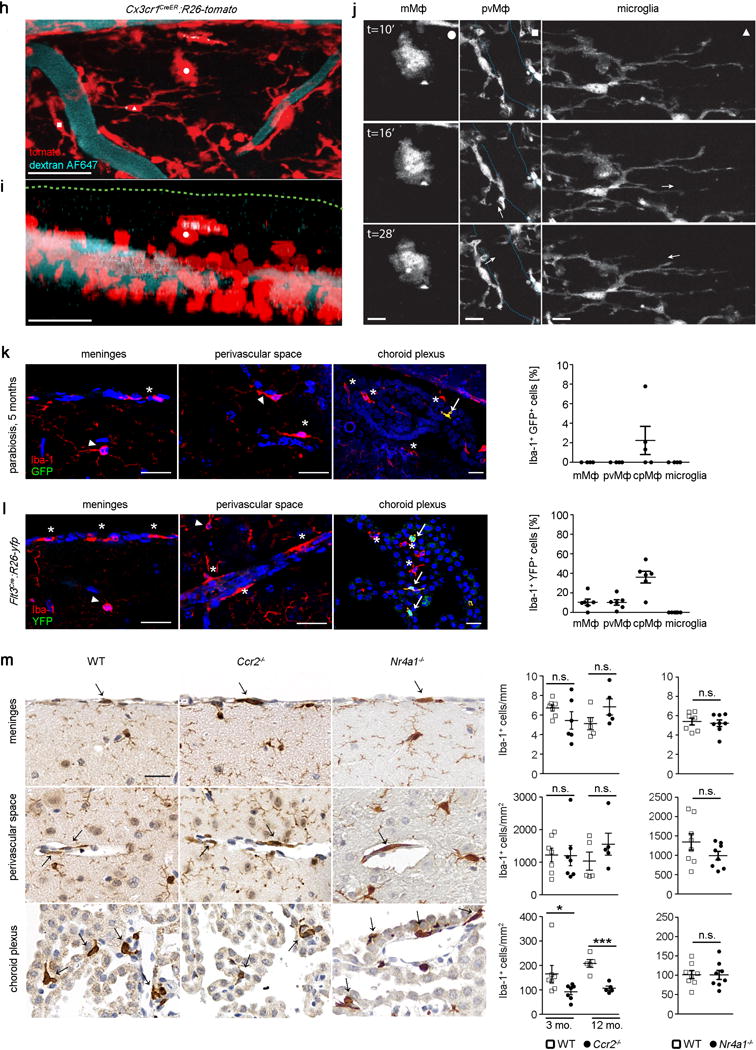
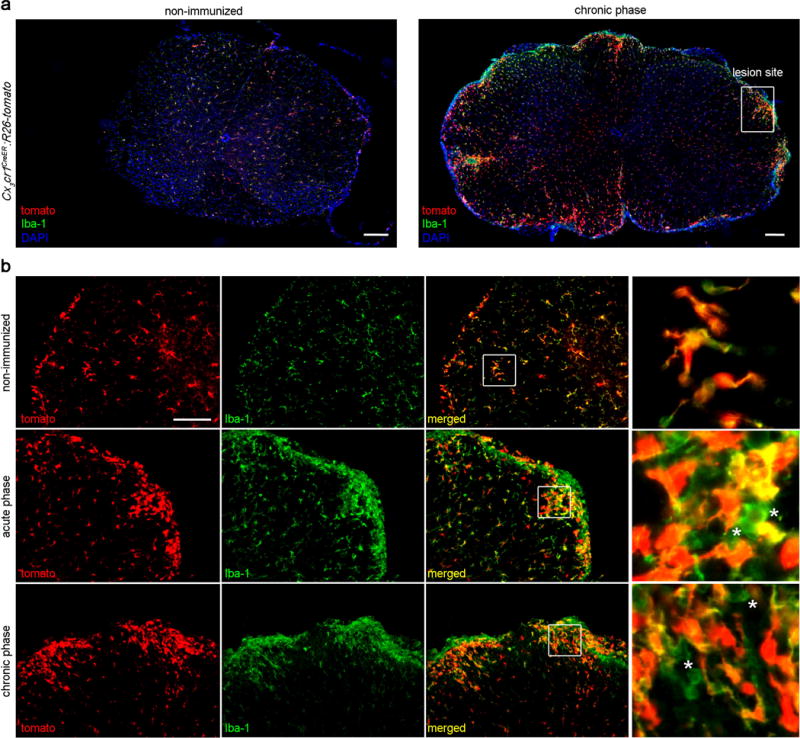
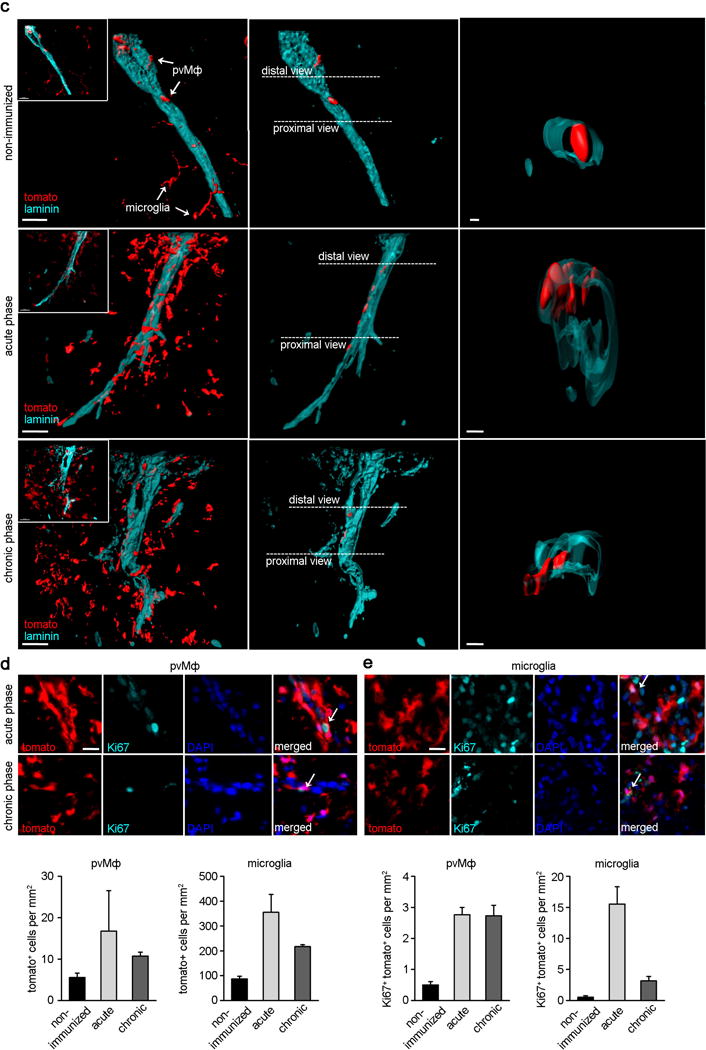
Perivascular, subdural meningeal and choroid plexus macrophages are non-parenchymal macrophages that mediate immune responses at brain boundaries. Although the origin of parenchymal microglia has recently been elucidated, much less is known about the precursors, the underlying transcriptional program and the dynamics of the other macrophages in the central nervous system (CNS). It was assumed that they have a high turnover from blood-borne monocytes. However, using parabiosis and fate-mapping approaches in mice, we found that CNS macrophages arose from hematopoietic precursors during embryonic development and established stable populations, with the notable exception of choroid plexus macrophages, which had dual origins and a shorter life span. The generation of CNS macrophages relied on the transcription factor PU.1, whereas the MYB, BATF3 and NR4A1 transcription factors were not required.


Figures

Figure 1
Figure 1. Molecular census of non-parenchymal macrophages, microglia and monocytes
a) CNS histology of the brain cortex (left) and choroid plexus (right) that were subjected to immunohistochemistry for Iba-1 to detect meningeal (mMΦ), perivascular (pvMΦ), choroid plexus (cpMΦ) macrophages and microglia. Scale bars: cortex = 50 μm, choroid plexus = 50 μm. Representative pictures of four examined mice are displayed. b) Cluster analysis of individual pvMΦ, cortical microglia and monocytes measured by single-cell RNA-sequencing and biclustering. c) Bar graphs for selected markers for individual pvMΦ (black), cortical microglia (grey) and monocytes (dark grey) evaluated by single cell RNA-seq. Bars represent means ± s.e.m. of single cells. d) Immunfluorescence microscopy for GFP (green) and CD45 (red). Overview and magnification are shown. Scale bar: 25 μm overview. At least three mice per group were analysed. e) Flow cytometry for to identify CNS macrophages (R1), microglia (R2) and monocytes (R3), respectively. Cytospins of isolated and May-Grünwald Giemsa-stained cells. Scale bar: 5 μm. Data are representative of two independent experiments. f) Affymetrix gene chip array-based heat map (standardized and scaled to log2 expression) of significantly induced transcripts in CD11b+CD45hi CNS macrophages compared to microglia and monocytes. Typical genes are highlighted. g) Venn diagram depicting the different regulated and overlapping between CD45hi macrophages and CD45lo microglia compared to Ly-6Chi monocytes. h) Quantitative RT-PCR of differentially regulated genes. Data are expressed as ratio of the mRNA expression compared to endogenous Gapdh relative to CD11b+CD45hi (top row), CD11b+CD45lo (bottom row, left) and Ly-6Chi monocytes (bottom row, right). Bars show mean ± s.e.m. At three to five samples per group were analysed. i) Immunfluorescence for MHC class II (red) on cpMΦ but not on microglia in Cx3cr1GFP/wt mice (green). Overview and magnification are shown. Scale bar: 25 μm (overview). At least three mice per group were analysed. j) Flow cytometric analysis of CNS macrophages and microglia. Characteristic histograms are depicted. Grey areas represent isotype controls. Five to eight independent experiments were performed. Bars represent the mean ± s.e.m of CD11b+CD45hi macrophages (red) and CD11b+CD45lo microglia (blue).
Figure 2
Figure 2. Ontogeny of brain macrophages at brain interfaces
a) Scheme for the induction of recombination (injection of tamoxifen [TAM]) and subsequent analysis in Cx3cr1CreER:R26-yfp animals. b,c) Representative sections of meninges, choroid plexus and perivascular spaces at defined time points in TAM-induced Cx3cr1CreER:R26-yfp animals using immunofluoresence for YFP (green), the microglia marker Iba-1 (red), 4′,6-diamidino-2-phenylindole (DAPI, blue), CD31 (blue) or the fibroblast marker ER-TR7 (blue), respectively. Arrows highlight YFP+Iba-1+double positive cells. Scale bar = 25 μm. d, e) Quantitative analysis of regional yfp expression in Iba-1+ macrophages in TAM-induced Cx3cr1CreER:R26-yfp mice at indicated time points. Data are expressed as mean ± s.e.m. At least three mice per group were analysed. N.d.= not detectable. f) Immunolectron microscopy for yfp in pvMΦ and microglia at postnatal day (P) 60 in E9 TAM-induced Cx3cr1CreER:R26-yfp mice. Arrow heads indicate endothelial basal lamina surrounding the pvMΦ. Asterisk specifies endothelial tight junction. L = vessel lumen. Scale bar = 1 μm. Representative pictures of three mice examined are displayed. g) Iba-1 immunofluorescence (red) of macrophages in the absence of the respective transcription factors. Alternatively, GFP+ macrophages (green) on the Cx3cr1GFP/wt back ground are shown. DAPI (blue) Scale bar = 25 μm. h, i) Quantitative examination of Iba-1+ or Cx3cr1GFP/wt macrophages at embryonic day E14.5. Each symbol represents the mean measurement of one mouse. Three sections from at least two mice were examined for each group. N.s. = not significant, *P < 0.05.
Figure 3
Figure 3. Maintenance of non-parenchymal macrophages in adulthood
a) Scheme and time line for labelling and analyses of pvMΦ, mMΦ and cpMΦ in adulthood using TAM injection in adult Cx3cr1CreER:R26-yfp animals. b) Persistence of labelled yfp+CD11b+CD45hi macrophages in adult Cx3cr1CreER:R26-yfp mice. Representative flow cytometric images of five investigated mice are displayed. c) Representative immunofluorescence for yfp (green), CD45 (red) and DAPI (blue) in pvMΦ, mMΦ and cpMΦ in adult Cx3cr1CreER:R26-yfp mice 30 weeks after TAM application. Scale bars = 25 μm. At least three mice per group were analysed. d) Kinetics of yfp labelling in Iba-1+ pvMΦ, mMΦ and cpMΦ in adult Cx3cr1CreER:R26-yfp animals upon TAM application. Left: Characteristic brain sections are shown. Scale bars = 25 μm. Right: Quantification thereof. Asterisks indicate single positive cells, arrows label double positive cells. Data represent mean ± s.e.m. of at least three mice per group. e) Localization of tomato+pvMΦ (red) in the vascular compartment using confocal microscopy (left) and 3D-reconstruction (middle, right) in adult Cx3cr1CreER:R26-tomato animals 8 weeks after TAM injection using laminin (green) to indicate the basal lamina and nuclear staining (DAPI, blue). Arrow heads and arrow point the respective structures. Scale bars = 10 μm, (overview), 5 μm (zoom). Three mice were investigated and typical pictures are shown. f) Quantification of tomato labelling 8 weeks after TAM application. Data represent mean ± s.e.m. of at least three mice per group. g) Immuno-EM for yfp in Cx3cr1CreER:R26-yfp animals 30 weeks after TAM application reveals positively labelled mMΦ and cpMΦ. Arrow heads point the basal lamina. Arrow indicates Kolmer’s epiplexus cell. Asterisk designates microvilli of the choroid plexus epithelium. E = epithelium. Scale bar1 = 1 μm (left) 2 μm (right). h) Confocal projection of the dorsal spinal surface of a Cx3cr1CreER:R26-tomato mice (tomato, red) at 8 weeks after TAM and injected with dextran-AF647 (blue) to reveal the vasculature. An example of a pvMΦ was marked by a white square, a microglial cell by a white triangle, and a mMΦ by a white circle. Scale bar = 25 μm. i) Z-projection of the confocal image stack shown in (h) that illustrates the localization of the different myeloid cell populations. Green dotted line represents upper limit of the dura membrane as inferred by in vivo staining with Nuclear-ID blue dye (not shown). Scale bar = 25 μm. j) In vivo 2-photon time-lapse of the myeloid cells marked in illustrating the dynamic behaviour of a mMΦ (left panel), a pvMΦ (middle panel) and a microglia cell (right panels). White arrows indicate examples and direction of dynamic changes in the middle and left panels. The cyan dotted line in the middle panel indicates the outline of the vasculature. Scale bars = 1 μm, left panels; 1.2 μm, middle panels and 2.4 μm, right panels. k) Negligible exchange of pvMΦ, mMΦ and cpMΦ in a wild-type parabiont after 5 months of parabiosis with an ActinGFP/wt mouse. Left: representative immunofluorescence pictures. Scale bar = 25 μm. Asterisks indicate single positive cells arrows label double positive cells. Right: quantification thereof. Arrow heads point to microglia. One symbol represents one mouse with quantification of a minimum of three tissue sections. Data represent means ± s.e.m. of at least three animals per group. l) Little Flt3 expression as marker of definitive hematopoiesis in pvMΦ, mMΦ and cpMΦ in adult Flt3Cre:R26-yfp mice. Left: representative immunofluorescence pictures. Asterisks indicate single positive cells arrows label double positive cells. Arrow heads point to microglia. Scale bar = 25 μm. Right: quantification thereof. Each symbol represents one mouse with quantification of a minimum of three tissue sections. Data represent means ± s.e.m. of at least three animals per group. m) Localization and presence of pvMΦ, mMΦ and cpMΦ in adult wild-type (WT), Ccr2−/− and Nr4a1−/− mice evaluated using Iba-1 immunohistochemistry. Representative figure are presented (left) and quantification (right). Each symbol represents one mouse with quantification of a minimum of three tissue sections. Data represent means ± s.e.m. of at least five animals per group. N.s. = not significant. Significant differences were with asterisks (*P < 0.05, ***P < 0.001).
Figure 4
Figure 4. Self-renewal of pvMΦ during autoimmune inflammation
a) Representative images of the spinal cord from Cx3cr1CreER:R26-tomato mice that were either not immunized with MOG35–55 (left) or were immunized (right, chronic phase, 30 days post immunization [dpi]). Spinal cord sections were immunreactive for the mature macrophage and microglia marker Iba-1 (green) and nuclear maker DAPI (blue). Tomato, which identifies long-living CX3CR1+ pvMΦ and microglia, is shown in red. Scale bar =100 μm. b) Magnification thereof. Acute phase sections represent mice around 16 dpi during EAE. Note that no infiltration of Iba-1-single positive cell was detected in healthy spinal cord. In contrast, during EAE the amount of Iba-1+ myeloid cells strongly increased containing Iba-1+tomato infiltrating monocytes or Iba-1+tomato+ pvMΦ and microglia. Scale bars = 100 μm (overview) and 10 μm (insert). c) Kinetics of pvMΦ and microglia expansion in Cx3cr1CreER:R26-tomato mice that were healthy (upper row) or subjected to EAE (lower rows). Representative high-magnification confocal images of spinal cord sections immunoreactive with laminin to visualize the basal membranes are shown. Note the overall increase of all tomato+ myeloid cells during EAE (left column) and just of tomato+ pvMΦ around the vessels (middle column). Right column: high magnification depicting tomato+ pvMΦ (red) and laminin (turquoise). Scale bars = 30 μm (overview) and 5 μm (insert). d) Representative high-magnification images of spinal cord sections from diseased Cx3cr1CreER:R26-tomato mice immunoreactive for Ki67 (turquoise) and the nuclear marker DAPI (blue). Tomato+ pvMΦ (red) around the vessels were positive for the proliferation marker Ki67 (arrow, left images) as well as parenchymal microglia (arrow, right images). Scale bar = 10 μm. e) Left: Numbers of resident pvMΦ (tomato+ cells found within the perivascular space) and microglia (tomato+ cells found in the parenchyma) in the spinal cord at different time points of disease. Right: Kinetics of Ki67-positive pvMΦ and microglia during EAE. Bars represent mean ± s.e.m. of at least two mice per group.

Comment in

References

    1. Ransohoff RM, Cardona AE. The myeloid cells of the central nervous system parenchyma. Nature. 2010;468:253–262. - PubMed
    1. Prinz M, Priller J, Sisodia SS, Ransohoff RM. Heterogeneity of CNS myeloid cells and their roles in neurodegeneration. Nat Neurosci. 2011;14:1227–1235. - PubMed
    1. Prinz M, Priller J. Microglia and brain macrophages in the molecular age: from origin to neuropsychiatric disease. Nat Rev Neurosci. 2014;15:300–312. - PubMed
    1. Alliot F, Godin I, Pessac B. Microglia derive from progenitors, originating from the yolk sac, and which proliferate in the brain. Brain Res Dev Bra in Res. 1999;117:145–152. - PubMed
    1. Ginhoux F, et al. Fate mapping analysis reveals that adult microglia derive from primitive macrophages. Science. 2010;330:841–845. - PMC - PubMed

Publication types