Comparative Study
. 2016 Jul;17(7):878-87.
doi: 10.1038/ni.3445. Epub 2016 May 2.

Expression profiling of constitutive mast cells reveals a unique identity within the immune system

Collaborators, Affiliations
Comparative Study

Expression profiling of constitutive mast cells reveals a unique identity within the immune system

Daniel F Dwyer et al. Nat Immunol. 2016 Jul.

Abstract

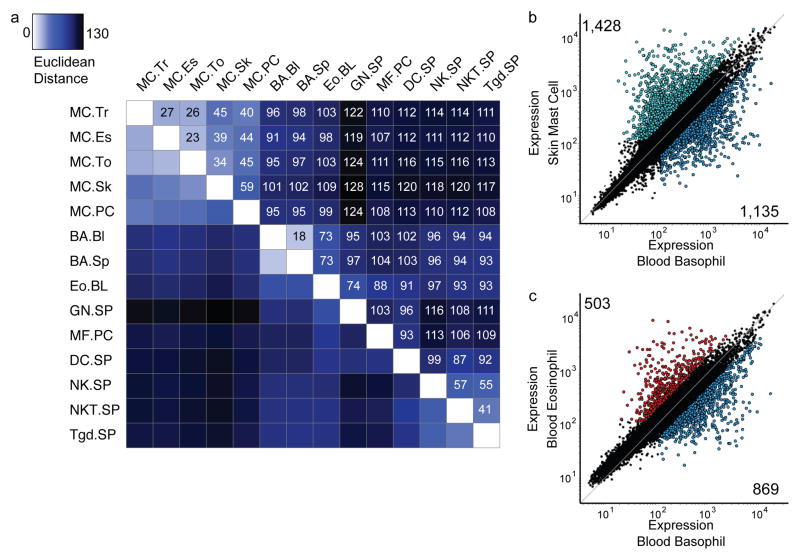
Mast cells are evolutionarily ancient sentinel cells. Like basophils, mast cells express the high-affinity receptor for immunoglobulin E (IgE) and have been linked to host defense and diverse immune-system-mediated diseases. To better characterize the function of these cells, we assessed the transcriptional profiles of mast cells isolated from peripheral connective tissues and basophils isolated from spleen and blood. We found that mast cells were transcriptionally distinct, clustering independently from all other profiled cells, and that mast cells demonstrated considerably greater heterogeneity across tissues than previously appreciated. We observed minimal homology between mast cells and basophils, which shared more overlap with other circulating granulocytes than with mast cells. The derivation of mast-cell and basophil transcriptional signatures underscores their differential capacities to detect environmental signals and influence the inflammatory milieu.


Conflict of interest statement

The authors have no competing financial interest

Figures

Figure 1
Figure 1
Identification of mast cells as distinct from other assayed cell populations. (a) Relative concentrations of mast cells (MC) and basophils (Ba) in digested tissue as a percentage of CD45+ cells. Mean ± sd. Data are combined from 3 (peritoneal mast cell, spleen basophil), 4 (skin mast cell, tongue mast cell) or 5 (trachea mast cell, esophagus mast cell, blood basophil) independent experiments. (b) Chloracetate esterase (CAE) staining of mast cells sorted from trachea, esophagus tongue, ear skin, peritoneal lavage and toluidine blue staining of basophils sorted from spleen confirming gating strategy used to isolate cell populations. Scale bar indicates 10 μm. (c) Hierarchical clustering of indicated cell populations using the top 15% most variable transcripts. Cell populations denoted using standard ImmGen abbreviations include trachea mast cells (MC.Tr), tongue mast cells (MC.To), esophagus mast cells (MC.Es), skin mast cells (MC.Sk), peritoneal mast cells (MC.PC), blood basophils (BA.Bl), spleen basophils (BA.Sp), blood eosinophils (Eo.Bl), spleen neutrophils (GN.Sp), peritoneal macrophages (MF.PC), spleen dendritic cells (DC.Sp), peritoneal B1a B cells (B1ab.PC), splenic B2 B cells (BB.Sp), splenic natural killer cells (NK.Sp), splenic NK T cells (NKT.Sp), splenic γδ T cells (Tgd.Sp), splenic CD8+ T cells (T8.Sp), splenic CD4+ T cells (T4.Sp) and splenic regulatory T cells (Treg.Sp). Bar height is inversely correlated to homology between linked populations. (d) Principal component analysis of cell populations indicated in (c) using the top 15% most variable transcripts. Numbers in parentheses indicate percentage of transcripts described by each principal component. Data (c–d) are from n = 3 independent experiments (skin, tongue, and trachea mast cells, spleen and blood basophils), from n = 5 independent experiments from peritoneal mast cells, and from n = 2 independent experiments from esophagus mast cells.
Figure 2
Figure 2
Characterization of mast cells as transcriptionally distinct from basophils. (a) Euclidean distance matrix indicating degree of similarity between selected cell populations calculated using the top 15% most variable genes determined in Fig. 1c. Numbers in boxes indicate Euclidean distance. (b) Gene expression in skin mast cells and spleen basophils. Colored dots indicate transcripts expressed at two-fold or greater levels in skin mast cells (aqua) or spleen basophils (dark blue) and with expression values greater 120. Numbers indicate total genes enriched in each population. (c) Gene expression in blood eosinophils and spleen basophils. Colored dots indicate transcripts expressed at two-fold or greater levels in blood eosinophils (red) or spleen basophils (dark blue) and with expression values greater than 120. Numbers indicate total genes differentially expressed in each population. Data are combined from independent experiments as per Fig. 1c,d.
Figure 3
Figure 3
Derivation of the mast cell transcriptional signature. (a) Mast cell-specific gene signature derived based on two-fold or greater transcript expression levels in all mast cell populations compared to all other analyzed cell populations. Highlighting indicates five-fold (purple) or ten-fold (red) higher expression levels in all mast cell subsets compared to all other cell populations. (b) Protease transcripts specifically enriched in the mast cell signature. (c) Mas-related G protein receptor transcript expression across analyzed cell populations. Data are combined from independent experiments as per Fig. 1c,d.
Figure 4
Figure 4
Distinct and shared transcriptional expression patterns between basophils and mast cells. (a) Basophil-specific gene signature derived based on two-fold or greater transcript expression levels in both basophil populations compared to all other analyzed cell populations. Highlighting indicates five-fold (purple) or ten-fold (red) higher expression. (b) Shared mast cell and basophil gene signature derived based on two-fold or greater transcript expression levels in all mast cell and basophil populations compared to all other analyzed cell populations. Red highlighting indicates ten-fold higher expression. (c) Transcripts involved in monoamine biosynthesis and neurotransmitter receptors expressed in mast cells or basophils. All transcripts aside from Hdc were included in either the mast cell-specific signature or the shared mast cell and basophil signature. (d) Transcription factors present in the distinct and shared mast cell and basophil gene signatures. Data are combined from independent experiments as per Fig. 1c,d.
Figure 5
Figure 5
Enrichment of human mast cells in the murine mast cell signature. Relative expression (log2fold) for all 10,773 transcripts represented in both the ImmGen consortium data set (mouse) and the FANTOM consortium data sets (human). Expression (log2fold) in human skin mast cells relative to blood basophils, X axis; expression (log2fold) in mouse skin mast cells relative to blood basophils, Y axis. Blue line indicates two-fold relative expression. Human mast cells are statistically enriched (P=5.5e–16) in the murine mast cell signature (82 transcripts, red) and in the shared mast cell and basophil signature (17 transcripts, green) (P=0.0028, hypergeometric cumulative distribution upper tail). Human blood basophils are not enriched in the murine basophil signature (44 transcripts, blue) (P=0.33). Data from murine skin mast cells are from 3 independent experiments. Data from human skin mast cells was derived from 3 independent donors.
Figure 6
Figure 6
Tissue-specific mast cell gene expression. (a–c) Differential gene expression between mast cell subsets. Colored dots indicate transcripts expressed at two-fold or greater levels and at expression levels greater than 120 in tongue mast cells (light green), trachea mast cells (dark green), esophagus mast cells (pink), peritoneal mast cells (turquoise) or skin mast cells (aqua). Numbers indicate total genes enriched in each population. (d–g) Transcripts expressed at least four-fold higher or lower levels in (d) esophagus mast cells, (e) tracheal mast cells, (f) peritoneal mast cells, or (g) skin mast cells than in any other mast cell population. (h) Flow cytometric validation of differential gene expression suggested by transcript data. Grey solid histogram indicates isotype control staining, black histogram indicates cell surface protein expression in the indicated mast cell population. Flow plots are representative of three independent experiments. Data (a–g) are combined from independent experiments as per Fig. 1c,d.
Figure 7
Figure 7
Transcriptional analysis predicts peritoneal mast cell turnover. (a) GSEA Identification of Mitosis and M phase GO Terms as significantly enriched in digest enzyme-treated peritoneal cavity mast cells compared to skin mast cells. Both terms enriched with a nominal P-value <0.001 with a false discovery rate Q-value<0.005. (b) Intracellular Ki67 expression in peritoneal and skin mast cells. Results representative of three independent experiments with a total of n-9 mice per group. (c) Quantification of Ki67+ mast cells found in peritoneum and skin. * indicates P=0.0000062 (two-tailed unpaired t test with Welch’s correction). Data are combined from three independent experiments with a total of n=9 mice per group. Dots show individual data points, lines indicate mean ± sd.

References

    1. Heng TS, Painter MW Immunological Genome Project, C. The Immunological Genome Project: networks of gene expression in immune cells. Nat Immunol. 2008;9:1091–1094. - PubMed
    1. Voehringer D. Protective and pathological roles of mast cells and basophils. Nat Rev Immunol. 2013;13:362–375. - PubMed
    1. Cavalcante MC, et al. Occurrence of heparin in the invertebrate styela plicata (Tunicata) is restricted to cell layers facing the outside environment. An ancient role in defense? J Biol Chem. 2000;275:36189–36186. - PubMed
    1. Wong GW, et al. Ancient origin of mast cells. Biochem Biophys Res Commun. 2014;451:314–318. - PMC - PubMed
    1. Metcalfe DD, Baram D, Mekori YA. Mast cells. Physiol Rev. 1997;77:1033–1079. - PubMed

Publication types

Substances