. 2016 Jun;22(6):632-40.
doi: 10.1038/nm.4092. Epub 2016 May 2.

An oncogenic Ezh2 mutation induces tumors through global redistribution of histone 3 lysine 27 trimethylation

Affiliations

An oncogenic Ezh2 mutation induces tumors through global redistribution of histone 3 lysine 27 trimethylation

George P Souroullas et al. Nat Med. 2016 Jun.

Erratum in

Abstract

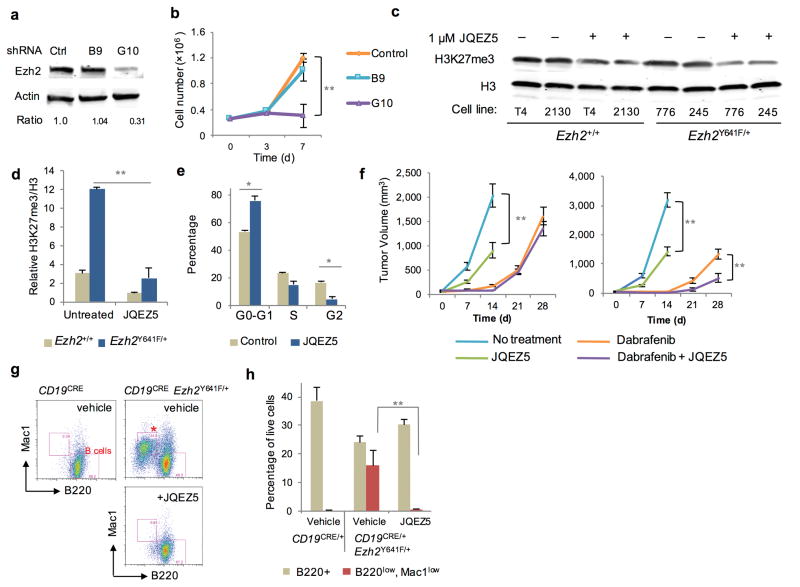
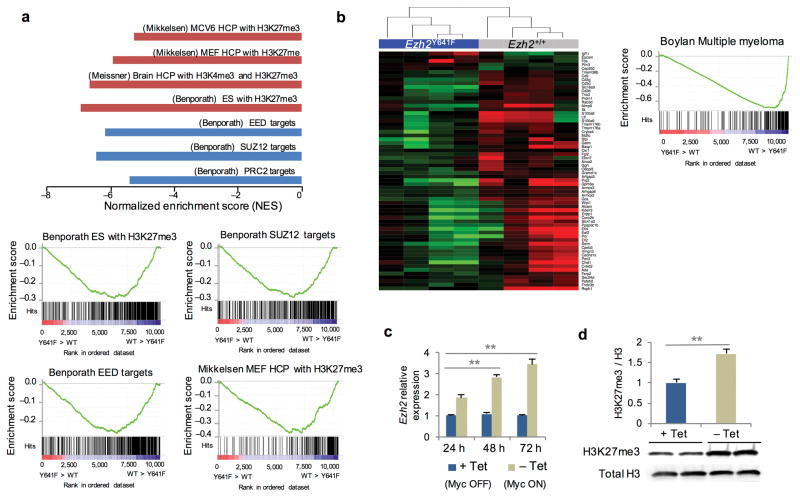
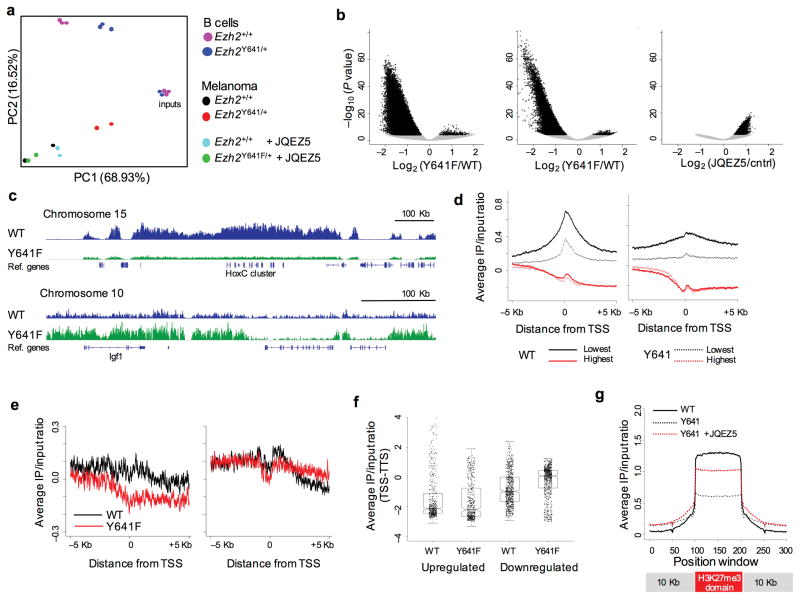
B cell lymphoma and melanoma harbor recurrent mutations in the gene encoding the EZH2 histone methyltransferase (EZH2), but the carcinogenic role of these mutations is unclear. Here we describe a mouse model in which the most common somatic Ezh2 gain-of-function mutation (EZH2(Y646F) in human; Ezh2(Y641F) in mouse) is conditionally expressed. Expression of Ezh2(Y641F) in mouse B cells or melanocytes caused high-penetrance lymphoma or melanoma, respectively. Overexpression of the anti-apoptotic protein Bcl2, but not the oncoprotein Myc, or loss of the tumor suppressor protein p53 (encoded by Trp53 in mice) further accelerated lymphoma progression. Expression of the mutant Braf but not the mutant Nras oncoprotein further accelerated melanoma progression. Although expression of Ezh2(Y641F) globally increased the abundance of trimethylated Lys27 of histone H3 (H3K27me3), it also caused a widespread redistribution of this repressive mark, including a loss of H3K27me3 that was associated with increased transcription at many loci. These results suggest that Ezh2(Y641F) induces lymphoma and melanoma through a vast reorganization of chromatin structure, inducing both repression and activation of polycomb-regulated loci.


Figures

Figure 1
Figure 1. Design, oncogenic activity and genetic interactions of the Ezh2Y641F allele in B-cells
a. Schematic of Ezh2Y641F targeting strategy. * denotes Y641F mutation in exon 16. b. Western blot analysis and quantification of total H3 and H3K27me3 in CD19CRE/+Ezh2+/+ vs CD19CRE/+Ezh2Y641F/+ mice. Error bars show standard error of the mean (SEM) for four independent experiments. c. Kaplan-Meier analysis of lymphoma-free survival of littermate CD19CRE/+ vs CD19CRE/+Ezh2Y641F/+ mice. Median cancer-free survival of CD19CRE/+Ezh2Y641F/+ mice is 383 days (P < 0.001, calculated using a log rank test). d. Peripheral blood FACS analysis of CD45.1 recipient mice 6 weeks after transplantion of 100,000 CD19+ cells from lymphoma-bearing CD19CRE/+Ezh2Y641F/+ CD45.2 animals. e. Kaplan-Meier analysis of cancer-free survival of the transplant recipient mice. Donor CD19CRE/+Ezh2Y641F/+ CD45.2 Sca1+ hematopoietic progenitors were transduced as indicated and adoptively transferred into sub-lethally irradiated CD45.1 recipient mice. P values were calculated using a log rank test. f. Kaplan-Meier analysis of lymphoma-free survival of CD19CRE/+p53L/L with Ezh2+/+ vs Ezh2 Y641F/+ mice. Median survival for CD19CRE/+p53L/LEzh2Y641F/+ mice is 159 days (P < 0.001, calculated using a log rank test). g. Enlarged spleens and lymph nodes from CD19Cre+ (+/+), CD19CRE/+Ezh2Y641F/+ (F/+) and CD19CRE/+Ezh2Y641F/Y641F (F/F) mice. h. Representative FACS analyses of peripheral blood from (g). Circles indicates the abnormal lymphoid population. i. Western blot analysis and quantification of total H3 and H3K27me3 in control, heterozygous and homozygous Ezh2Y641F mice. Error bars show the SEM calculated from three different western blots using separate biological samples. ** P < 0.01.
Figure 2
Figure 2. Mutant Ezh2Y641F genetically interacts with mutant B-RafV600E but not N-RasQ61R to induce melanoma
a. Kaplan-Meier analysis of melanoma-free survival by indicated B-Raf and Pten genotypes. P values are for the indicated pair-wise comparisons, calculated using a log rank test. b and c. Representative tumor and histological images from tamoxifen-treated B-RafV600EEzh2Y641F mouse. Scale bars as indicated. d. Kaplan-Meier analysis of melanoma-free survival by indicated N-Ras and p16INK4a genotypes. P values are for the indicated pair-wise comparisons, calculated using a log rank test e. p16INK4a expression in primary human melanocytes transduced with lentiviruses expressing the indicated genes. Averages and SEM from three independent experiments. ** P < 0.01 f. EZH2 expression in primary human melanocytes transduced with lentiviruses expressing the indicated genes. Averages and SEM from three independent experiments. g. Western blot analysis and quantification of total H3 and H3K27me3 levels in primary human melanocytes transduced with lentiviruses expressing the indicated genes. Representative plot from three independent experiments.
Figure 3
Figure 3. Ezh2 inhibitors demonstrate anti-neoplastic activity in Ezh2Y641F-mutant cancers
a. Western blot demonstrating Ezh2 knock-down in a mouse Ezh2Y641F/+ melanoma cell line. Control represents scramble shRNA, while significant knock-down was observed with clone G10. b. Growth curve after Ezh2 knock-down in a representative mouse Ezh2Y641F/+ melanoma cell line carried out in triplicate. (Control vs G10, ** P <0.01) c. Total H3 and H3K27me3 western blots of melanoma cell lines of the indicated Ezh2 genotype grown in the presence or absence of 1μM JQEZ5. d. Quantification of the Western analysis in (c). Averages and SEM of three independent experiments. ** P <0.01 e. Cell cycle analysis of three Ezh2 mutant melanoma cell lines cultured for 72 hours in the presence or absence of 1μM Ezh2 inhibitor JQEZ5. * P < 0.05 f. Melanoma tumor volume progression in mice transplanted with Ezh2+/+ (left) vs Ezh2Y641F/+ (right) tumor lines. Mice were treated with Dabrafenib, JQEZ5 or a combination of the two once tumors reached 10 mm3 in size. (n = 8 tumors per group, **P < 0.01) g. Representative flow analysis of the spleens of CD19CRE/+ or CD19CRE/+Ezh2Y641F/+ mice. Mice were treated with either vehicle or JQEZ5 for 1 week after they developed symptoms of lymphoma. Cells were gated on CD19+ cells. Red star indicates the malignant B220lowMac1low population. h. Quantification of FACS analysis in (g). Error bars show the SEM (n = 5 mice per group, ** P < 0.01).
Figure 4
Figure 4. Gene expression in Ezh2Y641F reflects enrichment for PRC2 targets, H3K27me3-suppressed genes and a C-MYC signature
a. Gene set enrichment analysis (GSEA) in melanoma cell lines expressing Ezh2+/+ or Ezh2Y641F/+. Select significantly enriched gene set plots at P < 0.01 and false discovery rate (FDR) < 0.01 are shown with their respective normalized enrichment score (NES). b. GSEA and heat map comparing expression of genes downregulated in BCL2L1/MYC-driven myeloma to RNA-seq results of Ezh2Y641F mutant versus wild-type splenic B-cells. Transcripts repressed by C-MYC in myeloma are also repressed by Ezh2 activation in primary B-cells. c. EZH2 expression in P493-6 lymphoma cells before and after activation of MYC. Average of three independent experiments. d. Western blot analysis and quantification of total H3 and H3K27me3 performed on P493-6 cells before and 72h after activation of C-MYC. Error bars reflect the SEM calculated from three different western blots using separate biological samples. ** P < 0.01.
Figure 5
Figure 5. Ezh2Y641F changes the genomic distribution and dynamics of H3K27me3
a. Principal component analysis of B-cell and melanoma ChIP-seq data. b. Volcano plot of H3K27me3 ChIP-seq data displaying the log2 ratio of Ezh2Y641F/+ over Ezh2+/+ signals for each peak (x-axis, log2 values) vs the significance of the differences (y-axis, −log10 P values). Left – B-cells, Center – melanoma cells, Right –melanoma cells + JQEZ5. The volcano plot on the right displays the log2 ratio of JQEZ5-treated over vehicle-treated melanoma cells. c. Representative loci showing decreased H3K27me3 at the HoxC locus in B-cells (upregulated), and the Igf1 locus in melanoma cell lines (downregulated). d. Analysis of H3K27me3 signal at 5 kb upstream and downstream of transcriptional start sites of the bottom 25% (black) and top 25% (red) of genes based on expression in B-cells (left) and melanoma cells (right). e. Analysis of H3K27me3 signal at 5 kb upstream and downstream of transcriptional start sites of the significantly upregulated (left) and downregulated (right) genes in melanoma samples in the presence of Ezh2Y641F. f. Summary of H3K27me3 signal within gene bodies (TSS–TTS) of upregulated and downregulated genes in the presence of Ezh2+/+ vs Ezh2Y641F in melanoma cells. g. Meta-analysis of the amplitude and distribution of H3K27me3 signal over broad H3K27me3 domains identified in Ezh2+/+ melanoma cells. One-hundred variable-width windows cover the peak regions, and one-hundred 100-bp windows cover the 10 kb flanking these regions. H3K27me3 signal is summarized for Ezh2+/+, Ezh2Y641F/+ and Ezh2Y641F/+ + JQEZ5 in melanoma cells.

References

    1. Bernstein BE, et al. A bivalent chromatin structure marks key developmental genes in embryonic stem cells. Cell. 2006;125:315–326. - PubMed
    1. Boyer LA, et al. Polycomb complexes repress developmental regulators in murine embryonic stem cells. Nature. 2006;441:349–353. - PubMed
    1. Bracken AP, Dietrich N, Pasini D, Hansen KH, Helin K. Genome-wide mapping of Polycomb target genes unravels their roles in cell fate transitions. Genes & development. 2006;20:1123–1136. - PMC - PubMed
    1. Bracken AP, et al. The Polycomb group proteins bind throughout the INK4A-ARF locus and are disassociated in senescent cells. Genes & development. 2007;21:525–530. - PMC - PubMed
    1. Kotake Y, et al. pRB family proteins are required for H3K27 trimethylation and Polycomb repression complexes binding to and silencing p16INK4alpha tumor suppressor gene. Genes & development. 2007;21:49–54. - PMC - PubMed

MeSH terms