. 2016 Jun;22(6):672-8.
doi: 10.1038/nm.4097. Epub 2016 May 2.

Modulation of splicing catalysis for therapeutic targeting of leukemia with mutations in genes encoding spliceosomal proteins

Affiliations

Modulation of splicing catalysis for therapeutic targeting of leukemia with mutations in genes encoding spliceosomal proteins

Stanley Chun-Wei Lee et al. Nat Med. 2016 Jun.

Erratum in

Abstract

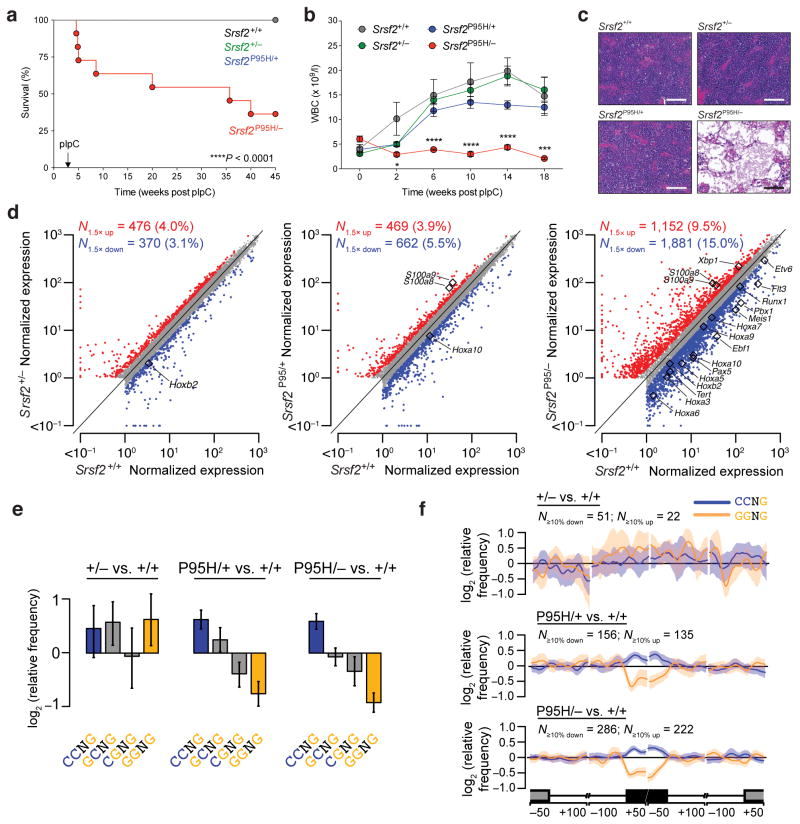
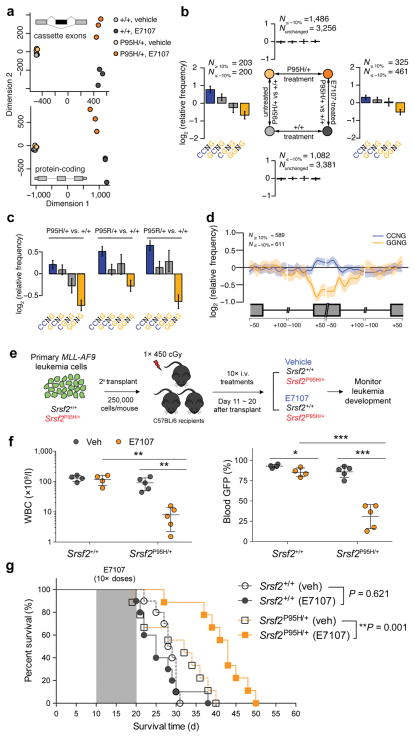
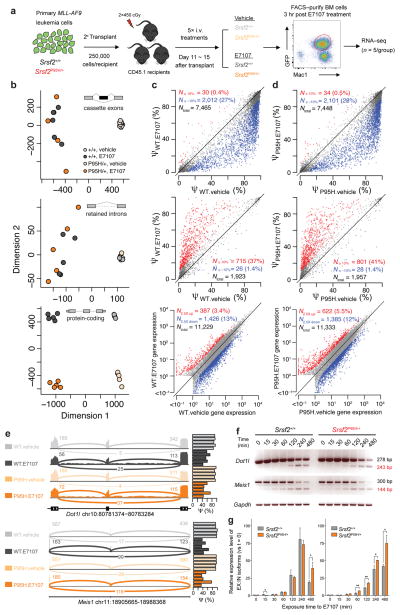
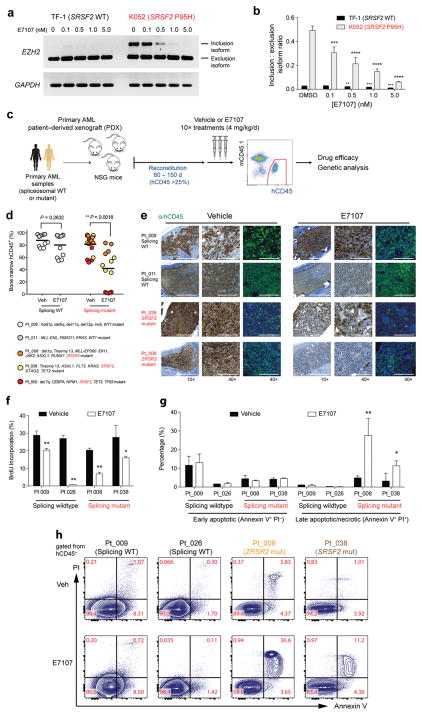
Mutations in genes encoding splicing factors (which we refer to as spliceosomal genes) are commonly found in patients with myelodysplastic syndromes (MDS) and acute myeloid leukemia (AML). These mutations recurrently affect specific amino acid residues, leading to perturbed normal splice site and exon recognition. Spliceosomal gene mutations are always heterozygous and rarely occur together with one another, suggesting that cells may tolerate only a partial deviation from normal splicing activity. To test this hypothesis, we engineered mice to express a mutated allele of serine/arginine-rich splicing factor 2 (Srsf2(P95H))-which commonly occurs in individuals with MDS and AML-in an inducible, hemizygous manner in hematopoietic cells. These mice rapidly succumbed to fatal bone marrow failure, demonstrating that Srsf2-mutated cells depend on the wild-type Srsf2 allele for survival. In the context of leukemia, treatment with the spliceosome inhibitor E7107 (refs. 7,8) resulted in substantial reductions in leukemic burden, specifically in isogenic mouse leukemias and patient-derived xenograft AMLs carrying spliceosomal mutations. Whereas E7107 treatment of mice resulted in widespread intron retention and cassette exon skipping in leukemic cells regardless of Srsf2 genotype, the magnitude of splicing inhibition following E7107 treatment was greater in Srsf2-mutated than in Srsf2-wild-type leukemia, consistent with the differential effect of E7107 on survival. Collectively, these data provide genetic and pharmacologic evidence that leukemias with spliceosomal gene mutations are preferentially susceptible to additional splicing perturbations in vivo as compared to leukemias without such mutations. Modulation of spliceosome function may thus provide a new therapeutic avenue in genetically defined subsets of individuals with MDS or AML.


Conflict of interest statement

Competing financial interests

M.T., J.P., S.B., and P.G.S. are employees of H3 Biomedicine, Inc.

Figures

Figure 1
Figure 1. Spliceosome-mutant cells require the wildtype allele for survival
(a) Kaplan-Meier survival curve of CD45.1 recipient mice transplanted with control (Mx1-Cre+Srsf2+/+), heterozygous knockout (Mx1-Cre+Srsf2+/−), heterozygous mutant (Mx1-Cre+Srsf2P95H/+), and hemizygous mutant (Mx1-Cre+Srsf2P95H/−) bone marrow (BM) cells. Administration of polyI:C (pIpC) was performed 4 weeks post-transplantation. Survival comparison by Mantel-Cox log-ranked test. (b) White blood cell (WBC) count of mice of each genotype over 18 weeks of noncompetitive transplantation (n = 10 mice per group for experiments in (a) and (b)). Error bars represent mean ± SD. ***P < 0.001; ****P < 0.0001. (c) H&E staining of BM of CD45.1 recipient mice 8 weeks post-transplantation (scale bars, 200 μm). (d) Scatter plots comparing normalized expression of individual genes in BM lineage-negative Sca1+ c-Kit+ (LSK) cells in heterozygous knockout (left), heterozygous mutant (middle), and hemizygous mutant (right) mice relative to wildtype control cells. Genes that are significantly dysregulated between comparisons (Bayes factor > 5; fold change > 1.5) are labeled in red (up-regulated) and blue (down-regulated), respectively. Differentially expressed genes of particular biological importance are highlighted in each plot. Units are transcripts per million. (e) Mean enrichment of all variants of the SSNG exonic splicing enhancer (ESE) motif in cassette exons that were differentially included versus excluded in LSK cells with Srsf2 heterozygous loss (+/−), heterozygous mutation (P95H/+), or hemizygous mutation (P95/−) relative to Srsf2 control (+/+). Error bars indicate 95% confidence intervals estimated by bootstrapping. (f) Spatial distribution of CCNG and GGNG motifs adjacent to the sets of differentially spliced cassette exons analyzed in (e). N≥10% down/up indicates the number of exons that exhibited decreases/increases in inclusion of absolute magnitude ≥10% in cells with the indicated genotypes relative to Srsf2 control (+/+) cells. Shading indicates 95% confidence intervals by bootstrapping. The schematic illustrates a portion of a metagene with the cassette exon (black box) separated from the upstream and downstream exons (grey boxes) by the beginning and end of the connecting introns. Horizontal axis, genomic coordinates defined with respect to the 5′ and 3′ splice sites where position 0 is the splice site itself. Vertical axis, relative frequency of the indicated motifs over genomic loci containing cassette exons included versus excluded in the indicated genotype comparisons (log scale).
Figure 2
Figure 2. SRSF2-mutant myeloid leukemias are preferentially sensitive to pharmacologic modulation of splicing catalysis
(a) Multidimensional scaling based on alternatively spliced cassette exons (top) and protein-coding genes (bottom) in BM lineage-negative Sca1 c-Kit+ (LK) cells from Mx1-Cre+Srsf2P95H/+ and Mx1-Cre+Srsf2+/+ mice treated with vehicle or E7107 (4 mg/kg) for 5 days (n = 3 mice per group). (b) Mean enrichment of all variants of the SSNG exonic splicing enhancer (ESE) motif in cassette exons that were differentially included versus excluded in a two-factor comparison across all 4 experimental groups. N≥10% and N≤ −10% indicate the numbers of exons that exhibited increases and decreases in inclusion, respectively, of absolute magnitude ≥10% for the illustrated comparisons. For each comparison, enrichment was computed by comparing the indicated sets of exons (e.g., N≥10% versus N≤−10% for the left- and right-hand comparisons). For sample comparisons where differentially spliced exons exhibiting increased inclusion were not present (top and bottom), cassette exons that exhibited differential splicing of absolute magnitude ≤10% were used as a background set to compute motif enrichment instead. The individual comparison used to generate each set of bar graphs is shown in the schema in the center of the figure. Error bars indicate 95% confidence intervals estimated by bootstrapping. (c) Mean enrichment of all variants of the SSNG ESE motif in individual SRSF2-mutant MLL-rearranged human AML samples relative to the median of 28 SRSF2-wildtype MLL-rearranged AML samples. Error bars indicate 95% confidence intervals estimated by bootstrapping. (d) Spatial distribution of CCNG and GGNG motifs along cassette exons included or excluded in the SRSF2P95H-mutant samples relative to the median wildtype control amongst MLL-rearranged AML samples. (e) Schematic of secondary transplantation experiments of mouse MLL-AF9 leukemias in Srsf2+/+ (Vav-Cre+Srsf2+/+) and Srsf2P95H/+ (Vav-Cre+Srsf2P95H/+) backgrounds to test the effects of E7107 in vivo. (f) WBC counts (left) and percentages of WBC cells expressing GFP (right) following 10 days of E7107 administration. (g) Kaplan-Meier survival curves of recipient mice treated with vehicle or E7107 (at 4 mg/kg) in Srsf2+/+ or Srsf2P95H/+ backgrounds. Shaded area represents period of vehicle or E7107 dosing. Error bars represent mean ± SD. *P < 0.05; **P < 0.005; ***P < 0.001.
Figure 3
Figure 3. Splicing and gene expression changes in myeloid leukemias treated with E7107 in SRSF2-wildtype or mutant backgrounds
(a) Schematic of secondary transplantation experimentation with timed sacrifice following E7107 for RNA-seq analyses. Sub-lethally irradiated mice were transplanted with MLL-AF9;Srsf2+/+ or MLL-AF9;Srsf2P95H/+ primary leukemias followed by 5 days of E7107 (4 mg/kg/d) or vehicle treatment. GFP+ Mac1+ double-positive BM cells were then sorted 3 hours after the fifth treatment for RNA-seq (n = 5 mice per group). (b) Multidimensional scaling analysis of all 20 mice from (a) based on alternatively spliced cassette exons (top, N = 6,369), alternatively spliced retained introns (middle, N = 1,791), and expressed protein-coding genes (bottom, N = 9,339). Scatter plots of cassette exon splicing (top rows, isoform ratios represented as Percent Spliced In (PSI, Ψ) values), retained introns (middle rows, Ψ values), and gene expression (bottom rows, normalized expression values) from (c) MLL-AF9;Srsf2+/+ or (d) MLL-AF9;Srsf2P95H/+ mice treated with vehicle or E7107. Percentages indicate the fraction of differentially spliced cassette exons or retained introns (inclusion rates increased or decreased by absolute magnitude ≥ 10% with P < 0.01), or number of differentially expressed genes (fold change ≥ 2.5 with P < 0.01). Red and blue dots represent individual splicing events or coding genes that are promoted or repressed in E7107 versus vehicle-treated cells, respectively. (e) Sashimi plots, across splice junctions surrounding differentially spliced cassette exons in Dot1l and Meis1, with reads summarized across five replicate mice. Barplots represent the percent spliced (Ψ) cassette exon inclusion ratios across all samples. (f) RT-PCR analysis of the effect of acute exposure to E7107 (10 nM) on splicing of Dot1l and Meis1 in MLL-AF9;Srsf2+/+ and MLL-AF9;Srsf2P95H/+ leukemia cells in vitro. (g) Quantitative RT-PCR (qRT-PCR) analysis quantifying the relative levels of exclusion (EX) and inclusion (IN) isoforms of Dot1l and Meis1 following acute exposure to E7107 (10 nM) in vitro. Error bars represent mean ± SD. *P < 0.05; **P < 0.01.
Figure 4
Figure 4. Preferential sensitivity of primary human leukemias to pharmacologic modulation of splicing in vivo with E7107
(a) RT-PCR and (b) qRT-PCR analysis of the effect of E7107 exposure (6 hours) relative to DMSO treatment on expression of a cassette exon inclusion isoform (“poison” exon) of EZH2 in SRSF2 wildtype (TF-1) or mutant (K052) leukemia cell lines. (c) Schema of patient-derived xenograft (PDX) experiments using primary human acute myeloid leukemia (AML) samples wildtype or mutant for spliceosomal genes followed by engraftment into NOD-scid IL2Rnull (NSG) mice. (d) Percentage of BM human CD45 (hCD45) cells in NSG mice following 10 days of vehicle or E7107 (4 mg/kg/d) treatment based on spliceosome mutational status. Each point represents hCD45 values for one individual NSG mouse and each color represents PDX from a specific patient. Mutational data for each patient are listed below the graph. (e) Immunohistochemical and immunofluorescence analysis for hCD45 in BM sections of recipient mice as shown in (d) based on spliceosome mutational status. (f) Percentage of BM hCD45+ cells in S-phase based on in vivo BrdU-incorporation following 5 days of E7107 (4 mg/kg/d) or vehicle treatment. (g) Bar plots showing percentage of hCD45+ cells that are Annexin V+/PIor Annexin V+/PI+. (h) Representative FACS plots of Annexin V/propidium iodide (PI) staining of hCD45 cells following 5 days of E1707 (4 mg/kg/d) or vehicle treatment in vivo. Error bars represent mean ± SD. *P < 0.05; **P < 0.01; ***P < 0.001; **** P <0.0001.

References

    1. Yoshida K, et al. Frequent pathway mutations of splicing machinery in myelodysplasia. Nature. 2011;478:64–69. - PubMed
    1. Papaemmanuil E, et al. Somatic SF3B1 mutation in myelodysplasia with ring sideroblasts. N Engl J Med. 2011;365:1384–1395. - PMC - PubMed
    1. Graubert TA, et al. Recurrent mutations in the U2AF1 splicing factor in myelodysplastic syndromes. Nat Genet. 2012;44:53–57. - PMC - PubMed
    1. Shirai CL, et al. Mutant U2AF1 Expression Alters Hematopoiesis and Pre-mRNA Splicing In Vivo. Cancer cell. 2015;27:631–643. - PMC - PubMed
    1. Kim E, et al. SRSF2 Mutations Contribute to Myelodysplasia by Mutant-Specific Effects on Exon Recognition. Cancer cell. 2015;27:617–630. - PMC - PubMed

MeSH terms