. 2016 May 12;533(7602):269-73.
doi: 10.1038/nature17656. Epub 2016 May 2.

Architecture of the mitochondrial calcium uniporter

Affiliations

Architecture of the mitochondrial calcium uniporter

Kirill Oxenoid et al. Nature. .

Abstract

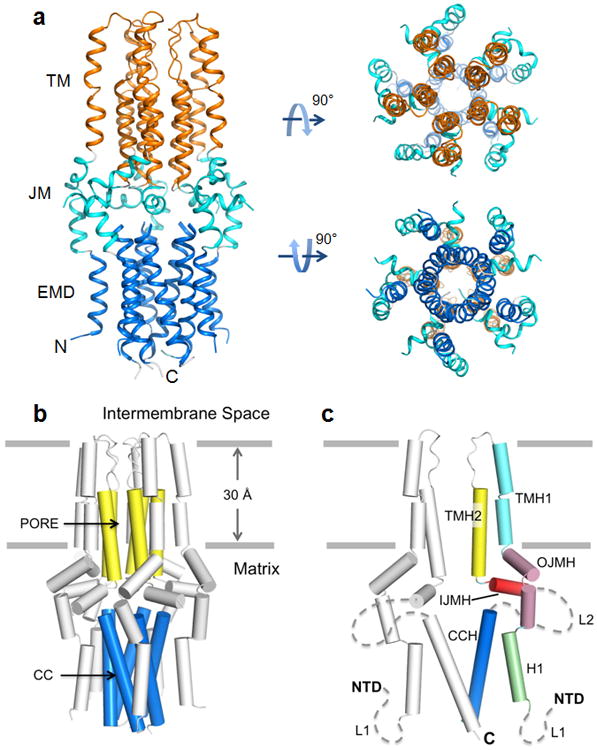
Mitochondria from many eukaryotic clades take up large amounts of calcium (Ca(2+)) via an inner membrane transporter called the uniporter. Transport by the uniporter is membrane potential dependent and sensitive to ruthenium red or its derivative Ru360 (ref. 1). Electrophysiological studies have shown that the uniporter is an ion channel with remarkably high conductance and selectivity. Ca(2+) entry into mitochondria is also known to activate the tricarboxylic acid cycle and seems to be crucial for matching the production of ATP in mitochondria with its cytosolic demand. Mitochondrial calcium uniporter (MCU) is the pore-forming and Ca(2+)-conducting subunit of the uniporter holocomplex, but its primary sequence does not resemble any calcium channel studied to date. Here we report the structure of the pore domain of MCU from Caenorhabditis elegans, determined using nuclear magnetic resonance (NMR) and electron microscopy (EM). MCU is a homo-oligomer in which the second transmembrane helix forms a hydrophilic pore across the membrane. The channel assembly represents a new solution of ion channel architecture, and is stabilized by a coiled-coil motif protruding into the mitochondrial matrix. The critical DXXE motif forms the pore entrance, which features two carboxylate rings; based on the ring dimensions and functional mutagenesis, these rings appear to form the selectivity filter. To our knowledge, this is one of the largest membrane protein structures characterized by NMR, and provides a structural blueprint for understanding the function of this channel.


Figures

Extended Data Figure 1
Extended Data Figure 1. Multiple sequence alignment of the full-length hMCU, full length cMCU and cMCU-ΔNTD
Residues that are invariant in all three sequences are shaded in red. Partially conserved and much less conserved residues are shaded in blue and gray, respectively. The mutations introduced in cMCU-ΔNTD are shaded in yellow. D and E in the DxxE motif are indicated by formula image. The serine residue shown to be involved in Ru360 inhibition is indicated by *. Helical segments, as determined by NMR in this study, are indicated by cylinders and labeled as in the main text. The accession numbers for hMCU and cMCU are NM_138357.1 and NP_500892.1, respectively.
Extended Data Figure 2
Extended Data Figure 2. Biochemical Analysis of cMCU-ΔNTD Oligomeric State
a, Elution peak of cMCU-ΔNTD from Superdex 200 10/300 GL column in 20 mM MES (pH 6.4), 75 mM NaCl, 0.48 mM Foscholine-14, 0.3 mM NaN3, and 2 mM EDTA. b, SDS-PAGE analysis of the elution peak showing sample purity > 95%. c, Size Exclusion Chromatography coupled to Multi Angle Light Scattering (SEC-MALS) analysis of the diluted NMR sample of cMCU-ΔNTD. The SEC-MALS/UV/RI measurement was used to determine cMCU-ΔNTD molecular mass based on the three-detector method. In this method, since the FC-14 detergent does not have UV absorption at 280 nm, the protein mass is directly calculated without correcting for the bound micelle. Chromatograms show the readings from the LS at 90° (red), RI (blue), and UV (green) detectors. The left and right axes represent the LS detector reading and molecular mass, respectively. The black curve represents the calculated molecular mass, and the average mass of the elution peak of cMCU-ΔNTD is 92 kDa. Note: the ∼10 ml difference in elution volumes between (a) and (c) is due to the volume of solution feeding from SEC to MALS. d, SDS-PAGE analysis of chemical crosslinking of the diluted cMCU-ΔNTD NMR sample. The reaction mixture contains 0.1 mM cMCU-ΔNTD (monomer), 3 mM Foscholine-14, and various amounts of DTSSP. The reactions were quenched after 1 hour by the addition of 2 μl of 1M Tris (pH 7.5). The quenched samples were loaded to 12% Bis-Tris gel (Novex Life Technologies). The gel was silver stained using the standard protocol. The five lanes to the right of the M.W. marker correspond to DTSSP concentrations of 0, 5, 7, 10 and 15 mM. The band that corresponds to a pentamer showed the most obvious increase in intensity as a function of [DTSSP].
Extended Data Figure 3
Extended Data Figure 3. The cMCU-ΔNTD methyl group resonances with residue specific assignment
The 1H-13C HSQC was recorded with 28 ms constant-time 13C evolution at 900 MHz.
Extended Data Figure 4
Extended Data Figure 4. Single particle EM of the cMCU-ΔNTD oligomeric complex
a, Typical image of the cMCU-ΔNTD oligomers negatively stained with uranyl formate. The bar corresponds to 50 nm in length. A selected subset of cMCU-ΔNTD particles is highlighted with white circles. Shown in the upper left corner are a typical top/bottom view and a typical side view of the selected particles. b, Gallery of 100 out of 202 reference-free 2D class averages of the particles, which revealed the existence of 5-fold symmetry in the complex (pentagon shapes). c, Comparison of different views of the 3D EM density map reconstructed without enforcing C5 symmetry (top row) with the corresponding views of the map reconstituted with symmetry (bottom row). The largest discrepancies are in the middle bulge region between the TM and CC domains, due possibly to the lack of rigid structure in the large L2 loop. d, Comparison of the 2D projections (top) from the 3D EM density map with the corresponding reference-free 2D classes. e, Estimation of resolution of the final 3D reconstruction. The Fourier shell correlation (FSC) suggests a resolution of ∼18 Å using the 0.5 criterion.
Extended Data Figure 5
Extended Data Figure 5. Intermonomer NOEs from mixed isotope labeled sample
Examples are taken from the 3D 15N-edited NOESY-TROSY of the mixed labeled sample containing 1:1 mixture of (15N, 2H)-labeled cMCU-ΔNTD and (15% 13C)-labeled cMCU-ΔNTD. a, Sample 1H-1H strips at various 15N chemical shifts showing intermonomer NOEs between backbone amide proton and aliphatic protons for the C-terminal CCH domain. The NOE spectrum was recorded at 23 °C at 900 MHz. b, Sample strips showing intermonomer NOEs within the TMH2 pore as well as the selectivity filter region. The NOE spectrum was recorded at 33 °C at 900 MHz. On the right of each panel, intermonomer NOEs in the context of the structure are shown as red lines.
Extended Data Figure 6
Extended Data Figure 6. Structural ensemble of the cMCU-ΔNTD pentamer derived from NMR restraints and fitting to the EM model
a, Ensemble of 15 lowest energy structures calculated using NMR-derived structural restraints (see Extended Data Table 1). The undefined loops L1 (residues 166-179) and L2 (residue 272-292) are not shown for clarity. b, The NMR structure of cMCU-ΔNTD without the loop regions L1 and L2 was fitted to the EM volume using rigid body fitting (the ‘fit’ tool in Chimera). The L1 and L2 are however included for display. Top view from the intermembrane space side. c, Bottom view from the matrix side. d-e, Two different side views. Note that the loop regions appear disordered due to the lack of NMR-derived structural restraints. This does not necessarily mean that they do not acquire any stable conformation. The presumed detergent molecules around the membrane-embedded region are not taken into account in this fit.
Extended Data Figure 7
Extended Data Figure 7. SDS-PAGE Analysis of Chemical Crosslinking of the CCH Peptide
The reaction mixtures containing 0.1 mM peptide (cMCU residues 288 – 316 plus the C-terminal L and E as in the cMCU-ΔNTD construct) and various amounts of DTSSP were quenched after 1 hr of reaction by the addition of 1 μl of 1M Tris (pH 7.5). The quenched samples were loaded to 12% Bis-Tris gel (Novex Life Technologies). The gel was silver stained using the standard protocol. The four lanes to the right of the M.W. marker correspond to DTSSP:CCH ratios of 0, 10:1, 30:1, and 50:1.
Extended Data Figure 8
Extended Data Figure 8. Surface representation for revealing the surface-exposed and core amino acid properties of the cMCU-ΔNTD pentamer
Hydrophobic, polar, and charged residues are shown in yellow, cyan, and blue, respectively. The hydrophobic residues include A, I, L, F, V, P, and G, the polar residues include Q, N, H, S, T, Y, C, M, and W, and the charged residues include K, R, D, and E. The solid lines indicate the hydrophobic core boundaries of the presumed lipid bilayer. a, Pentamer with unstructured loops removed. b, The same view as in (a) with the front subunit removed to reveal the core.
Extended Data Figure 9
Extended Data Figure 9. Deletion of N-terminal domain (aa 58-186) in HsMCU (HsMCU-ΔNTD) does not impair its function
Representative traces of calcium uptake in digitonin permeabilized cells after addition of 50 μM CaCl2 are shown on left. The bar graph shows the rate of calcium uptake relative to WT HEK 293T cells (mean ± s.d., n=4). Cell lysates were analyzed by immunoblotting using anti-FLAG antibody to detect expression of MCU protein. ATP5A was used as loading control.
Figure 1
Figure 1. NMR and EM Characterization of cMCU-ΔNTD
a, Domain organization of MCU (predicted using programs COILS and TMHMM). b, 1H-15N TROSY-HSQC spectrum of (15N,2H)-labeled cMCU-ΔNTD oligomer reconstituted in Foscholine-14, recorded at 900MHz and 23°C. The peaks in the inset correspond to tryptophan side chain amines. c, Isothermal titration calorimetry analysis of Ru360 binding to cMCU-∆NTD (left) and the S238A mutant (right) under the NMR sample condition. The top and bottom graphs show the raw data (μcal/second vs. time) and normalized integration data (kcal/mole of injectant vs. molar ratio; molar ratio = Ru360:cMCU-∆NTD pentamer), respectively. Data fitting yields KD = 24 ± 8 μM. d, Negative stain EM reconstruction of the cMCU-ΔNTD oligomers using a protein sample prepared in the same way as NMR samples. Views of the final 3D volumes of cMCU-ΔNTD oligomer filtered at 18 Å.
Figure 2
Figure 2. Structure of the cMCU-ΔNTD pentamer
a, Ribbon representation of the cMCU-ΔNTD structure displaying three distinct layers that correspond to the transmembrane (TM; orange), juxtamembrane (JM; cyan), and extramembrane domain (EMD; blue) regions, respectively. b, Cartoon representation of the cMCU-ΔNTD pentamer showing the formation of the uniporter core, which consists of the TM pore formed by TMH2 (yellow) and the coiled-coil pentamer formed by CCH (marine). The structure is placed in the presumed membrane such that the peripheral hydrophobic residues in the TM domain are lipid facing. c, Cartoon representation of two subunits of the cMCU-ΔNTD pentamer showing the folding of individual subunits. The helical segments are defined in the text. The dashed lines labeled as L1 and L2 correspond to the unstructured regions of the protein.
Figure 3
Figure 3. Architecture of the pore and ion selectivity filter
a, Cartoon representation of the TM domain displaying the mini barrel at the mouth of the TM pore that contains the DxxE Ca2+ selectivity elements. b, Enlarged view of the DxxE-containing region for showing side chain conformational diversity of Asp240 and Glu243. c, TM domains of subunits 1 and 3 for showing the pore-lining residues. d, The pore surface calculated using the program HOLE . The region of the channel colored in green is only wide enough to allow passage of one water molecule, whereas the blue portion can accommodate two or more water molecules. The red region is too narrow to allow any water to pass through.
Figure 4
Figure 4. Functional mutagenesis of HsMCU inspired by the cMCU-ΔNTD structure
a, Cysteine-free MCU (MCUCF) rescues mitochondrial calcium uptake to the same extent as wild type MCU (MCUWT) in MCU knockout (KO) cells. b, Mutation of MCU Glu257 to Ala or Ser does not impair its function. c, Mutation of Asp261 to Glu permits ion permeation through MCU whereas Glu264 to Asp impairs function. d, Mutation of Ser259 to Arg impairs MCU function. a-d, Representative traces of calcium uptake in digitonin permeabilized cells after addition of 50 μM CaCl2 are shown on left. The bar graph shows the rate of calcium uptake relative to WT HEK 293T cells (mean ± s.d., n=4). Cell lysates were analyzed by immunoblotting using anti-FLAG antibody to detect expression of MCU protein. ATP5A was used as loading control.

References

    1. Gunter TE, Pfeiffer DR. Mechanisms by which mitochondria transport calcium. The American journal of physiology. 1990;258:C755–786. - PubMed
    1. Kirichok Y, Krapivinsky G, Clapham DE. The mitochondrial calcium uniporter is a highly selective ion channel. Nature. 2004;427:360–364. - PubMed
    1. Denton RM, McCormack JG. The role of calcium in the regulation of mitochondrial metabolism. Biochem Soc Trans. 1980;8:266–268. - PubMed
    1. Baughman JM, et al. Integrative genomics identifies MCU as an essential component of the mitochondrial calcium uniporter. Nature. 2011;476:341–345. - PMC - PubMed
    1. Perocchi F, et al. MICU1 encodes a mitochondrial EF hand protein required for Ca(2+) uptake. Nature. 2010;467:291–296. - PMC - PubMed

Methods References

    1. Slotboom DJ, Duurkens RH, Olieman K, Erkens GB. Static light scattering to characterize membrane proteins in detergent solution. Methods. 2008;46:73–82. doi: 10.1016/j.ymeth.2008.06.012. - DOI - PubMed
    1. Tang G, et al. EMAN2: an extensible image processing suite for electron microscopy. Journal of structural biology. 2007;157:38–46. doi: 10.1016/j.jsb.2006.05.009. - DOI - PubMed
    1. Ludtke SJ, Baldwin PR, Chiu W. EMAN: semiautomated software for high-resolution single-particle reconstructions. Journal of structural biology. 1999;128:82–97. doi: 10.1006/jsbi.1999.4174. - DOI - PubMed
    1. Guo X, et al. Structural insight into autoinhibition and histone H3-induced activation of DNMT3A. Nature. 2015;517:640–644. doi: 10.1038/nature13899. - DOI - PubMed
    1. Cong Y, Kovacs JA, Wriggers W. 2D fast rotational matching for image processing of biophysical data. Journal of structural biology. 2003;144:51–60. - PubMed

Publication types

Substances