. 2016 Jun;23(6):608-18.
doi: 10.1038/nsmb.3218. Epub 2016 May 2.

Multilayered proteomics reveals molecular switches dictating ligand-dependent EGFR trafficking

Affiliations

Multilayered proteomics reveals molecular switches dictating ligand-dependent EGFR trafficking

Chiara Francavilla et al. Nat Struct Mol Biol. 2016 Jun.

Abstract

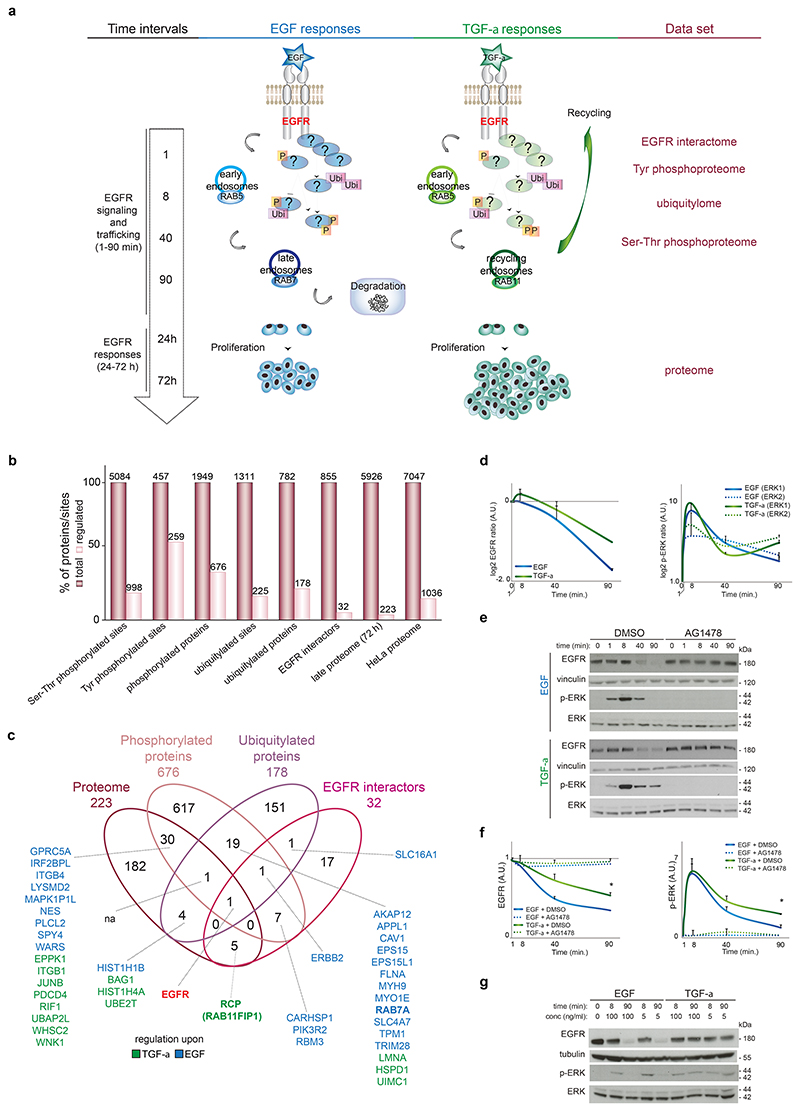
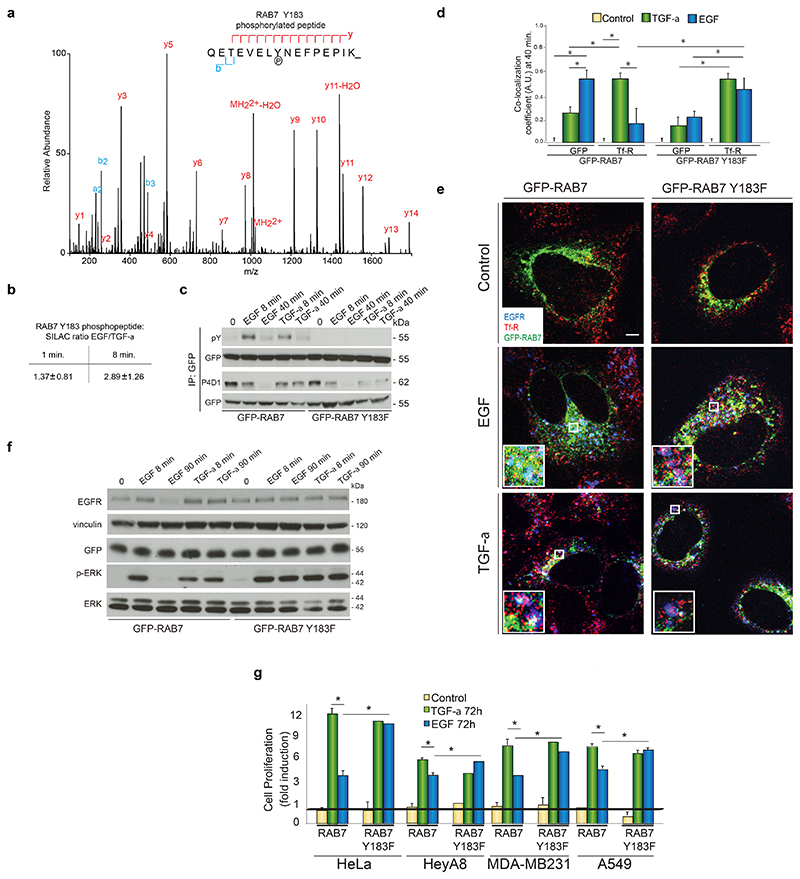
A fascinating conundrum in cell signaling is how stimulation of the same receptor tyrosine kinase with distinct ligands generates specific outcomes. To decipher the functional selectivity of EGF and TGF-α, which induce epidermal growth factor receptor (EGFR) degradation and recycling, respectively, we devised an integrated multilayered proteomics approach (IMPA). We analyzed dynamic changes in the receptor interactome, ubiquitinome, phosphoproteome, and late proteome in response to both ligands in human cells by quantitative MS and identified 67 proteins regulated at multiple levels. We identified RAB7 phosphorylation and RCP recruitment to EGFR as switches for EGF and TGF-α outputs, controlling receptor trafficking, signaling duration, proliferation, and migration. By manipulating RCP levels or phosphorylation of RAB7 in EGFR-positive cancer cells, we were able to switch a TGF-α-mediated response to an EGF-like response or vice versa as EGFR trafficking was rerouted. We propose IMPA as an approach to uncover fine-tuned regulatory mechanisms in cell signaling.


Figures

Figure 1
Figure 1. EGFR trafficking and responses depend on biased ligands.
(a) Quantification (see Online Methods) of total EGFR level (left panel), cell surface EGFR (middle panel) or internalized EGFR (right panel) upon EGF- or TGF-α-stimulation for different time intervals. Values in the graph represent the median ± SD of three independent biological experiments (about 100 cells counted in each experiment). (b) Representative images from (a), showing the internalization (cytoplasm) and recycling (plasma membrane) of EGF- or TGF-α-stimulated HA-EGFR (green) at different time intervals. Arrows indicate internalized receptor. Asterisks indicate cells with the receptor recycled to the cell surface. Bar, 5 μm. (c) Quantification (see Online Methods) of the presence of EGFR in endocytic markers-positive regions upon EGF- or TGF-α-stimulation. Values in the graph represent the means ± SD of three independent biological experiments, each done in three technical replicates and analyzing 10 fields for each of the three technical replicate. A.U., arbitrary units. *, p value<0.01 (Student´s two tailed t-test) (d) Representative images from (c), showing the presence of EGFR (green or red) in intracellular markers-positive regions in stimulated cells. Bar, 5 μm. Cell proliferation (e) and BrdU incorporation (f) of stimulated cells. Data represent the mean ± s.e.m. of three independent biological experiments.. *, p value<0.05 compared to EGF (Student´s two tailed t-test). Black line represents control cells.
Figure 2
Figure 2. Multi-layered proteomics of EGFR signaling shows ligand-specific EGFR regulation.
(a) Overview of the time scale for proteomics of EGFR signaling. (b) Number and percentage of identified and regulated sites and proteins. (c) Venn diagram indicating the number of proteins specifically regulated at different levels upon EGF (blue) or TGF-α (green) stimulation. na, none of the proteins were specifically regulated by either ligand. EGFR is highlighted in red. (d) Quantitation by MS of ERK1 and ERK2 Y202-T204-containing doubly phosphorylated peptide (right) and EGFR protein (left) upon EGF (blue) or TGF-α (green) stimulation. Values are the median ± range of two replicates (see Supplementary Tables 1 and 3). (e) The immunoblotting for EGFR, ERK and Vinculin is quantified in (f), where the values are the mean ± SD of three independent biological experiments. *, p value<0.05 (two-sample Student´s test on slopes). AG1478, EGFR inhibitor. (g) Lysates from stimulated cells with EGF or TGF-α at different concentration were immunoblotted as indicated. See also Supplementary Data Set 1 for uncropped gels.
Figure 3
Figure 3. Analysis of dynamic EGFR signaling indicates ligand-dependent regulation of phosphorylation and ubiquitylation.
(a) Number of sites and EGFR interactors regulated at each time point. (b) PCA of the log2-transformed ratios from the indicated datasets. Magenta line represents the separation of EGF and TGF-α responses at 8 min. (c) PCA of Tyr phosphoproteome from the indicated studies. (d) Sequence motif analysis of the ± 6 amino acid residues flanking the regulated phosphorylation site. (e) Immunoblotting for ERK and Vinculin upon prolonged stimulation quantified in (f), where values are the mean ± SD of three independent biological experiments.. *, p value<0.05 (two-sample Student´s test on slopes). See also Supplementary Data Set 1 for uncropped gels.
Figure 4
Figure 4. Biased EGFR ligands differentially promote the crosstalk between phosphorylation and ubiquitylation.
(a) Number of modified kinases, phosphatases, E3 ligases and DUBs identified in our dataset (left) and the same expressed as percentage of the total number of these enzyme categories identified in total in HeLa cells (right). *, p value<0.05 (Fisher’s exact test). (b) Number of total (left) and regulated (right) modified proteins. (c) GO term enrichment analysis of the 25 doubly modified proteins against proteins modified by one of the PTMs. (d) Functional network analysis of the 25 doubly modified proteins shown in Table 1, based on the STRING database and visualized using Cytoscape (ClusterONE plugin). Cluster 1, p value=7*10-6. Cluster 2, p value=0.049. EGFR and RAB7A are highlighted in orange and blue, respectively.
Figure 5
Figure 5. RAB7 phosphorylation on Y183 is important for EGF-dependent EGFR degradation and outcomes.
(a) MS/MS spectrum of the phosphorylated Y183 peptide of RAB7. (b) SILAC ratio of the phosphorylated Y183 peptide of RAB7 upon stimulation for 1 or 8 min. (c) Lysates from stimulated cells transfected with RAB7-GFP or its mutant were immunoprecipitated and immunoblotted as indicated. (d) Quantification (see Online Methods) of the presence of EGFR in RAB7-GFP-or Transferrin Receptor (Tf-R)-positive regions upon EGF- or TGF-α-stimulation for 40 min. Values in the graph represent the means ± SD. of independent biological experiments, each done in three technical replicates and analyzing 10 fields for each of the three technical replicate. A.U., arbitrary units. *, p value<0.05 (Student´s two tailed t-test). (e) Representative images from (d), showing EGFR (blue) in GFP-RAB7-(wt or its mutant, green) or Tf-R-(red) positive regions in 40 min-stimulated cells. Bar, 5 μm. (f) Lysates from stimulated cells transfected with RAB7-GFP or its mutant were immunoblotted as indicated. A representative image from three independent experiments is shown. (g) Cancer cell proliferation assay in stimulated cells upon transfection with RAB7 or its mutant. Data represent the mean ± s.e.m. of three independent biological experiments..*, p value<0.05 compared to the indicated stimulus (Student´s two tailed t-test). Black line represents control cells. See also Supplementary Data Set 1 for uncropped gels.
Figure 6
Figure 6. RCP promotes TGF-α-dependent EGFR recycling.
(a) Overview of the regulation of the MS-identified phosphorylation and ubiquitylation sites on EGFR. Each square indicates a time point and the color-scale represents the difference between EGF-over TGF-α−□□□□□□ □□□□□□□□□□□□□□. (b, d) Lysates from stimulated cells were immunoprecipitated and immunoblotted as indicated. The inputs are shown in Supplementary Fig. 7. One representative image from three independent experiments is shown. (c) Overview of the EGFR interactome based on the STRING database and color-code based on the difference between EGF over TGF-α□regulation. Each square indicates a time point. (e) Quantification (see Online Methods) of the presence of EGFR in RAB7-, RAB11-or RCP-positive regions upon EGF-or TGF-α stimulation for 40 min in cells depleted or not for RCP. Values in the graph represent the means ± SD. of three independent biological experiments, each done in three technical replicates and analyzing 10 fields for each of the three technical replicate. A.U., arbitrary units.*, p value<0.05 (Student´s two tailed t-test). (f) Representative images from (e), showing the presence of EGFR (red) in RAB7-or RAB11-positive regions in 40 min-stimulated cells depleted or not of RCP. Bar, 5 μm. (g) Lysates from stimulated cells where RCP expression was depleted by two different siRNA sequences or not were immunoblotted as indicated. (h) Lysates from stimulated cells transfected with GFP-RAB5 were immunoprecipitated and immunoblotted as indicated. One representative image is shown from three independent experiments. See also Supplementary Data Set 1 for uncropped gels.
Figure 7
Figure 7. RCP mediates TGF-α-dependent cellular responses.
(a) Ratio vs. Intensity plot of the EGF (blue)- and TGF-α-induced differentially expressed proteins upon 72h stimulation. Insert, GO terms enrichment analysis. (b) Lysates from RCP-depleted and stimulated cells (HeLa or other cancer cells) were immunoblotted as indicated. One representative image from three independent experiments is shown. See also Supplementary Data Set 1 for uncropped gels. (c, d) Cancer cell proliferation (c) or migration (d) assays in stimulated cells upon RCP depletion. Data represent the mean ± s.e.m. of three independent biological experiments. *, p value<0.05 compared to the indicated stimulus (Student´s two tailed t-test). Black line represents control cells. (e) Model of EGFR trafficking, signaling and responses based on this study. On the left, the early interaction between RCP, RAB5 and RAB11 (Fig. 6h) is represented. On the right, the orange arrow indicates the EGFR-mediated phosphorylation of RAB7.

References

    1. Kholodenko BN. Untangling the signalling wires. Nat Cell Biol. 2007;9:247–9. doi: 10.1038/ncb0307-247. - DOI - PMC - PubMed
    1. Zheng Y, et al. Temporal regulation of EGF signalling networks by the scaffold protein Shc1. Nature. 2013;499:166–71. doi: 10.1038/nature12308. - DOI - PMC - PubMed
    1. Purvis JE, Lahav G. Encoding and decoding cellular information through signaling dynamics. Cell. 2013;152:945–56. doi: 10.1016/j.cell.2013.02.005. - DOI - PMC - PubMed
    1. Sousa LP, et al. Suppression of EGFR endocytosis by dynamin depletion reveals that EGFR signaling occurs primarily at the plasma membrane. Proc Natl Acad Sci U S A. 2012;109:4419–24. doi: 10.1073/pnas.1200164109. - DOI - PMC - PubMed
    1. Vieira AV, Lamaze C, Schmid SL. Control of EGF receptor signaling by clathrin-mediated endocytosis. Science. 1996;274:2086–9. - PubMed

LinkOut - more resources