. 2016 May 2:5:e15106.
doi: 10.7554/eLife.15106.

Synaptic pruning in the female hippocampus is triggered at puberty by extrasynaptic GABAA receptors on dendritic spines

Affiliations

Synaptic pruning in the female hippocampus is triggered at puberty by extrasynaptic GABAA receptors on dendritic spines

Sonia Afroz et al. Elife. .

Abstract

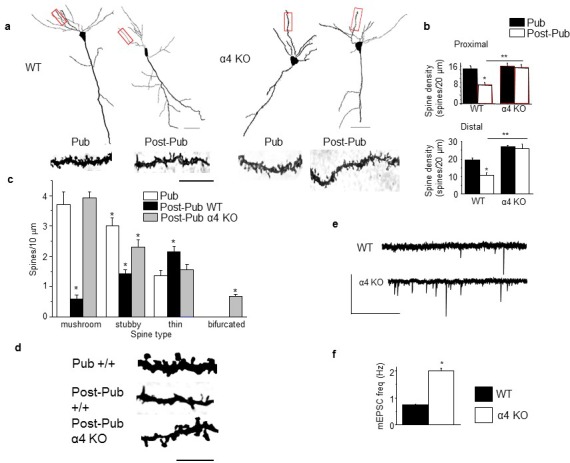
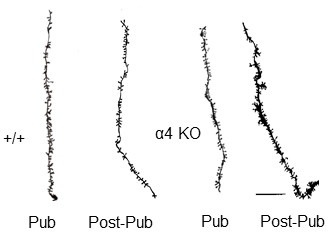
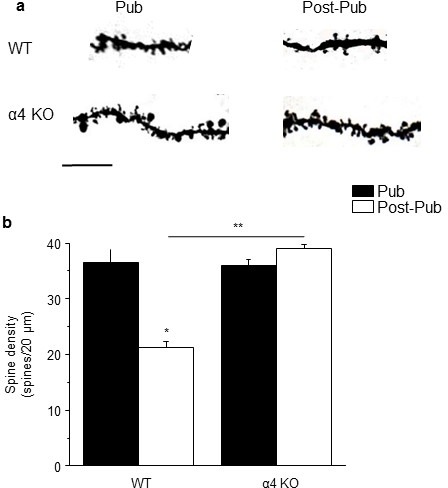
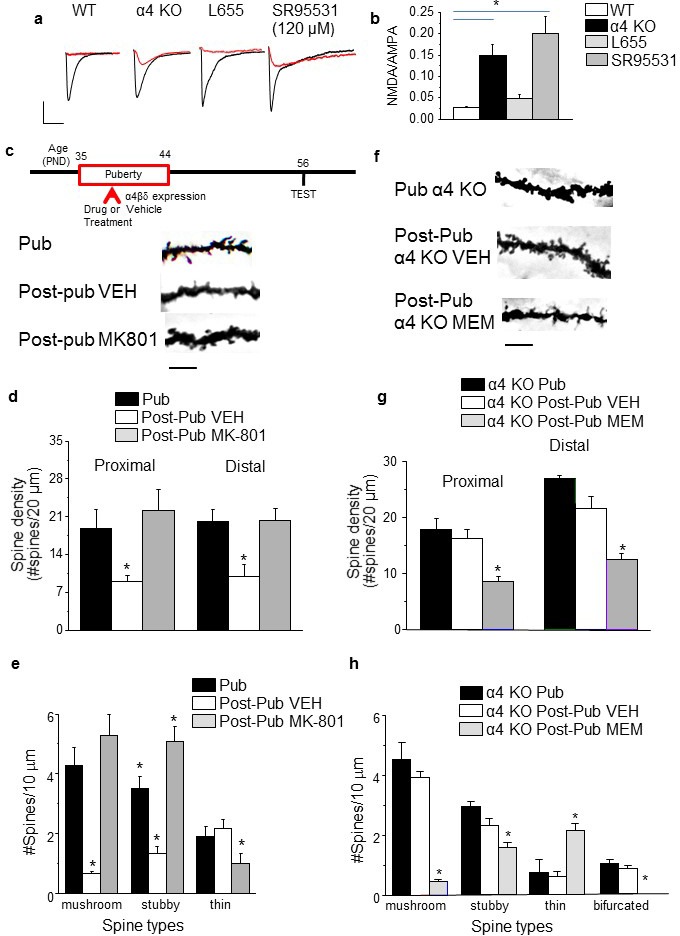
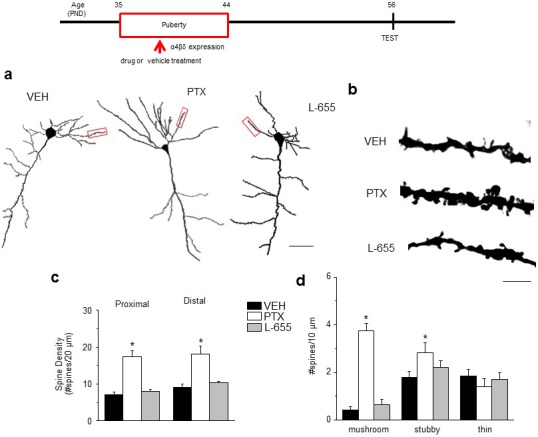
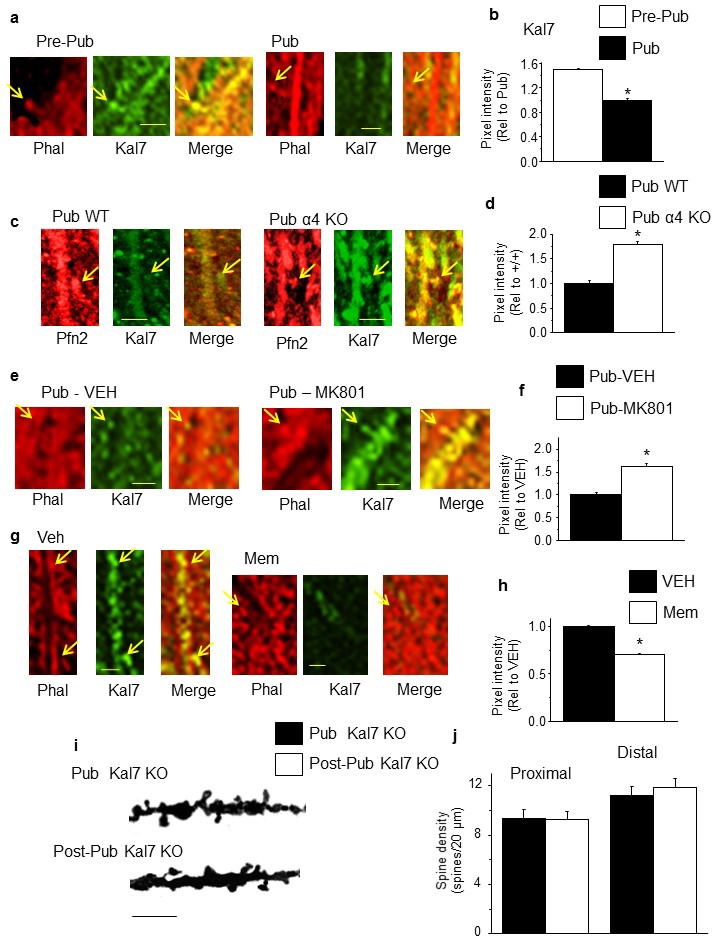
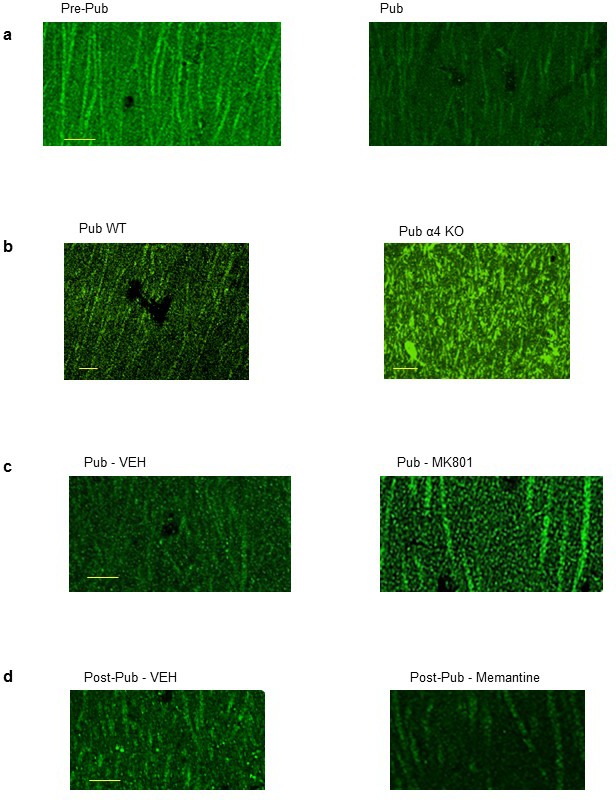
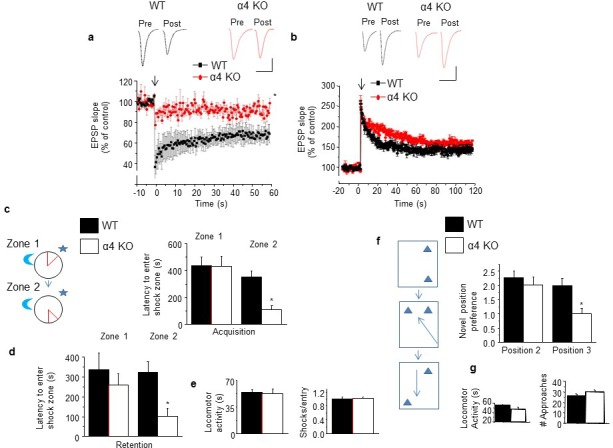
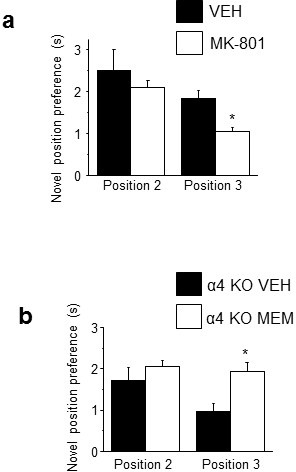
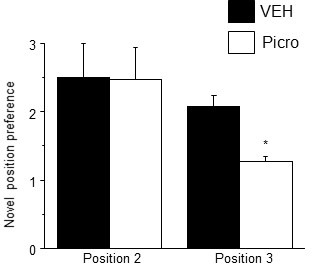
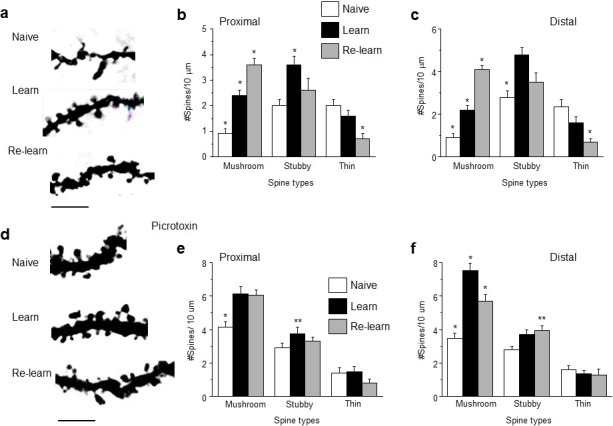
Adolescent synaptic pruning is thought to enable optimal cognition because it is disrupted in certain neuropathologies, yet the initiator of this process is unknown. One factor not yet considered is the α4βδ GABAA receptor (GABAR), an extrasynaptic inhibitory receptor which first emerges on dendritic spines at puberty in female mice. Here we show that α4βδ GABARs trigger adolescent pruning. Spine density of CA1 hippocampal pyramidal cells decreased by half post-pubertally in female wild-type but not α4 KO mice. This effect was associated with decreased expression of kalirin-7 (Kal7), a spine protein which controls actin cytoskeleton remodeling. Kal7 decreased at puberty as a result of reduced NMDAR activation due to α4βδ-mediated inhibition. In the absence of this inhibition, Kal7 expression was unchanged at puberty. In the unpruned condition, spatial re-learning was impaired. These data suggest that pubertal pruning requires α4βδ GABARs. In their absence, pruning is prevented and cognition is not optimal.

Keywords: GABA-A receptor; cell biology; delta; dendritic spine; hippocampus; mouse; neuroscience; puberty; synaptic pruning.


Conflict of interest statement

The authors declare that no competing interests exist.

Figures

Figure 1.
Figure 1.. Synaptic pruning of CA1 hippocampus of adolescent female mice is prevented in the α4 knock-out.
Pub, pubertal; post-Pub, post-pubertal. (a) CA1 hippocampal pyramidal cells, Pub and post-Pub (8-week old) WT and α4 KO female mouse hippocampus. Upper panel, neurolucida images, scale, 50 µm; lower panel, z-stack (100x) images; scale, 20 µm. Additional images and data from male mice provided in Figure 1—figure supplement 1 and Figure 1—figure supplement 2, respectively. Source data for all figures are available as separate files. (b) Averaged data for spine density, Proximal (left), WT, t-test, t(41)=7.15, p<0.0001*, power=1; n= 21–22 neurons (5–6 mice)/group; α4 KO, t-test, t(47)=0.43, P=0.67; n= 24–25 neurons (6 mice)/group; post-Pub, WT vs. α4 KO, t-test, t(45)=5.8, p<0.0001*; Distal (right), WT, t-test, t(28)=5.73, p<0.0001, power=1*; n= 15 neurons (5–6 mice)/group; α4 KO, t-test, t(39)=2.11, P=0.04; n= 20–21 neurons (6 mice)/group; post-Pub, WT vs. α4 KO, t-test, t(33)=8.1, p<0.0001*. *p<0.05 vs. Pub; **p<0.05 vs. WT. (Figure 1—source data 1) (c) Quantification of spines according to type, *p<0.05 vs. other pubertal/genotype groups. Mushroom, ANOVA, F(2,54)=110.65, p<0.0001*, power=1; Stubby, ANOVA, F(2,54)=23.1, p<0.0001, power=1; Thin, ANOVA, F(2,54)=9.29, p=0.0003*, power=0.94; Bifurcated, ANOVA, F(2,54)=39, p<0.0001*, power=1; (n=19 neurons, 5 mice/group). *p<0.05 vs. other groups. (Figure 1—source data 2) (d) Representative high-contrast z-stack images; scale, 10 µm. (e) Representative mEPSCs, post-Pub WT and α4 KO. Scale, 50pA, 10 s. (f) Averaged data, mEPSC frequency; *t-test, t(16)=11.4, p<0.0001*, power=1; n= 8–10 cells (mice)/group. (Figure 1—source data 2) DOI: http://dx.doi.org/10.7554/eLife.15106.003
Figure 1—figure supplement 1.
Figure 1—figure supplement 1.. Neurolucida images of spine density across pubertal stage and α4 genotype.
Representative Neurolucida drawings. Scale, 10 μm. DOI: http://dx.doi.org/10.7554/eLife.15106.007
Figure 1—figure supplement 2.
Figure 1—figure supplement 2.. Synaptic pruning of CA1 hippocampus of adolescent male mice is prevented in the α4 knock-out.
Pub, pubertal; post-Pub, post-pubertal. (a) CA1 hippocampal pyramidal cells, Pub and post-Pub (8-week old) WT and α4 KO male mouse hippocampus. (a) Representative z-stack (100x) images; scale, 5 µm. (b) Averaged data for spine density, WT, pub vs. post-pub, t-test, t(22)=5.84, p<0.0001*, power=1; n= 12 neurons (3 mice)/group; α4 KO, pub vs. post-pub, t-test, t(22)=2, P=0.97; n= 12 neurons (3 mice)/group; post-pub, WT vs. α4 KO, t-test, t(22)=12.5, p<0.0001*, power=1. *p<0.05 vs. Pub; **p<0.05 vs. WT. (Source data 1) DOI: http://dx.doi.org/10.7554/eLife.15106.008
Figure 2.
Figure 2.. NMDA receptors maintain spines during puberty.
(a) Representative EPSCs (black) and NMDA EPSCs (red) recorded during puberty in WT or α4 KO hippocampus, in some cases during α5 (50 nM L655) or total (120 μM SR95531) GABAR blockade. In all other cases, 200 nM SR95531 was bath applied block synaptic GABARs (Stell and Mody, 2002). Scale, 150 pA, 15 ms. (b) Averaged NMDA/AMPA ratios; ANOVA, F(3,31)=20.21, p=0.0001*, power=1; n=8–10 cells (mice)/group. (Figure 2—source data 1) *p<0.05 vs. WT. (c) Inset, Drug treatment during puberty (PND 35–44) was tested for its effect on post-pubertal spine density (PND 56). Z-stack images, pub and post-pub hippocampus, showing the effects of pubertal vehicle or MK-801 treatment, at a dose shown to increase NMDAR expression (Gao and Tamminga, 1995). Scale, 6 μm. (d) Averaged spine density. Proximal (left): ANOVA, F(2,32)=54.16, p<0.0001*, power=1, n= 11–12 neurons (5 mice)/group; Distal (right)l: ANOVA, F(2,32)=460.1, p<0.0001*, power=1; n=11–12 neurons (5 mice)/group. (Figure 2—source data 2) *p<0.05 vs. other groups. (e) Quantification of spine types. Mushroom, ANOVA, F(2,33)=24.7, p<0.0001*; Stubby, ANOVA, F(2,33)=25.4, p<0.0001*; Thin, ANOVA, F(2,33)=7.66, P=0.002*; power=0.9–1; n=12 neurons (6 mice) /group. *p<0.05 vs. other groups. (Figure 2—source data 3) (f) Z-stack images, pub and post-pub hippocampus, showing the effects of pubertal vehicle or memantine (MEM) treatment, a NMDAR blocker which does not alter NMDAR expression (Cole et al., 2013). Scale, 6 μm. (g) Averaged spine density. *Proximal: ANOVA, F(2,54)=64.12, p<0.0001*, power=1, n=17–20 neurons (4–5 mice) /group; Distal: ANOVA, F(2,56)=33.2, p<0.0001*, power=1, n=19–20 neurons (4–5 mice) /group. (Figure 2—source data 4) *p<0.05 vs. other groups. (h) Quantification of spine types. Mushroom, ANOVA, F(2,45)=89.9, p<0.0001*; Stubby, ANOVA, F(2,45)=9.4, P=0.0004*; Thin, ANOVA, F(2,45)=13.7, P=0.0001*; Bifurcated, ANOVA, F(2,45)=17.7, p<0.0001*; power=1, n=16 neurons (4–5 mice)/group. (Figure 2—source data 5) *p<0.05 vs. other groups. DOI: http://dx.doi.org/10.7554/eLife.15106.012
Figure 3.
Figure 3.. Effect of GABAR blockade on spine density in the post-pubertal hippocampus.
Inset, Drug treatment during puberty (PND 35–44) was tested for its effect on post-pubertal spine density (PND 56). Drugs: PTX, picrotoxin, a GABAR antagonist; L655, L-655,708, an inverse agonist at α5-GABAR; VEH, vehicle (oil). (a) Neurolucida images, post-Pub CA1 pyramidal cells, following pubertal drug treatment; scale, 50 µm. (b) z-stack (100x) images; scale, 10 µm. (c) Spine density, Proximal (left): ANOVA, F(2,30)=45.5, p<0.0001*, power=1; Distal (right): ANOVA, F(2,30)=60.8, p<0.0001*, power=1; n=11 neurons (6 mice)/group. (Figure 3—source data 1) *p<0.05 vs. other groups. (d) Spine morphology changes. Mushroom, ANOVA, F(2,45)=104.2, p<0.0001*; Stubby, ANOVA, F(2,45)=4.78, p=0.013*; Thin, ANOVA, F(2,45)=1.37, P=0.27; power=0.8–1, n=16 neurons (6 mice)/group. (Figure 3—source data 1) *p<0.05 vs. other groups. Lorazepam effects on spine density are depicted in Figure 3—figure supplement 1. DOI: http://dx.doi.org/10.7554/eLife.15106.018
Figure 3—figure supplement 1.
Figure 3—figure supplement 1.. Pubertal lorazepam treatment does not alter spine density in post-pubertal mice.
(a) Representative z-stack images; (b) Averaged spine densities for proximal (left) and distal (right) dendrites of post-pubertal female mice treated during the pubertal period with the positive GABA modulator lorazepam, which targets non-α4 GABARs of the α[1–3,5]βγs sub-type. Proximal: t(23)=1.02, p=0.32; Distal: t(20)=0.28, p=0.78; Scale, 20 μm; n=11–13 neurons (5 mice)/group. (Figure 3—figure supplement 1—source data 1) DOI: http://dx.doi.org/10.7554/eLife.15106.021
Figure 4.
Figure 4.. NMDA receptor-dependent Kalirin-7 expression decreases at puberty.
(a,c,e,g) Representative images, scale, 2.5 μm. Arrows, spines. (a) Phalloidin (Phal), Kalirin-7 (Kal7) and merged images from pre-pub and pub CA1 hippocampus. (b) Mean pixel intensity, *t-test, t(26)=29.2, p<0.0001*, power=1; n=14 neurons (6 mice)/group. (c) Pfn2, Kal7 and merged images from pub WT and α4 KO CA1. (d) Mean pixel intensity, *t-test, t(26)=12.0, p<0.0001*, power=1; n=14 neurons (4 mice)/group. (e) Phal, Kal7 and merged images from pub CA1 hippocampus following in vivo treatment with vehicle or MK801 to increase NMDAR expression (Gao and Tamminga, 1995). (f) Mean pixel intensity, *t-test, t(26)=6.25, p<0.0001*, power=1; n=14 neurons (5 mice)/group. (g) Phal, Kal7 and merged images from post-pub CA1 hippocampus following in vivo treatment with vehicle or memantine (MEM), an NMDAR blocker. (h) Mean pixel intensity, *t-test, t(26)=6.5, p<0.0001*, power=1; n=14 neurons (5 mice)/group. Original uncropped images of Kal7 immunohistochemistry are shown in Figure 4—figure supplement 1. (Figure 4—source data 1) (i) Representative z-stack images, Pub, post-Pub Kal7 KO. Scale, 10 μm. (j) Averaged data, spine density. Proximal: t(32)=0.06, p=0.95, n=17 neurons (6 mice)/group; Distal: t(32)=0, p=1, n=17 neurons (6 mice)/group. (Figure 4—source data 2) DOI: http://dx.doi.org/10.7554/eLife.15106.023
Figure 4—figure supplement 1.
Figure 4—figure supplement 1.. Kalirin-7 expression varies across pubertal stage, α4 genotype and level of pubertal NMDAR expression.
Representative images of Kalirin-7 (Kal7) expression in CA1 hippocampus across pubertal stage (a), in pubertal WT and α4 KO hippocampus (b), following pubertal treatment with vehicle or MK-801 to increase NR1 expression (Aoki et al., 2012) (c) or following post-pubertal treatment with vehicle or memantine to block NMDARs (d). Scale, 10 μm. (Averaged data of pixel intensity included in Figure 3). DOI: http://dx.doi.org/10.7554/eLife.15106.026
Figure 5.
Figure 5.. Induction of long-term depression and re-learning are impaired under conditions of high spine density in the α4 KO mouse.
(a) Induction of long-term depression (LTD) using low frequency stimulation (arrow). WT, black, α4 KO, red. *t-test, t(6)=3.56, p=0.01, power=0.84; n=4/group. (Figure 5—source data 1) Inset, representative field EPSPs. Scale, 0.2 mV, 20 ms. (b) Induction of long-term potentiation (LTP) using theta burst stimulation (arrow). WT, black, α4 KO, red. t-test, t(7)=0.28, p=0.78; n=4–5/group. (Figure 5—source data 2) Inset, representative field EPSPs. Scale, 0.2 mV, 25 ms. (c) [Inset, The active place avoidance task (APA). The animal is trained to avoid a shock zone (red) on a rotating arena. Day 1, training for zone 1; day 2, training for zone 2.] Average latency to enter shock zone 1 (Z1) and 2 (Z2), Acquisition. *t-test, Zone 1, t(9)=0.02, p=0.99; Zone 2, t(10)=3.37, p=0.007*, power=0.86; n=5–7 mice. (d) Average latency to enter shock zone 1 (Z1) and 2 (Z2), Retention. * t-test, Zone 1, t(9)=1.17, p=0.27; Zone 2, t(10)=3.08, p=0.012*, power=0.80; n=5–7 mice. (Figure 5—source data 3) (e) Locomotor activity (left, t test, t(10)=0.67, p=0.52) and # shocks/entry, a measure of escape behavior (right, t test, t(10)=0.08, p=0.93). n=5–7 mice/group. (Figure 5—source data 4) (f) Inset, the multiple placement object recognition task (MPORT). Sequence of positions (1–3) of object 2 across 3 training trials. Novel position preference for positions 2 and 3. Position 2, *t-test, t(23)=0.85, p=0.40; Position 3, t(23)=4.61, p<0.0001*, power=1; WT, n=15 mice; α4 KO, n=10 mice. (Figure 5—source data 5) (g) Locomotor activity (left, t-test, t(23)=0.34, p=0.74; WT, n=15 mice; α4 KO, n=10 mice) and # approaches, a measure of object interest (right, t t-test, t(23)=0.97, p=0.339; WT, n=15 mice; α4 KO, n=10 mice) (Figure 5—source data 6). Effects on MK-801 and memantine on learning and re-learning are depicted in Figure 5—figure supplement 1. Picrotoxin effects on learning and re-learning are depicted in Figure 5—figure supplement 2. DOI: http://dx.doi.org/10.7554/eLife.15106.027
Figure 5—figure supplement 1.
Figure 5—figure supplement 1.. NMDAR antagonist treatment alters behavioral flexibility.
Treatment with MK-801 or memantine during puberty, to increase NR1-NMDAR expression or decrease NMDAR activity (Gao and Tamminga, 1995; Cole et al., 2013), respectively, produces opposite effects on behavioral flexibility tested using MPORT post-pubertally. (a) Post-pubertal increases in spine density produced by pubertal treatment with MK-801 resulted in a decrease in position preference for trial 3 of MPORT, reflecting a reduced ability to re-learn object position. Position 2: student’s unpaired t-test, t(12)=0.07, p=0.95; Position 3, t(12)=2.47, p=0.03*, power=0.92 (n=7/group) *p<0.05 vs. Veh. (Figure 5—figure supplement 1—source data 1) (b) Post-pubertal decreases in spine density produced by pubertal treatment of α4 KO mice with the NMDAR antagonist memantine resulted in an increase in position preference for trial 3 of MPORT, reflecting an increased ability to re-learn object position. Position 2: student’s unpaired t-test, t(12)=0.54, p=0.60; Position 3, t(12)=4.32, p=0.0005*, power=0.99 (n=8/group) *p<0.05 vs. Veh. (Figure 5—figure supplement 1—source data 2) DOI: http://dx.doi.org/10.7554/eLife.15106.034
Figure 5—figure supplement 2.
Figure 5—figure supplement 2.. Pubertal GABAR antagonist treatment impairs behavioral flexibility post-pubertally.
Mice were treated with picrotoxin (Picro, 3 mg/kg, i.p.), to block GABARs, or vehicle during puberty (PND 35–44) and tested on PND 56 using MPORT. Post-pubertal increases in spine density produced by pubertal treatment with Picro resulted in a decrease in position preference for trial 3 of MPORT, reflecting a reduced ability to re-learn object position. However, initial learning (position 2) was not impaired compared to vehicle-treated animals. Position 2: student’s unpaired t-test, t(10)=1.24, p=0.24; Position 3, t(10)=3.6, p=0.0024*, power=0.96; n=6/group *p<0.05 vs. Veh. (Figure 5—figure supplement 2—source data 1Source data 1) DOI: http://dx.doi.org/10.7554/eLife.15106.037
Figure 6.
Figure 6.. Learning and re-learning increase mushroom-type dendritic spines in CA1 hippocampus following adolescent synaptic pruning.
(a) Representative z-stack images from CA1 hippocampal pyramidal cells illustrating changes in spine type and number after hippocampal-dependent learning and re-learning, compared to naïve conditions. Scale, 5 μm. (b, c) Means ± S.E.M. for proximal and distal dendrites. Proximal, Mushroom, ANOVA, F(2,39)=44.9, p<0.0001*, power=1; Stubby, ANOVA, F(2,39)=6.0, p=0.005*. power=0.86; Thin, ANOVA, F(2,39)=7.24, p=0.004*; power=0.97, n=14 neurons (5 mice)/group. *p<0.05 vs. other groups. Distal, Mushroom, ANOVA, F(2,39)=84.1, p<0.0001*, power=1; Stubby, ANOVA, F(2,39)=13.7, p<0.0001*, power=1; Thin, ANOVA, F(2,39)=13, p<0.0001*; power=1, n=14 neurons (4–6 mice)/group. *p<0.05 vs. other groups. **p<0.05 vs. naïve. (Figure 6—source data 1) (d) Representative z-stack images from hippocampus of adult mice treated during the pubertal period with 3 mg/kg picrotoxin (Figure 3) to prevent synaptic pruning. Changes in spine type and number are evident after hippocampal-dependent learning and re-learning, compared to naïve conditions. Scale, 5 μm. (e,f) Means ± S.E.M. for proximal and distal dendrites. Proximal, Mushroom, ANOVA, F(2,39)=12.6, p<0.0001*, power=0.99; Stubby, ANOVA, F(2,39)=3.78, p=0.03*. power=0.86; Thin, ANOVA, F(2,39)=0.87, p=0.43, n=14 neurons (5 mice)/group. *p<0.05 vs. other groups. **p<0.05 vs. naïve. Distal, Mushroom, ANOVA, F(2,39)=33.1, p<0.0001*, power=1; Stubby, ANOVA, F(2,39)=3.87, p<0.029*, power=1; Thin, ANOVA, F(2,39)=0.42, p=0.66, n=14 neurons (5 mice)/group. *p<0.05 vs. other groups. **p<0.05 vs. naïve. (Figure 6—source data 2) DOI: http://dx.doi.org/10.7554/eLife.15106.039

References

    1. Alvarez VA, Ridenour DA, Sabatini BL. Distinct structural and ionotropic roles of NMDA receptors in controlling spine and synapse stability. Journal of Neuroscience. 2007;27:7365–7376. doi: 10.1523/JNEUROSCI.0956-07.2007. - DOI - PMC - PubMed
    1. Aoki C, Sabaliauskas N, Chowdhury T, Min JY, Colacino AR, Laurino K, Barbarich-Marsteller NC. Adolescent female rats exhibiting activity-based anorexia express elevated levels of GABA(A) receptor α4 and δ subunits at the plasma membrane of hippocampal CA1 spines. Synapse. 2012;66:391–407. doi: 10.1002/syn.21528. - DOI - PMC - PubMed
    1. Arellano JI, Benavides-Piccione R, Defelipe J, Yuste R. Ultrastructure of dendritic spines: Correlation between synaptic and spine morphologies. Frontiers in Neuroscience. 2007;1:131–143. doi: 10.3389/neuro.01.1.1.010.2007. - DOI - PMC - PubMed
    1. Bannerman DM, Niewoehner B, Lyon L, Romberg C, Schmitt WB, Taylor A, Sanderson DJ, Cottam J, Sprengel R, Seeburg PH, Köhr G, Rawlins JN, Köhr G, Rawlins JN. NMDA receptor subunit NR2A is required for rapidly acquired spatial working memory but not incremental spatial reference memory. Journal of Neuroscience. 2008;28:3623–3630. doi: 10.1523/JNEUROSCI.3639-07.2008. - DOI - PMC - PubMed
    1. Barker GR, Warburton EC. When is the hippocampus involved in recognition memory? Journal of Neuroscience. 2011;31:10721–10731. doi: 10.1523/JNEUROSCI.6413-10.2011. - DOI - PMC - PubMed

Publication types

Substances