

Trends in Critical Care Beds and Use Among Population Groups and Medicare and Medicaid Beneficiaries in the United States: 2000-2010
- PMID: 27136721
- PMCID: PMC5520973
- DOI: 10.1097/CCM.0000000000001722
Trends in Critical Care Beds and Use Among Population Groups and Medicare and Medicaid Beneficiaries in the United States: 2000-2010
Abstract
Objectives: To analyze patterns of critical care medicine beds, use, and costs in acute care hospitals in the United States and relate critical care medicine beds and use to population shifts, age groups, and Medicare and Medicaid beneficiaries from 2000 to 2010.
Design: Retrospective study of data from the federal Healthcare Cost Report Information System, American Hospital Association, and U.S. Census Bureau.
Subjects: None.
Interventions: None.
Setting: Acute care U.S. hospitals with critical care medicine beds.
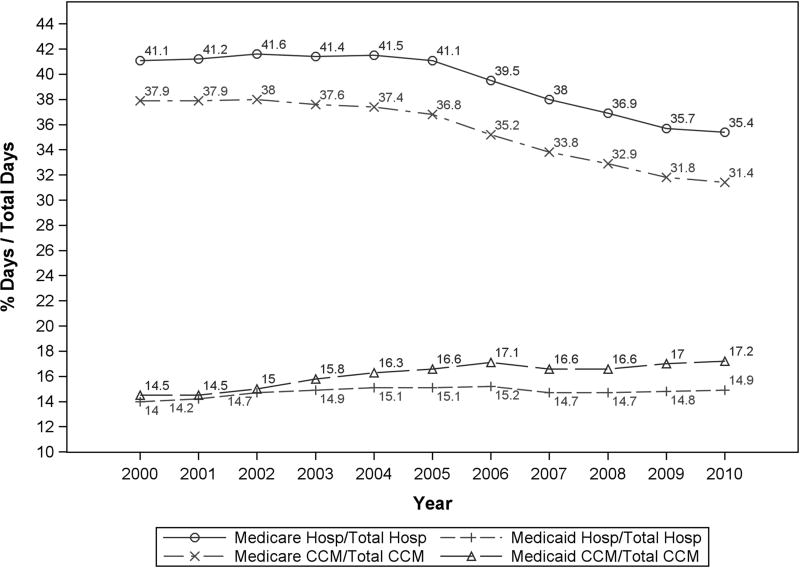
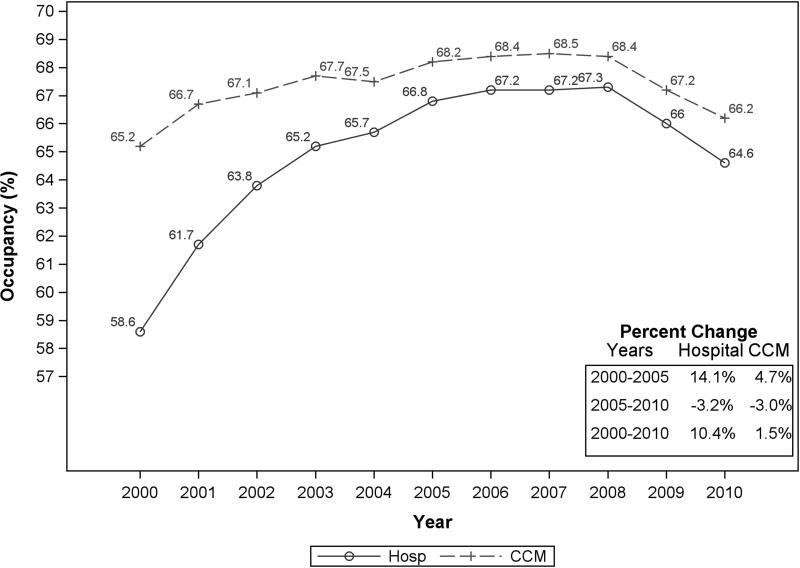
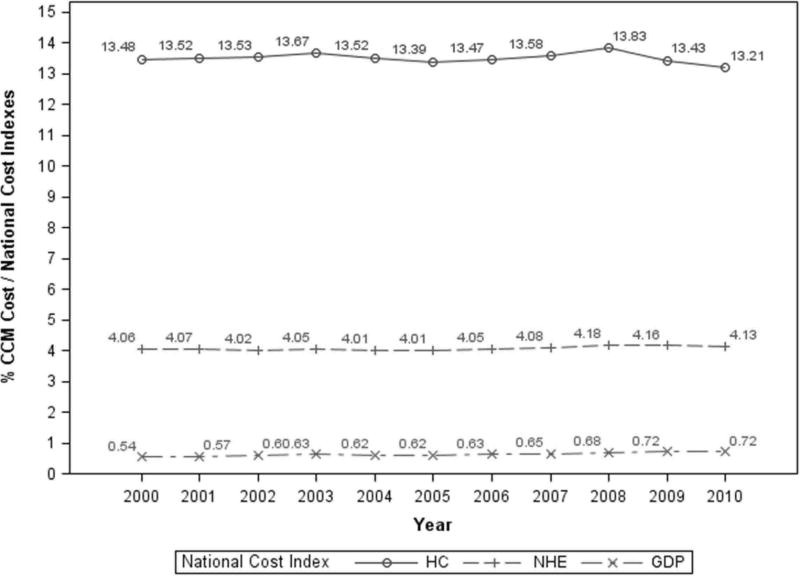
Measurements and main results: From 2000 to 2010, U.S. hospitals with critical care medicine beds decreased by 17% (3,586-2,977), whereas the U.S. population increased by 9.6% (282.2-309.3M). Although hospital beds decreased by 2.2% (655,785-641,395), critical care medicine beds increased by 17.8% (88,235-103,900), a 20.4% increase in the critical care medicine-to-hospital bed ratio (13.5-16.2%). There was a greater percentage increase in premature/neonatal (29%; 14,391-18,567) than in adult (15.9%; 71,978-83,417) or pediatric (2.7%; 1,866-1,916) critical care medicine beds. Hospital occupancy rates increased by 10.4% (58.6-64.6%), whereas critical care medicine occupancy rates were stable (range, 65-68%). Critical care medicine beds per 100,000 total population increased by 7.4% (31.3-33.6). The proportional use of critical care medicine services by Medicare beneficiaries decreased by 17.3% (37.9-31.4%), whereas that by Medicaid rose by 18.3% (14.5-17.2%). Between 2000 and 2010, annual critical care medicine costs nearly doubled (92.2%; $56-108 billion). In the same period, the proportion of critical care medicine cost to the gross domestic product increased by 32.1% (0.54-0.72%).
Conclusions: Critical care medicine beds, use, and costs in the United States continue to rise. The increasing use of critical care medicine by the premature/neonatal and Medicaid populations should be considered by healthcare policy makers, state agencies, and hospitals as they wrestle with critical care bed growth and the associated costs.
Conflict of interest statement
Figures
Comment in
-
Do we really need more intensive care unit beds?Ann Transl Med. 2016 Sep;4(18):356. doi: 10.21037/atm.2016.08.07. Ann Transl Med. 2016. PMID: 27761460 Free PMC article. No abstract available.
References
-
- Halpern NA, Pastores SM, Greenstein RJ. Critical care medicine in the United States 1985–2000: an analysis of bed numbers, use, and costs. Crit Care Med. 2004;32:1254–1259. - PubMed
-
- Halpern NA, Pastores SM. Critical care medicine in the United States 2000–2005: An analysis of bed numbers, occupancy rates, payer mix, and costs. Crit Care Med. 2010;38:65–71. - PubMed
-
- Ender J, Borger MA, Scholz M, et al. Cardiac surgery fast-track treatment in a postanesthetic care unit: six-month results of the Leipzig fast-track concept. Anesthesiology. 2008;109:61–66. - PubMed
-
- Angus DC, Kelly MA, Schmitz RJ, et al. Current and projected workforce requirements for care of the critically ill and patients with pulmonary disease. JAMA. 2000;284:2762–2770. - PubMed
-
- Angus DC, Barnato AE, Linde-Zwirble WT, et al. Use of intensive care at the end of life in the United States: an epidemiologic study. Crit Care Med. 2004;32:638–643. - PubMed
MeSH terms
Grants and funding
LinkOut - more resources
Full Text Sources
Other Literature Sources
Medical
