

Interferon-beta signaling in retinal mononuclear phagocytes attenuates pathological neovascularization
- PMID: 27137488
- PMCID: PMC4888856
- DOI: 10.15252/emmm.201505994
Interferon-beta signaling in retinal mononuclear phagocytes attenuates pathological neovascularization
Abstract
Age-related macular degeneration (AMD) is a leading cause of vision loss among the elderly. AMD pathogenesis involves chronic activation of the innate immune system including complement factors and microglia/macrophage reactivity in the retina. Here, we show that lack of interferon-β signaling in the retina accelerates mononuclear phagocyte reactivity and promotes choroidal neovascularization (CNV) in the laser model of neovascular AMD Complete deletion of interferon-α/β receptor (Ifnar) using Ifnar1(-/-) mice significantly enhanced early microglia and macrophage activation in lesion areas. This triggered subsequent vascular leakage and CNV at later stages. Similar findings were obtained in laser-treated Cx3cr1(Cre) (ER):Ifnar1(fl/fl) animals that allowed the tamoxifen-induced conditional depletion of Ifnar in resident mononuclear phagocytes only. Conversely, systemic IFN-β therapy of laser-treated wild-type animals effectively attenuated microgliosis and macrophage responses in the early stage of disease and significantly reduced CNV size in the late phase. Our results reveal a protective role of Ifnar signaling in retinal immune homeostasis and highlight a potential use for IFN-β therapy in the eye to limit chronic inflammation and pathological angiogenesis in AMD.
Keywords: age‐related macular degeneration; choroidal neovascularization; interferon‐beta signaling; macrophages; microglia.
© 2016 The Authors. Published under the terms of the CC BY 4.0 license.
Figures
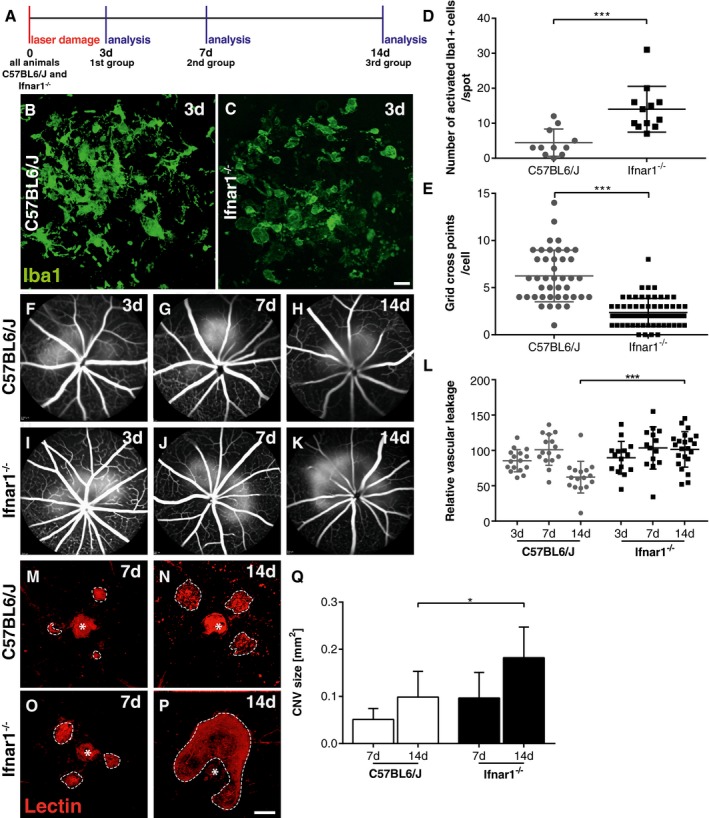
- A
Experimental design. Laser coagulation was performed in C57BL6/J control and Ifnar1 −/− mice. Animals were analyzed 3, 7, and 14 days after laser treatment.
- B, C
Representative Iba1 stainings of retinal flat mounts detecting microglia/macrophages in laser spots 3 days after laser coagulation in C57BL6/J controls (B) and Ifnar1 −/− (C) mice. Scale bar: 20 μm.
- D
Quantification of amoeboid‐shaped mononuclear phagocytes in laser spots. Values show mean ± SD (n = 11–12 retinas; unpaired Student's t‐test: ***P = 0.0004).
- E
Quantification of immune cell morphology in laser spots using a grid image analysis system. Values show mean ± SD (n = 42–62 cells; unpaired Student's t‐test: ***P < 0.0001).
- F–K
Representative fundus fluorescein angiography images of C57BL6/J (F–H) and Ifnar1 −/− (I–K) mice 3, 7, and 14 days after laser‐induced damage.
- L
Quantification of vascular leakage by analyzing pixel intensities at 3, 7, and 14 days after laser‐induced retinal damage in C57BL6/J controls versus Ifnar1 −/− mice. Values show mean ± SD (n = 14–22 eyes; one‐way ANOVA followed by Tukey's post‐test: ***P < 0.0001).
- M–P
Representative images of lectin‐stained choroidal flat mounts 7 and 14 days after laser coagulation in C57BL6/J control mice (M, N) and Ifnar1 −/− animals (O, P). Dashed lines indicate CNV areas, and the asterisk marks the central optic nerve head. Scale bar: 200 μm.
- Q
Quantification of lectin‐stained CNV areas with ImageJ software. Bars show mean ± SD (n = 4–11 RPE/choroidal flat mounts; one‐way ANOVA followed by Tukey's post‐test: *P = 0.0281).
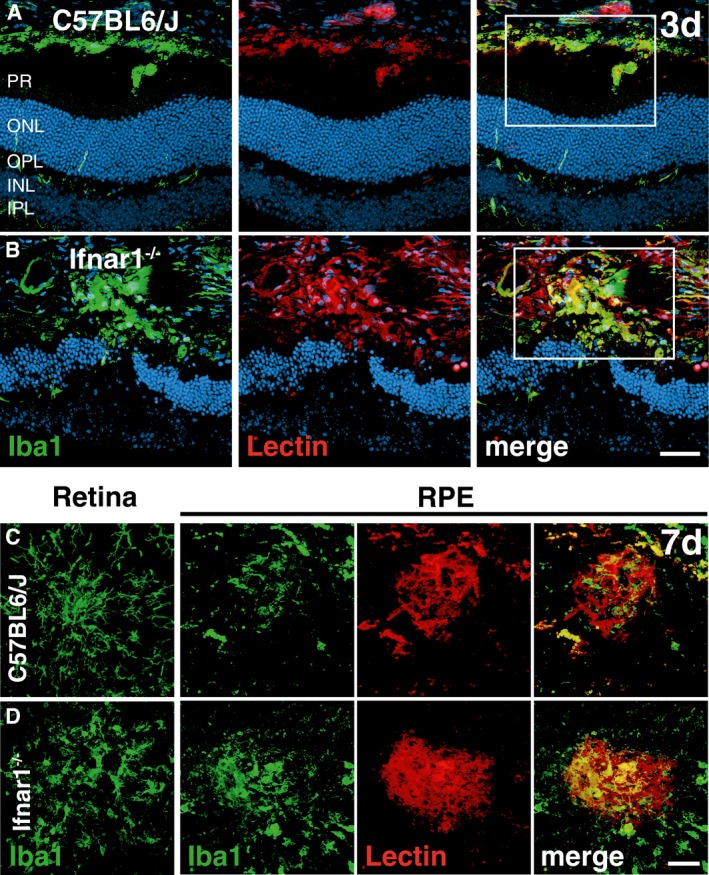
- A, B
Representative images of Iba1 (green) and lectin (red) co‐stained retinal cross sections 3 days after laser coagulation in C57BL6/J controls (A) and Ifnar1 −/− (B) mice with nuclear staining (DAPI, blue). The white box indicates the spot where the laser hit the retina. Scale bar 50 μm.
- C, D
Representative images of Iba1 (green) stained retinal flat mounts and Iba1 and lectin (red) co‐stained RPE/choroidal flat mounts 7 days after laser coagulation in C57BL6/J (C) and Ifnar1 −/− (D) mice. Scale bar 50 μm.
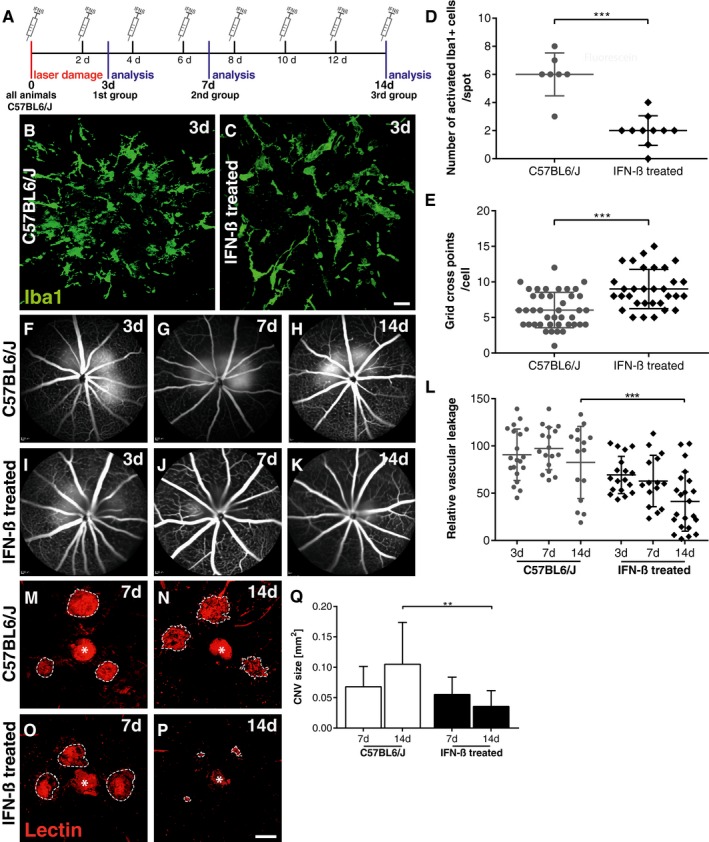
- A
Experimental design. Laser coagulation was performed in all C57BL6/J mice that were either untreated or received 10,000 units IFN‐β i.p. every second day until animals were analyzed 3, 7, and 14 days after laser treatment, respectively.
- B, C
Representative Iba1 stainings of retinal flat mounts detecting microglia/macrophages in laser spots 3 days after laser coagulation in control mice (B) or IFN‐β‐treated animals (C). Scale bar: 20 μm.
- D
Quantification of amoeboid‐shaped mononuclear phagocytes in laser spots. Values show mean ± SD (n = 7–10 retinas; unpaired Student's t‐test: ***P < 0.0001).
- E
Quantification of immune cell morphology in laser spots using a grid image analysis system. Values show mean ± SD (n = 41–62 cells; unpaired Student's t‐test: ***P < 0.0001).
- F–K
Representative fundus fluorescein angiography images of control mice (F–H) or IFN‐β‐treated animals (I–K) 3, 7, and 14 days after laser‐induced damage.
- L
Quantification of vascular leakage by analyzing pixel intensities at 3, 7, and 14 days after laser‐induced retinal damage in control mice and IFN‐β‐treated animals. Values show mean ± SD (n = 15–22 eyes; one‐way ANOVA followed by Tukey's post‐test: ***P = 0.0004).
- M–P
Representative images of lectin‐stained choroidal flat mounts 7 and 14 days after laser coagulation in control mice (M, N) and IFN‐β‐treated animals (O, P). Dashed lines indicate CNV areas, and the asterisk marks the central optic nerve head. Scale bar: 200 μm.
- Q
Quantification of lectin‐stained CNV areas with ImageJ software. Bars show mean ± SD (n = 7–12 RPE/choroidal flat mounts; one‐way ANOVA followed by Tukey's post‐test: **P = 0.0038).
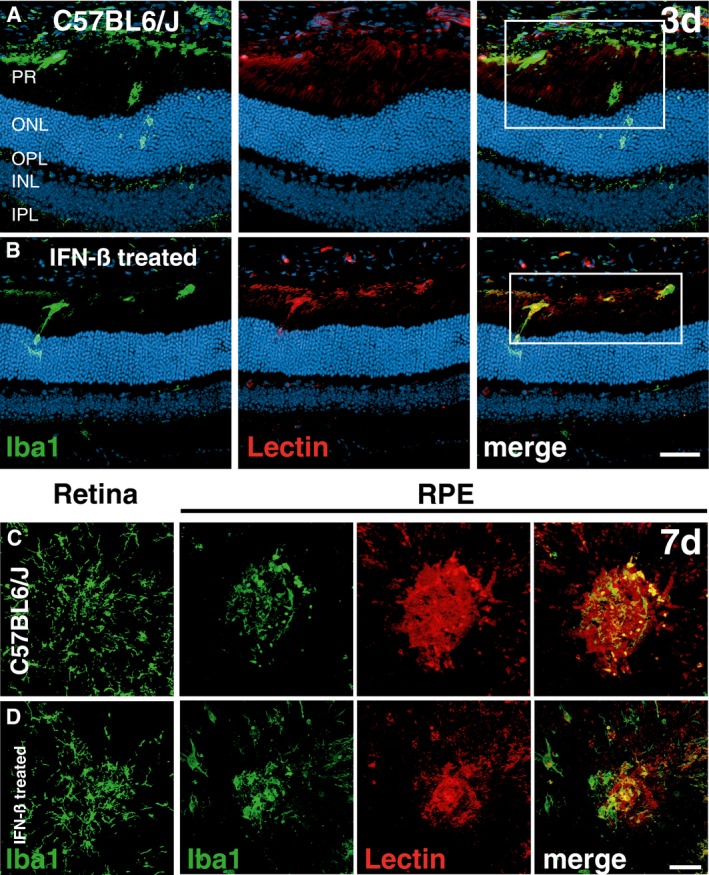
- A, B
Representative images of Iba1 (green) and lectin (red) co‐stained retinal cross sections 3 days after laser coagulation in C57BL6/J controls (A) and IFN‐ß‐treated C57BL6/J (B) mice with nuclear staining (DAPI, blue). The white box indicates the spot where the laser hit the retina. Scale bar 50 μm.
- C, D
Representative images of Iba1 (green) stained retinal flat mounts and Iba1 and lectin (red) co‐stained RPE/choroidal flat mounts 7 days after laser coagulation in C57BL6/J controls (C) and IFN‐ß‐treated C57BL6/J (D) mice. Scale bar 50 μm.
- A
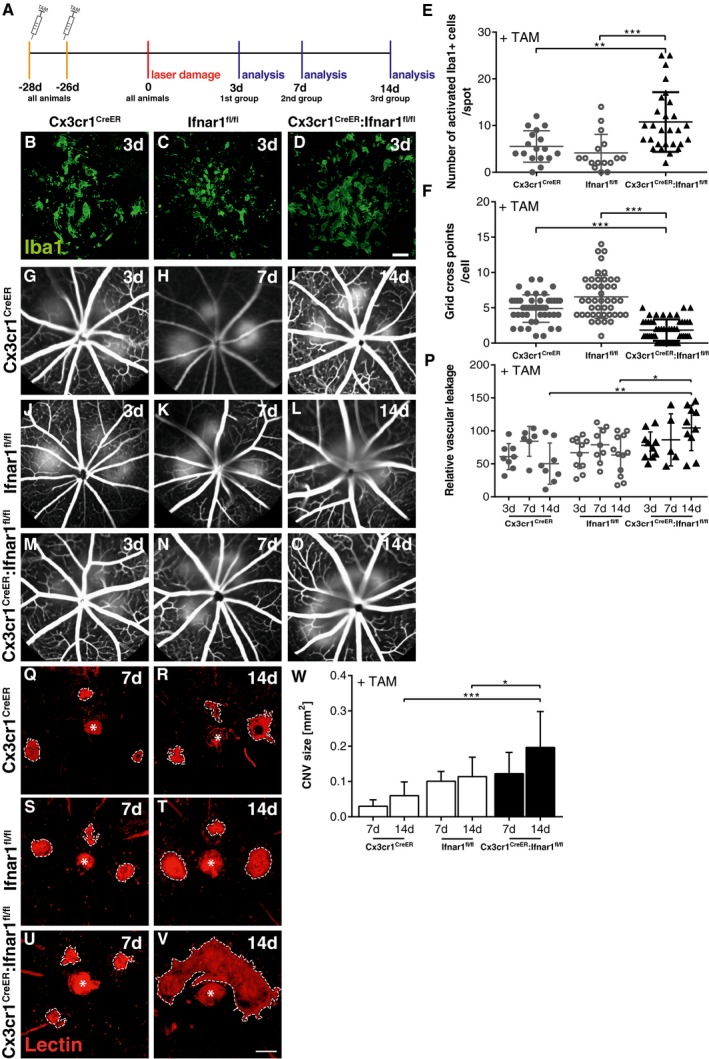
Experimental design. Laser coagulation was performed in tamoxifen‐treated Cx3cr1 CreER , Ifnar1 fl/fl, and Cx3cr1 CreER:Ifnar1 fl/fl mice. Animals were analyzed 3, 7, and 14 days after laser treatment.
- B–D
Representative Iba1 staining results of retinal flat mounts detecting microglia/macrophages in laser spot 3 days after laser coagulation in Cx3cr1 CreER (B), Ifnar1 fl/fl (C), and Cx3cr1 CreER:Ifnar1 fl/fl (D) mice. Scale bar: 20 μm.
- E
Quantification of amoeboid‐shaped mononuclear phagocytes in laser spots. Values show mean ± SD (n = 17–29 retinas; unpaired Student's t‐test: ***P = 0.0003, **P = 0.0044).
- F
Quantification of immune cell morphology in laser spots using a grid image analysis system. Values show mean ± SD (n = 44–52 cells; unpaired Student's t‐test: ***P < 0.0001).
- G–O
Representative fundus fluorescein angiography images of Cx3cr1 CreER (G–I), Ifnar1 fl/fl (J–L), and Cx3cr1 CreER:Ifnar1 fl/fl (M–O) mice 3, 7, and 14 days after laser‐induced damage.
- P
Quantification of vascular leakage by analyzing pixel intensities at 3, 7, and 14 days after laser‐induced retinal damage in Cx3cr1 CreER , Ifnar1 fl/fl, and Cx3cr1 CreER:Ifnar1 fl/fl mice. Values show mean ± SD (n = 5–12 eyes; one‐way ANOVA followed by Tukey's post‐test: **P = 0.0032, *P = 0.0247).
- Q–V
Representative images of lectin‐stained choroidal flat mounts 7 and 14 days after laser coagulation in Cx3cr1 CreER (Q, R), Ifnar1 fl/fl (S, T), and Cx3cr1 CreER:Ifnar1 fl/fl (U, V) mice. Dashed lines indicate CNV areas, and the asterisk marks the central optic nerve head. Scale bar: 200 μm.
- W
Quantification of lectin‐stained CNV areas with ImageJ software. Bars show mean ± SD (n = 4–11 RPE/choroidal flat mounts; one‐way ANOVA followed by Tukey's post‐test: *P = 0.043, ***P = 0.0007).
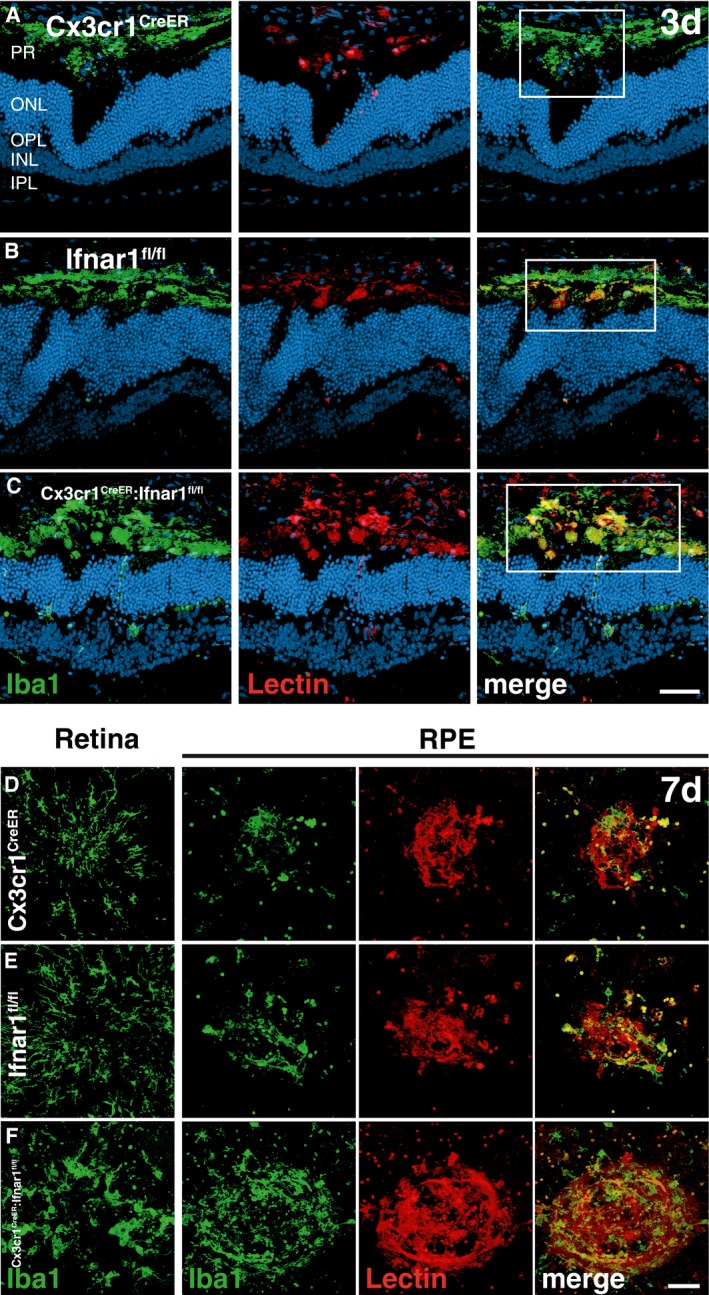
- A–C
Representative images of Iba1 (green) and lectin (red) co‐stained retinal cross sections 3 days after laser coagulation in C57BL6/J controls (A) and Ifnar1 −/− (B) and Cx3cr1 CreER:Ifnar1 fl/fl (C) mice with nuclear staining (DAPI, blue). The white box indicates the spot where the laser hit the retina. Scale bar 50 μm.
- D–F
Representative images of Iba1 (green) stained retinal flat mounts and Iba1 and lectin (red) co‐stained RPE/choroidal flat mounts 7 days after laser coagulation in C57BL6/J controls (D) and Ifnar1 −/− (E) and Cx3cr1 CreER:Ifnar1 fl/fl (F) mice. Scale bar 50 μm.
Similar articles
-
Co-inhibition of PGF and VEGF blocks their expression in mononuclear phagocytes and limits neovascularization and leakage in the murine retina.J Neuroinflammation. 2019 Feb 7;16(1):26. doi: 10.1186/s12974-019-1419-2. J Neuroinflammation. 2019. PMID: 30732627 Free PMC article.
-
Choroidal Neovascularization Is Suppressed With Activation of TREM2 in Mononuclear Phagocytes-Brief Report.Arterioscler Thromb Vasc Biol. 2025 May;45(5):769-777. doi: 10.1161/ATVBAHA.124.321809. Epub 2025 Mar 27. Arterioscler Thromb Vasc Biol. 2025. PMID: 40143815 Free PMC article.
-
VEGF-production by CCR2-dependent macrophages contributes to laser-induced choroidal neovascularization.PLoS One. 2014 Apr 8;9(4):e94313. doi: 10.1371/journal.pone.0094313. eCollection 2014. PLoS One. 2014. PMID: 24714223 Free PMC article.
-
Microglia Contribution to the Regulation of the Retinal and Choroidal Vasculature in Age-Related Macular Degeneration.Cells. 2020 May 14;9(5):1217. doi: 10.3390/cells9051217. Cells. 2020. PMID: 32423062 Free PMC article. Review.
-
The role of lymphocytes and phagocytes in age-related macular degeneration (AMD).Cell Mol Life Sci. 2020 Mar;77(5):781-788. doi: 10.1007/s00018-019-03419-4. Epub 2020 Jan 2. Cell Mol Life Sci. 2020. PMID: 31897541 Free PMC article. Review.
Cited by
-
Ocular Vascular Diseases: From Retinal Immune Privilege to Inflammation.Int J Mol Sci. 2023 Jul 28;24(15):12090. doi: 10.3390/ijms241512090. Int J Mol Sci. 2023. PMID: 37569464 Free PMC article. Review.
-
Comprehensive analysis of mouse retinal mononuclear phagocytes.Nat Protoc. 2017 Jun;12(6):1136-1150. doi: 10.1038/nprot.2017.032. Epub 2017 May 4. Nat Protoc. 2017. PMID: 28471458
-
Innate Immunity in Age-Related Macular Degeneration.Adv Exp Med Biol. 2021;1256:121-141. doi: 10.1007/978-3-030-66014-7_5. Adv Exp Med Biol. 2021. PMID: 33848000
-
Role of IL-4 in bone marrow driven dysregulated angiogenesis and age-related macular degeneration.Elife. 2020 May 5;9:e54257. doi: 10.7554/eLife.54257. Elife. 2020. PMID: 32366355 Free PMC article.
-
The Role of Inflammation in Age-Related Macular Degeneration.Int J Biol Sci. 2020 Sep 23;16(15):2989-3001. doi: 10.7150/ijbs.49890. eCollection 2020. Int J Biol Sci. 2020. PMID: 33061811 Free PMC article. Review.
References
-
- Augood CA, Vingerling JR, de Jong PT, Chakravarthy U, Seland J, Soubrane G, Tomazzoli L, Topouzis F, Bentham G, Rahu M et al (2006) Prevalence of age‐related maculopathy in older Europeans: the European Eye Study (EUREYE). Arch Ophthalmol 124: 529–535 - PubMed
-
- Axtell RC, Steinman L (2008) Type 1 interferons cool the inflamed brain. Immunity 28: 600–602 - PubMed
-
- Bruttger J, Karram K, Wortge S, Regen T, Marini F, Hoppmann N, Klein M, Blank T, Yona S, Wolf Y et al (2015) Genetic cell ablation reveals clusters of local self‐renewing microglia in the Mammalian Central Nervous System. Immunity 43: 92–106 - PubMed
-
- Chen M, Zhao J, Luo C, Pandi SP, Penalva RG, Fitzgerald DC, Xu H (2012) Para‐inflammation‐mediated retinal recruitment of bone marrow‐derived myeloid cells following whole‐body irradiation is CCL2 dependent. Glia 60: 833–842 - PubMed
-
- Cirino AC, Mathura JR Jr, Jampol LM (2006) Resolution of activity (choroiditis and choroidal neovascularization) of chronic recurrent punctate inner choroidopathy after treatment with interferon B‐1A. Retina 26: 1091–1092 - PubMed
Publication types
MeSH terms
Substances
LinkOut - more resources
Full Text Sources
Other Literature Sources
Medical
Molecular Biology Databases
