

Chronic miR-29 antagonism promotes favorable plaque remodeling in atherosclerotic mice
- PMID: 27137489
- PMCID: PMC4888854
- DOI: 10.15252/emmm.201506031
Chronic miR-29 antagonism promotes favorable plaque remodeling in atherosclerotic mice
Abstract
Abnormal remodeling of atherosclerotic plaques can lead to rupture, acute myocardial infarction, and death. Enhancement of plaque extracellular matrix (ECM) may improve plaque morphology and stabilize lesions. Here, we demonstrate that chronic administration of LNA-miR-29 into an atherosclerotic mouse model improves indices of plaque morphology. This occurs due to upregulation of miR-29 target genes of the ECM (col1A and col3A) resulting in reduced lesion size, enhanced fibrous cap thickness, and reduced necrotic zones. Sustained LNA-miR-29 treatment did not affect circulating lipids, blood chemistry, or ECM of solid organs including liver, lung, kidney, spleen, or heart. Collectively, these data support the idea that antagonizing miR-29 may promote beneficial plaque remodeling as an independent approach to stabilize vulnerable atherosclerotic lesions.
Keywords: LNA; atherosclerosis; miR‐29; plaque; stability.
© 2016 The Authors. Published under the terms of the CC BY 4.0 license.
Figures
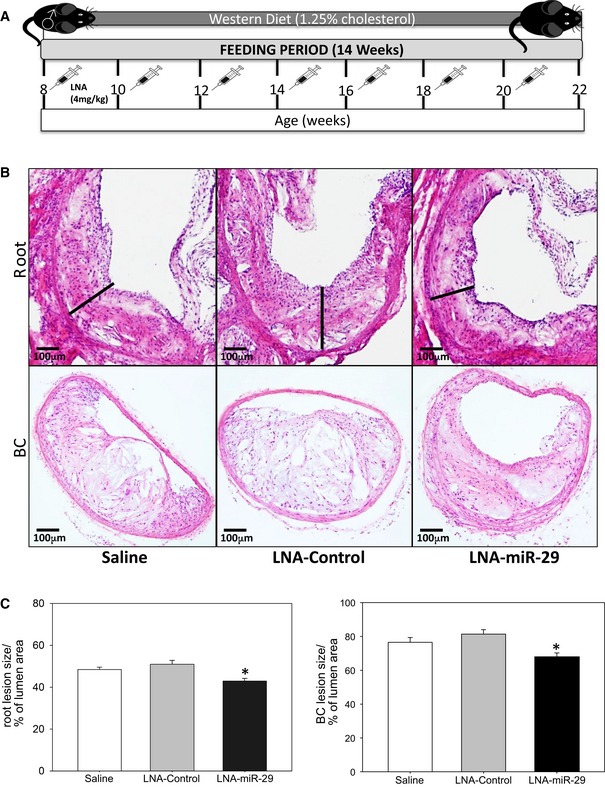
Schematic representation of experimental mouse design. Briefly, 8‐week‐old male ApoE −/− mice on Western diet were injected with equal volume of saline, or 4 mg/kg of LNA‐control, or LNA‐miR‐29 biweekly for 14 weeks.
H&E staining of representative atherosclerotic lesions in aortic root (upper panel: 4× magnification) and brachiocephalic arteries (lower panel: 10× magnification) at 14 week harvest. Lesion width of roots highlighted with black bars. Scale bars, 100 μm.
Quantification of root lesion size (left panel, *P = 0.002), and of brachiocephalic lesion size (right panel, *P = 0.001), both quantified as percent of total lumen area. Data are averaged lesion percentages from 4‐ to 6‐μm serial sections from each animal, n = 9, 13, 15. All of the data represent mean ± SEM, *P < 0.05 versus LNA‐control tissue. Level of significance was determined using one‐way ANOVA with Bonferroni's post‐test.
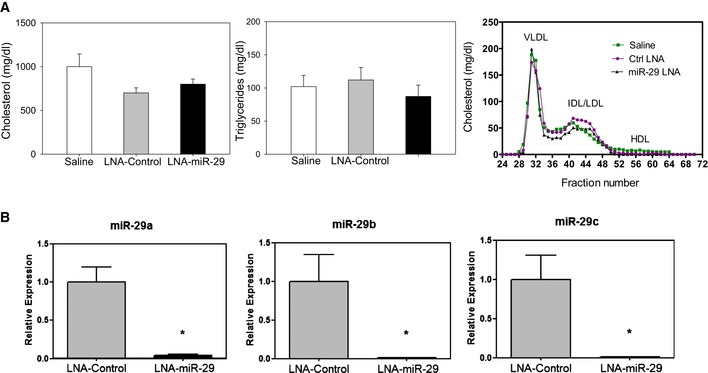
Total cholesterol (left panel), triglycerides (middle panel), and lipoprotein profile (right panel) from saline‐, LNA‐control‐, or LNA‐miR‐29‐injected ApoE−/− mice (n = 6, 9, 13 TC and TG, n = 9, 4, 5, profile). Data represent mean ± SEM
Carotid arteries from LNA‐control‐treated (gray bar) and LNA‐miR‐29‐treated (black bar) mice (both dosed at 4 mg/kg for 14 weeks in atherosclerosis study) were evaluated by qPCR for miR‐29a (left panel), miR‐29b (middle panel), and miR‐29c (right panel) expression levels. Data represent mean ± SEM, *P < 0.001 versus LNA‐control tissue, n = 3 measurements per treatment group repeated twice. Level of significance was determined using one‐way ANOVA with Bonferroni's post‐test.
- A
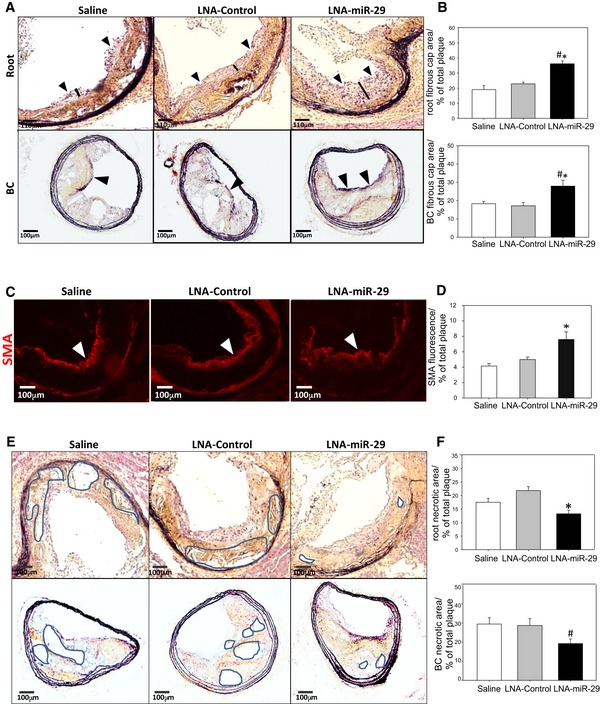
Movat pentachrome staining of aortic root (upper panel: 4× magnification) and brachiocephalic artery fibrous caps (lower panel: 10× magnification) at 14 week harvest, caps denoted with arrowheads and black bars (roots only). Scale bars, 110 μm (upper row) and 100 μm (lower row).
- B
Quantification of aortic root (upper panel, *P = 0.005, # P < 0.001) and brachiocephalic artery (lower panel *P = 0.011, # P < 0.024) fibrous caps, graphed as percent of total plaque area.
- C, D
Representative immunofluorescence (IF) staining of smooth muscle actin (red), denoted by white arrowheads, in aortic root lesions shown at 10× magnification. IF images in (C) are representative of data quantified in (D) calculated from 3‐ to 6‐μm serial sections from animals in independent cohorts. Data represent mean ± SEM, n = 9, 13, 15 for the three groups. Level of significance was determined using Kruskal–Wallis one‐way ANOVA on ranks, *P = 0.002 (D). Scale bars, 100 μm.
- E
Movat pentachrome staining of aortic root (upper panel: 4× magnification, *P < 0.001) and brachiocephalic artery necrotic areas (lower panel: 10× magnification) at 14 week harvest, representative necrotic zones denoted by highlighted areas. Scale bars, 100 μm.
- F
Quantification of aortic root (left panel, *P < 0.001) and brachiocephalic artery (right panel, # P = 0.044) necrotic areas, graphed as percent of total plaque area.
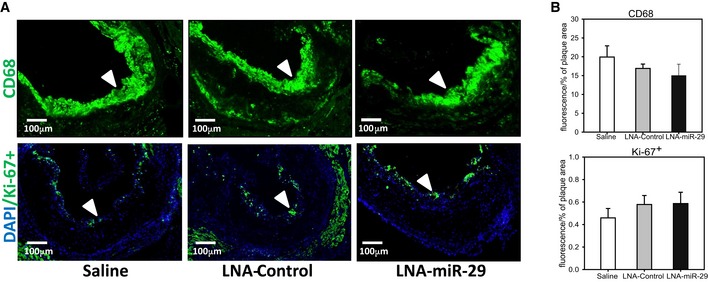
Representative immunofluorescence (IF) staining of aortic root lesions from saline‐, LNA‐control‐, and LNA‐miR‐29‐injected ApoE−/− mice, shown at 10× magnification, denoted by white arrowheads. Top panel shows CD68 (green), bottom panel is Ki‐67+ (green) costained with DAPI (blue). Scale bar, 100 μm.
IF in root lesions quantified for CD68 (middle) and Ki‐67+ (bottom) graphed as percent of plaque area. Data represent mean ± SEM. IF images in (A) are representative of data in (B) quantified from 3‐ to 6‐μm serial sections confirmed from animals in independent cohorts, n = 9, 13, 15.
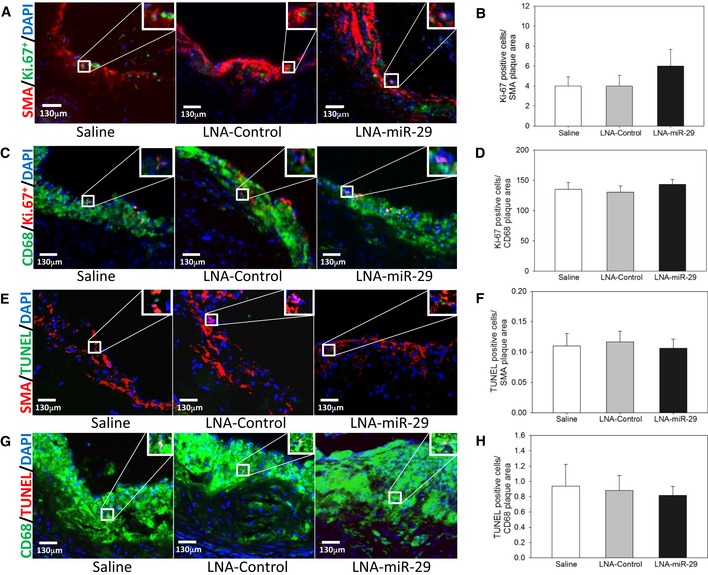
Panel of images shows representative images of smooth muscle actin (red), Ki‐67+ (green), and DAPI (blue) costaining.
Immunofluorescence in root lesions is quantified for cells that are Ki‐67+ (green) and DAPI (blue)‐positive within the SMA (red) plaque area.
Panel of images shows representative images of CD68 (green), Ki‐67+ (red), and DAPI (blue) costaining.
Immunofluorescence in root lesions is quantified for cells that are Ki‐67+ (green) and DAPI (blue)‐positive within the CD68 (green) plaque area.
Panel of images shows representative images of smooth muscle actin (red), TUNEL+ (green), and DAPI (blue) costaining.
Immunofluorescence in root lesions is quantified for cells that are TUNEL+ (green) and DAPI (blue)‐positive within the SMA (red) plaque area.
Panel of images shows representative images of CD68 (green), TUNEL+ (red), and DAPI (blue) costaining.
Immunofluorescence in root lesions is quantified for cells that are TUNEL+ (red) and DAPI (blue)‐positive within the CD68 (green) plaque area.
- A
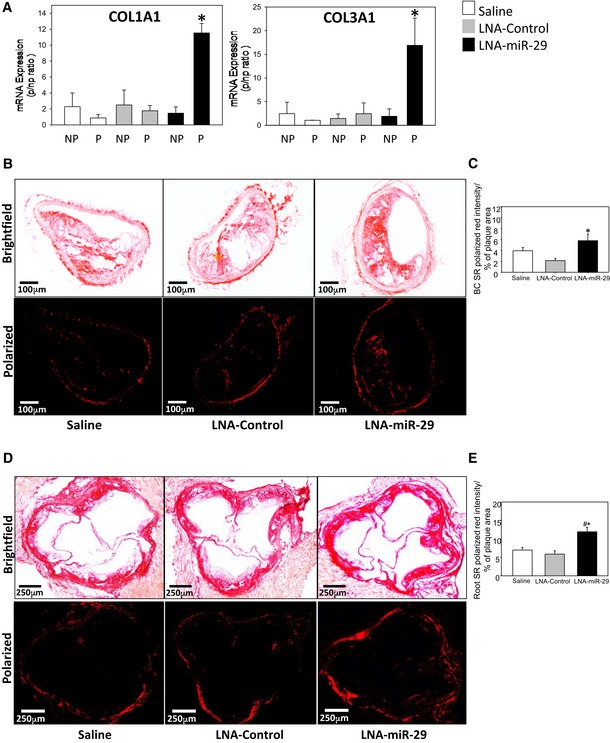
Graphed qPCR quantification of collagen 1A1 (left panel) and collagen 3A1 (right panel) mRNA expression in plaque (P) and non‐plaque (NP) areas of ApoE −/− carotid arteries. Three assays were carried out, and the data represent mRNA expression normalized to NP, and mean ± SEM, n = 4, 3, 4 of mice/group. *P < 0.001 compared with LNA‐miR‐29 non‐plaque region.
- B–E
Picrosirius red staining of collagen in BCs (10× magnification; scale bars, 100 μm) (B); and aortic roots (4× magnification; scale bars, 250 μm) (D); brightfield (upper panel) and polarized light (lower panel) imaging shown. Collagen quantification in BCs (C, *P = 0.016 versus LNA‐control tissue) and roots (E, *P = 0.003 versus LNA‐control tissue, # P = 0.005 versus saline tissue) from polarized light images expressed as a percentage of plaque area. Data represent mean ± SEM, n = 9, 13, 15.
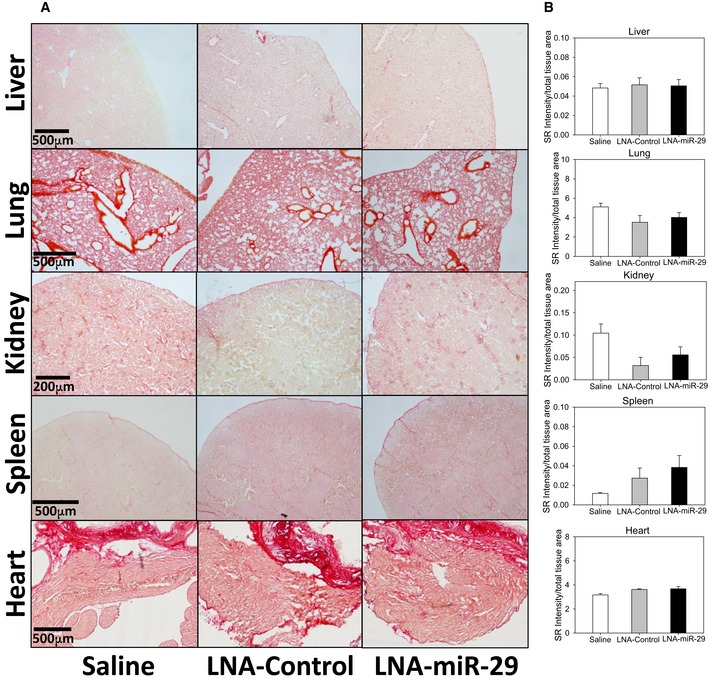
Representative images of fibrosis analysis by picrosirius red staining in solid organs. Scale bars, 500 μm (liver, lung, spleen, and heart) and 200 μm (kidney).
Intensity quantification of picrosirius red staining collagen in various tissues expressed as a percentage of total area. Data graphed represent mean + SEM, level of significance determined using one‐way ANOVA with Bonferroni's post‐test. Data information: Stained images (A) and quantification (B) are representative of 3‐ to 6‐μm serial sections from each animal at 4× magnification, n = 9, 13, 15.
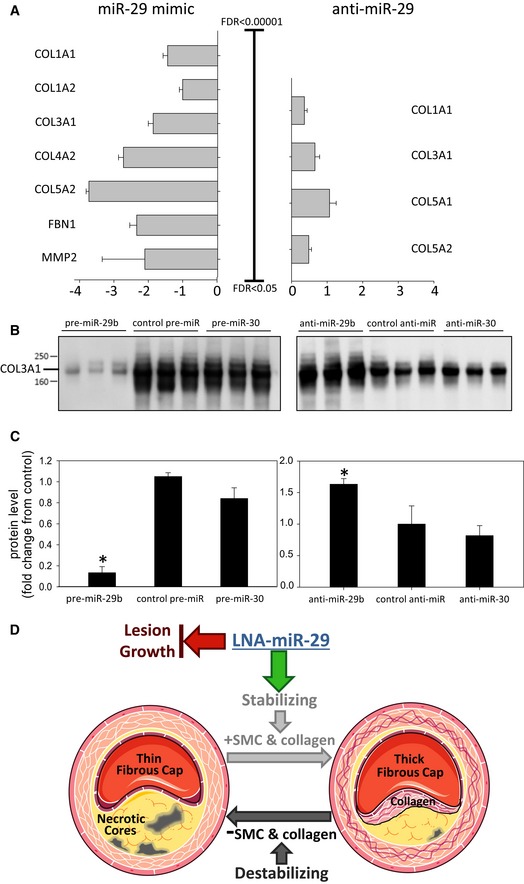
The log (fold change) for differentially secreted proteins following overexpression or inhibition of pre‐miR‐29b was analyzed, and significantly changed miR‐29 confirmed target transcripts are shown. FDR indicates false discovery rate. The complete list of significant proteins is in Appendix Table S1A and B. All data represent mean ± SEM.
Thirty microliters of conditioned medium from VSMC transfected with pre‐miR‐29b and anti‐miR‐29b was separated by SDS–PAGE before validation of COL3A1 by immunoblotting.
Densitometry analysis of COL3A1 signal from blot in (B) (pre‐miR, left *P < 0.001, anti‐miR, right *P = 0.002). All data in (C) represent mean ± SEM, *P < 0.05 versus other groups in anti‐ and pre‐ groups. Level of significance was determined using one‐way ANOVA with Bonferroni's post‐test.
Working model of LNA‐miR‐29 effects on plaque composition as detailed in the data of this paper. Administration of LNA‐miR‐29 blocks lesion growth and increases intra‐plaque collagen expression and fibrous caps, two indices characteristic of more stable plaques. This panel was produced using Servier Medical Art (
www.servier.com ).
References
-
- Abonnenc M, Nabeebaccus AA, Mayr U, Barallobre‐Barreiro J, Dong X, Cuello F, Sur S, Drozdov I, Langley SR, Lu R et al (2013) Extracellular matrix secretion by cardiac fibroblasts: role of microRNA‐29b and microRNA‐30c. Circ Res 113: 1138–1147 - PubMed
-
- Aikawa M, Rabkin E, Okada Y, Voglic SJ, Clinton SK, Brinckerhoff CE, Sukhova GK, Libby P (1998) Lipid lowering by diet reduces matrix metalloproteinase activity and increases collagen content of rabbit atheroma: a potential mechanism of lesion stabilization. Circulation 97: 2433–2444 - PubMed
-
- Ambros V (2004) The functions of animal microRNAs. Nature 431: 350–355 - PubMed
-
- Arroyo LH, Lee RT (1999) Mechanisms of plaque rupture: mechanical and biologic interactions. Cardiovasc Res 41: 369–375 - PubMed
MeSH terms
Substances
Grants and funding
- R01 HL118430/HL/NHLBI NIH HHS/United States
- R01 HL107953/HL/NHLBI NIH HHS/United States
- R01 HL105945/HL/NHLBI NIH HHS/United States
- R01 HL064793/HL/NHLBI NIH HHS/United States
- FS/13/2/29892/BHF_/British Heart Foundation/United Kingdom
- SP/12/5/29574/BHF_/British Heart Foundation/United Kingdom
- R01 HL106063/HL/NHLBI NIH HHS/United States
- P30 CA016359/CA/NCI NIH HHS/United States
- R01 HL081190/HL/NHLBI NIH HHS/United States
- R01 HL061371/HL/NHLBI NIH HHS/United States
- R01 HL091013/HL/NHLBI NIH HHS/United States
- R01 HL119529/HL/NHLBI NIH HHS/United States
LinkOut - more resources
Full Text Sources
Other Literature Sources
Medical
Molecular Biology Databases
Miscellaneous
