

A brain microvasculature endothelial cell-specific viral vector with the potential to treat neurovascular and neurological diseases
- PMID: 27137490
- PMCID: PMC4888852
- DOI: 10.15252/emmm.201506078
A brain microvasculature endothelial cell-specific viral vector with the potential to treat neurovascular and neurological diseases
Abstract
Gene therapy critically relies on vectors that combine high transduction efficiency with a high degree of target specificity and that can be administered through a safe intravenous route. The lack of suitable vectors, especially for gene therapy of brain disorders, represents a major obstacle. Therefore, we applied an in vivo screening system of random ligand libraries displayed on adeno-associated viral capsids to select brain-targeted vectors for the treatment of neurovascular diseases. We identified a capsid variant showing an unprecedented degree of specificity and long-lasting transduction efficiency for brain microvasculature endothelial cells as the primary target of selection. A therapeutic vector based on this selected viral capsid was used to markedly attenuate the severe cerebrovascular pathology of mice with incontinentia pigmenti after a single intravenous injection. Furthermore, the versatility of this selection system will make it possible to select ligands for additional in vivo targets without requiring previous identification of potential target-specific receptors.
Keywords: adeno‐associated virus; brain microvascular endothelial cells; gene therapy; neurovascular diseases.
© 2016 The Authors. Published under the terms of the CC BY 4.0 license.
Figures
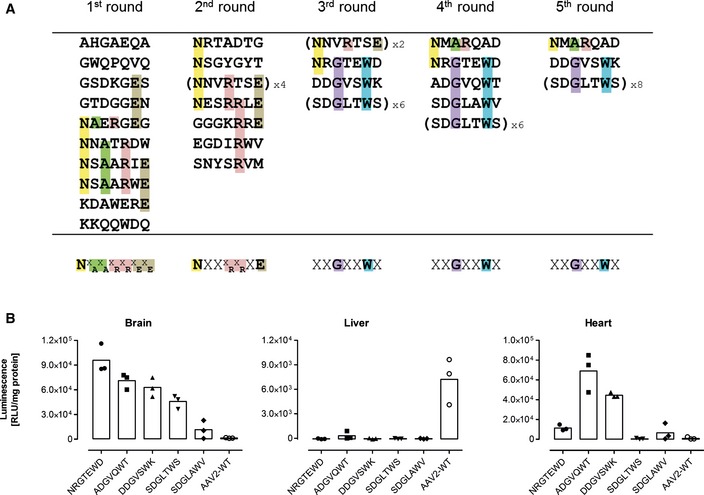
Randomly chosen library peptide inserts (shown in single‐letter code) recovered from the brain. Ten clones were sequenced after each round of selection. Intravenously injected library particles were allowed to circulate for two days in each selection round (n = 1 animal/selection round, age 8–12 weeks). Five selection rounds were performed. Amino acids characterizing the emerging motifs are highlighted in different colors. The consensus motif of each selection round is shown at the bottom of each column. Sequences were considered to show a consensus if at least four different clones displayed the same amino acids at the same position or at two adjacent positions.
In vivo transduction profile of luciferase reporter vectors displaying variants of the enriched library capsid sequence motifs or unmodified wild‐type AAV2 control capsid. Four weeks after i.v. injection of 5 × 10¹⁰ genomic particles/mouse containing a CMV‐luciferase reporter gene, luminescence was measured in the brain and control organs. Data are shown as bars (mean) with plotted individual data points (n = 3 animals/group, age 8–12 weeks).


Luciferase reporter gene vectors displaying the brain‐targeted peptide NRGTEWD (“BR1”), unmodified wild‐type AAV2 capsid, or the previously reported brain‐targeting peptide DSPAHPS (PPS). Vectors were intravenously injected into mice (5 × 10¹⁰ genomic particles/mouse). Panels show representative examples of n = 5 animals, age 8–12 weeks per group. Animals were imaged in dorsal (left panel), ventral (second from left panel), and lateral (second from right and right panel) positions, 14 days after vector injection.
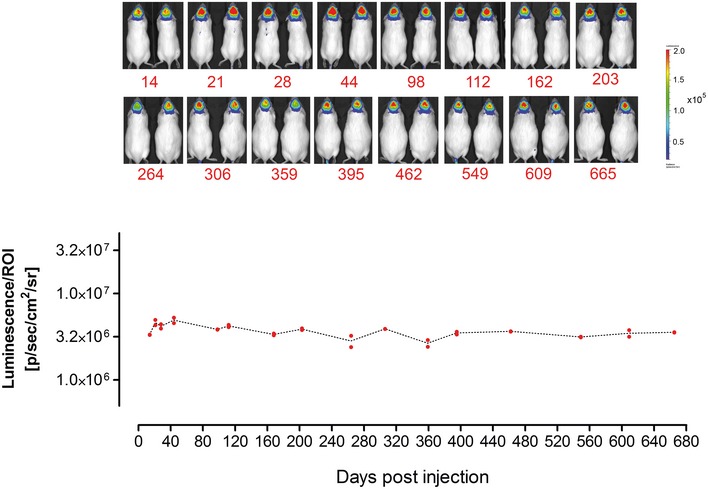
Close‐up imaging of AAV‐BR1‐treated mice. Mice were imaged in dorsal and lateral positions in a different color scheme allowing detailed visualization of the transduced brain in living animals, even as late as at day 264 after vector injection.
Virtual sections: sagittal, coronal, and transaxial (left panels) and three‐dimensional reconstruction (right panel) of the luminescence images of a mouse injected with BR1 vector (as in A). Images were obtained by measuring different wavelengths of the emitted light (Living Image software), confirming the brain as exclusive source of luminescence.

Vector‐mediated luminescence. Transgene expression was measured in AAV‐BR1 harboring the luciferase gene under the control of the CAG promoter and control vectors (AAV‐PPS and wild‐type rAAV2) in brain and off‐target control organs (left panel). Comparison of luminescence in the brain mediated by AAV‐BR1 and control vectors (right panel). ****P < 0.0001 (BR1: brain vs. all), ***P = 0.0002 (PPS: heart vs. brain/muscle), ***P = 0.0001 (PPS: heart vs. lung/liver/spleen/kidney), *P = 0.0101 (WT: heart vs. lung), *P = 0.0120 (WT: heart vs. spleen), *P = 0.0148 (WT: heart vs. kidney), *P = 0.0113 (WT: heart vs. muscle), **P = 0.0011 (brain: BR1 vs. PPS), ***P = 0.0009 (brain: BR1 vs. WT).
Biodistribution of AAV‐BR1 and control vectors (AAV‐PPS and wild‐type rAAV2) in brain and off‐target control organs, excluding spleen (left panel). Genome copy numbers of AAV‐BR1 and control vectors (AAV‐PPS and wild‐type rAAV2) in the brain (right panel). ****P < 0.0001 (BR1: brain vs. liver/kidney/muscle), ***P = 0.0006 (BR1: brain vs. heart), ***P = 0.0003 (BR1: brain vs. lung), **P = 0.0025 (PPS: kidney vs. muscle), *P = 0.0378 (PPS: kidney vs. lung), *P = 0.0114 (PPS: kidney vs. liver), ****P < 0.0001 (WT: liver vs. all), **P = 0.0028 (brain: BR1 vs. PPS/WT).
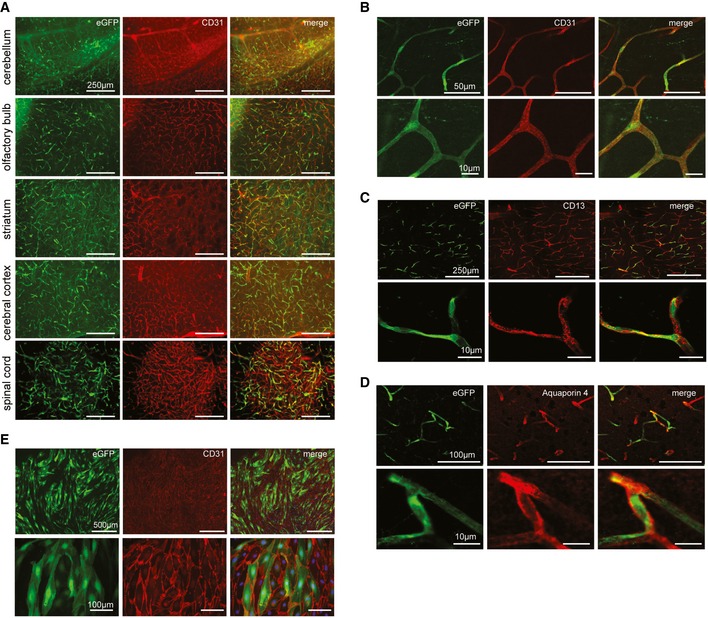
Representative images from cerebellum, olfactory bulb, striatum, cerebral cortex, and the spinal cord, 14 days after vector injection. BR1‐eGFP‐transduced cells (green) were positive for the endothelial marker CD31 (red). Scale bars represent 250 μm.
Higher magnification confocal images. The endothelial marker CD31 (red) colocalizes with vector‐mediated eGFP expression (green). Scale bars represent 50 μm (upper panel) or 10 μm (lower panel).
CD13 staining of pericytes. The vector‐mediated eGFP expression pattern (green) does not colocalize with CD13 (red). Scale bars represent 250 μm (upper panel) or 10 μm (lower panel).
Aquaporin 4 staining of astrocytic endfeet. The vector‐mediated eGFP expression (green) does not colocalize with aquaporin 4 (red). Scale bars represent 100 μm (upper panel) or 10 μm (lower panel).
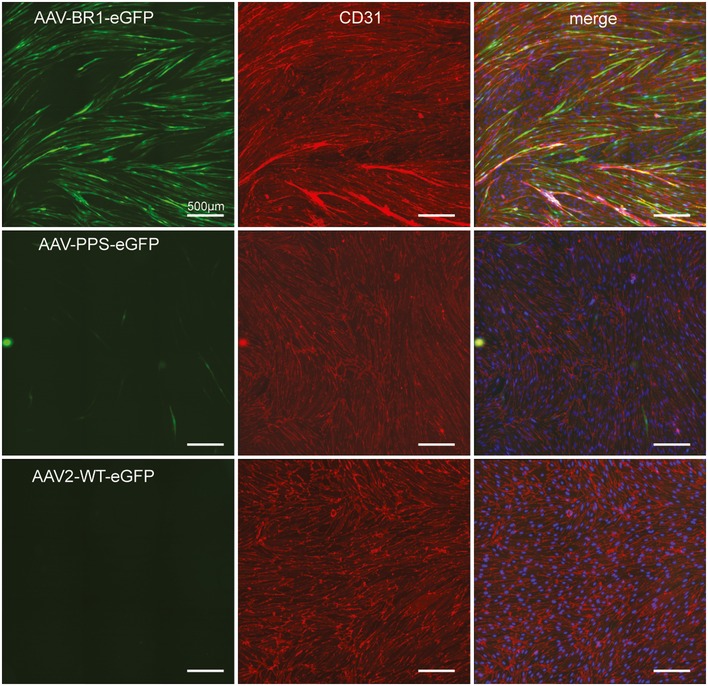
Expression of eGFP in primary brain endothelial cells prepared from C57BL/6 mice, 14 days after injection with AAV‐BR1‐eGFP. Scale bars represent 500 μm (upper panel) or 100 μm (lower panel).


Representative images of mouse brain cortices showing the extent of endothelial transduction by AAV‐BR1‐CAG‐eGFP injected through 4 different routes (intravenous: i.v., intraperitoneal: i.p., intramuscular: i.m., and subcutaneous: s.c.) 14 days after virus injection. Scale bars represent 250 μm.
Tissue sections of different organs (liver, heart, kidney, and muscle) analyzed 14 days after injection of 1.8 × 10¹¹ genomic particles through 4 different routes (as in A). Tissues were analyzed for vector‐mediated eGFP expression (green) and DAPI staining (blue). Scale bars represent 200 μm.

Immunostaining of cerebral microvessels. Treatment with AAV‐BR1‐NEMO normalized string vessels (white arrows, highlighted in white square inset) in Nemo −/+ mice as compared to Nemo −/+ mice treated with the AAV‐BR1‐eGFP control vector at postnatal day 8 (P8). The upper left panel shows the staining in untreated wild‐type control mice. String vessels were identified as capillaries that have lost CD31‐positive (green) endothelial cells but stain for the basement membrane protein collagen IV (red). Scale bars represent 200 μm. The lower right panel summarizes quantitative analysis of string vessels in Nemo −/+ and control mice (Nemo Fl or wild‐type) at P0 (n = 3 animals/group) and at P8 (n = 6 animals/group, *P = 0.0125). String vessels in the cerebral cortex were quantified as percentage of total vessel lengths.
Quantification of active caspase‐3‐positive endothelial cells at P8 (n = 5 animals/group, *P = 0.0201).
Albumin in brain tissue as indicator for BBB leakage. In Nemo −/+ mice treated with AAV‐BR1‐NEMO, less albumin was found in brain tissue, indicating less BBB leakage. Representative Western blot with albumin from P8 Nemo −/+ mice treated with AAV‐BR1‐NEMO or AAV‐BR1‐eGFP control vector, respectively, as well as untreated wild‐type (WT) control mice. Right panel: quantitative analysis of the Western blots (n = 4 animals/group, *P = 0.0283).
Body weight of vector‐treated mice. WT control or Nemo −/+ mice at P8 treated with AAV‐BR1‐NEMO or AAV‐BR1‐eGFP (n = 18 animals/group, *P = 0.0038).
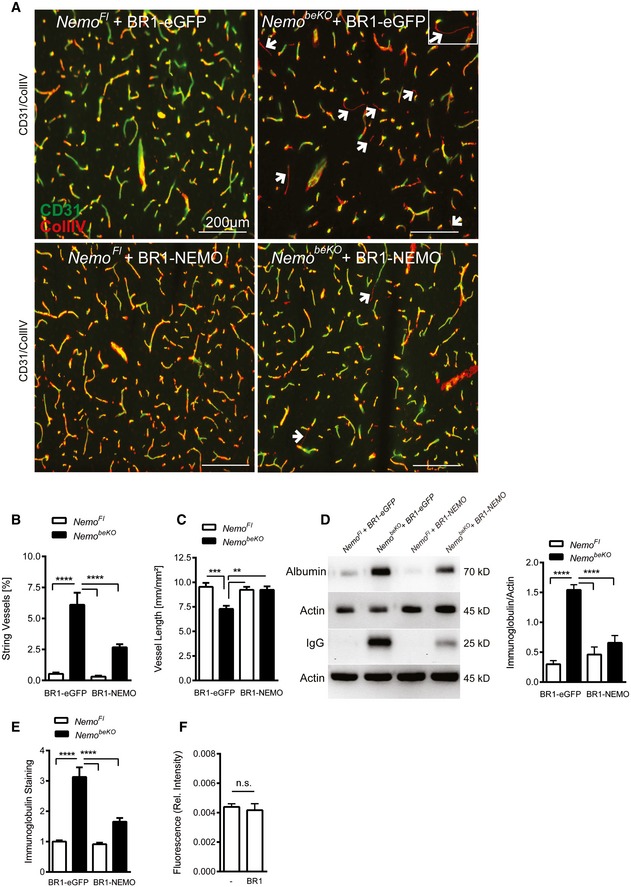
Representative immunostainings of cerebral microvessels. String vessels (white arrows, highlighted in white square inset) were significantly reduced in Nemo beKO mice treated with AAV‐BR1‐NEMO compared to Nemo beKO mice treated with AAV‐BR1‐eGFP control vector. Nemo Fl mice served as control animals. Scale bars represent 200 μm.
Quantification of string vessel lengths in the cerebral cortex as percentage of total vessel lengths. Nemo beKO and Nemo Fl mice were treated with AAV‐BR1‐NEMO or AAV‐BR1‐eGFP control vector (n = 9 Nemo Fl animals + BR1‐eGFP, 10 Nemo beKO animals + BR1‐eGFP, 9 Nemo Fl animals + BR1‐NEMO, and 13 Nemo beKO animals + BR1‐NEMO), ****P < 0.0001.
Total vessel length measured as total CD31‐positive vessels. Vessels were restored in Nemo beKO mice treated with AAV‐BR1‐NEMO compared to the AAV‐BR1‐eGFP injected mice. NemoFl mice served as a control (n = 9 Nemo Fl animals + BR1‐eGFP, 10 Nemo beKO animals + BR1‐eGFP, 9 Nemo Fl animals + BR1‐NEMO, and 13 Nemo beKO animals + BR1‐NEMO), ***P = 0.0007, **P = 0.0038 (NemoKO:eGFP vs. NemoFl:NEMO), **P = 0.0014 (NemoKO:NEMO vs. NemoKO:eGFP).
IgG and albumin Western blots of brain lysates. Less leakage in the BBB was detected in Nemo beKO mice treated with AAV‐BR1‐NEMO than in Nemo beKO mice injected with AAV‐BR1‐eGFP (the right panel indicates the quantified gel intensity under the various treatment conditions; n = 5 animals per group). Nemo Fl mice served as controls, ****P < 0.0001.
Quantitative immunoglobulin staining of coronal brain sections of Nemo Fl and Nemo beKO mice. Ig extravasation was significantly reduced in AAV‐BR1‐NEMO‐treated mice (n = 9 Nemo Fl animals + BR1‐eGFP, 10 Nemo beKO animals + BR1‐eGFP, 9 Nemo Fl animals + BR1‐NEMO, and 13 Nemo beKO animals + BR1‐NEMO), ****P < 0.0001.
Effect of AAV‐BR1 vector on BBB permeability. No vector (left) or empty AAV‐BR1 vector (right) was injected i.v. to wild‐type mice and BBB permeability was assessed by extravasation of the fluorescent tracer sodium fluorescein (n = 7 animals per group). No significant difference was detected (n.s.).
Comment in
-
Brain endothelial cell-targeted gene therapy of neurovascular disorders.EMBO Mol Med. 2016 Jun 1;8(6):592-4. doi: 10.15252/emmm.201606407. Print 2016 Jun. EMBO Mol Med. 2016. PMID: 27189170 Free PMC article.
References
-
- de Backer MW, Brans MA, Luijendijk MC, Garner KM, Adan RA (2010) Optimization of adeno‐associated viral vector‐mediated gene delivery to the hypothalamus. Hum Gene Ther 21: 673–682 - PubMed
-
- Bartlett JS, Kleinschmidt J, Boucher RC, Samulski RJ (1999) Targeted adeno‐associated virus vector transduction of nonpermissive cells mediated by a bispecific F(ab ‘gamma)(2) antibody. Nat Biotechnol 17: 181–186 - PubMed
-
- Bell P, Moscioni AD, McCarter RJ, Wu D, Gao G, Hoang A, Sanmiguel JC, Sun X, Wivel NA, Raper SE et al (2006) Analysis of tumors arising in male B6C3F1 mice with and without AAV vector delivery to liver. Mol Ther 14: 34–44 - PubMed
-
- Cearley CN, Wolfe JH (2006) Transduction characteristics of adeno‐associated virus vectors expressing cap serotypes 7, 8, 9, and Rh10 in the mouse brain. Mol Ther 13: 528–537 - PubMed
Publication types
MeSH terms
LinkOut - more resources
Full Text Sources
Other Literature Sources
Medical
