. 2016 Jun 17;291(25):13257-70.
doi: 10.1074/jbc.M116.718189. Epub 2016 May 2.

Ezrin Inhibition Up-regulates Stress Response Gene Expression

Affiliations

Ezrin Inhibition Up-regulates Stress Response Gene Expression

Haydar Çelik et al. J Biol Chem. .

Abstract

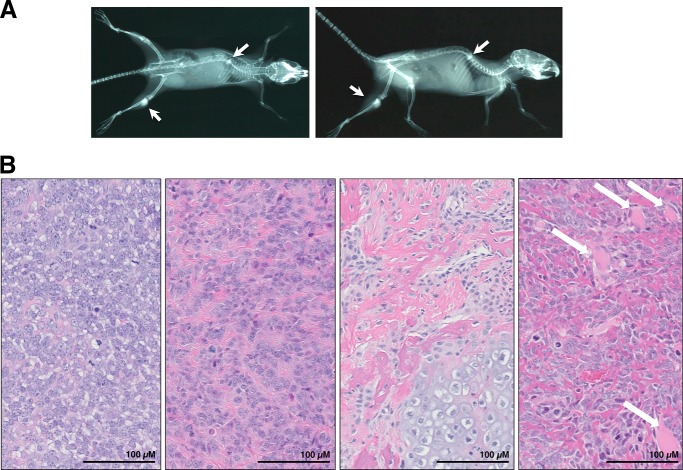
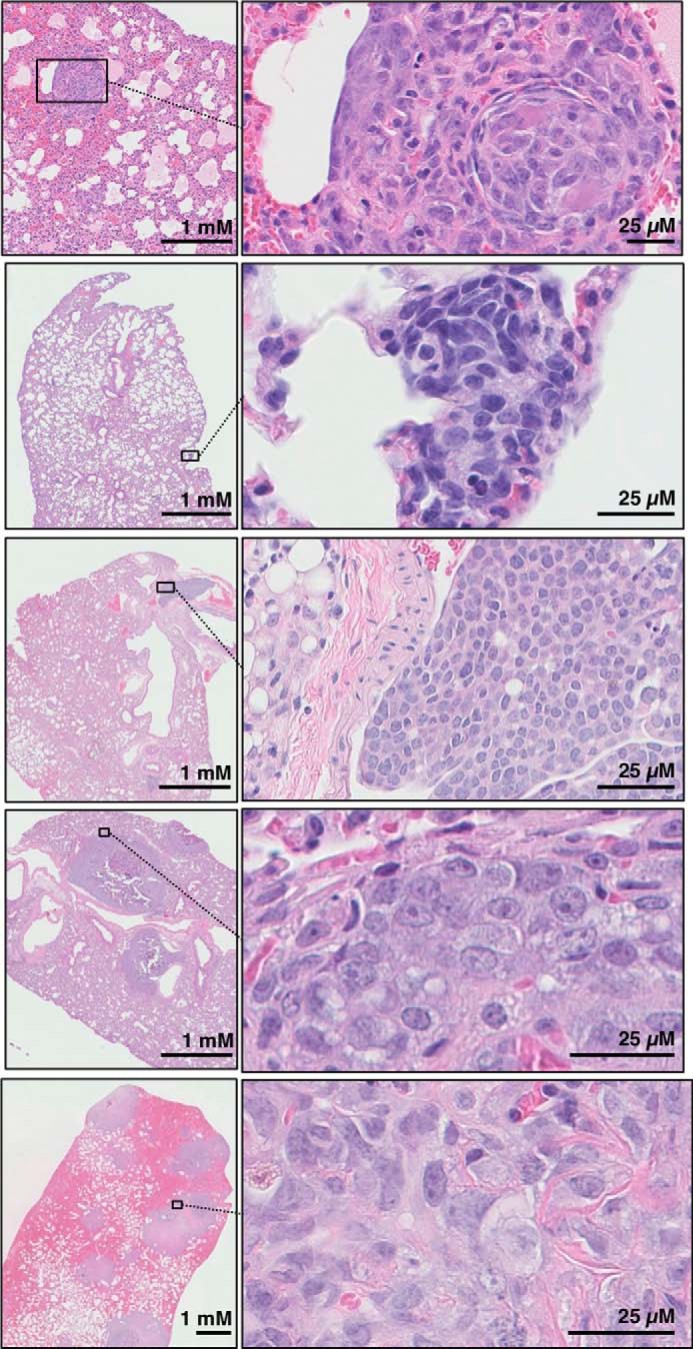
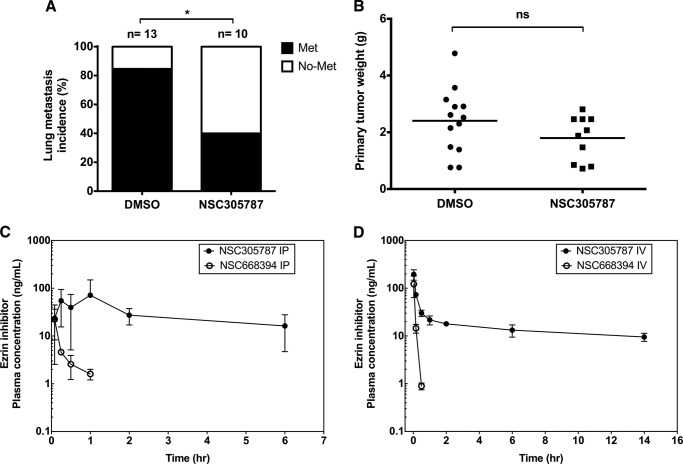
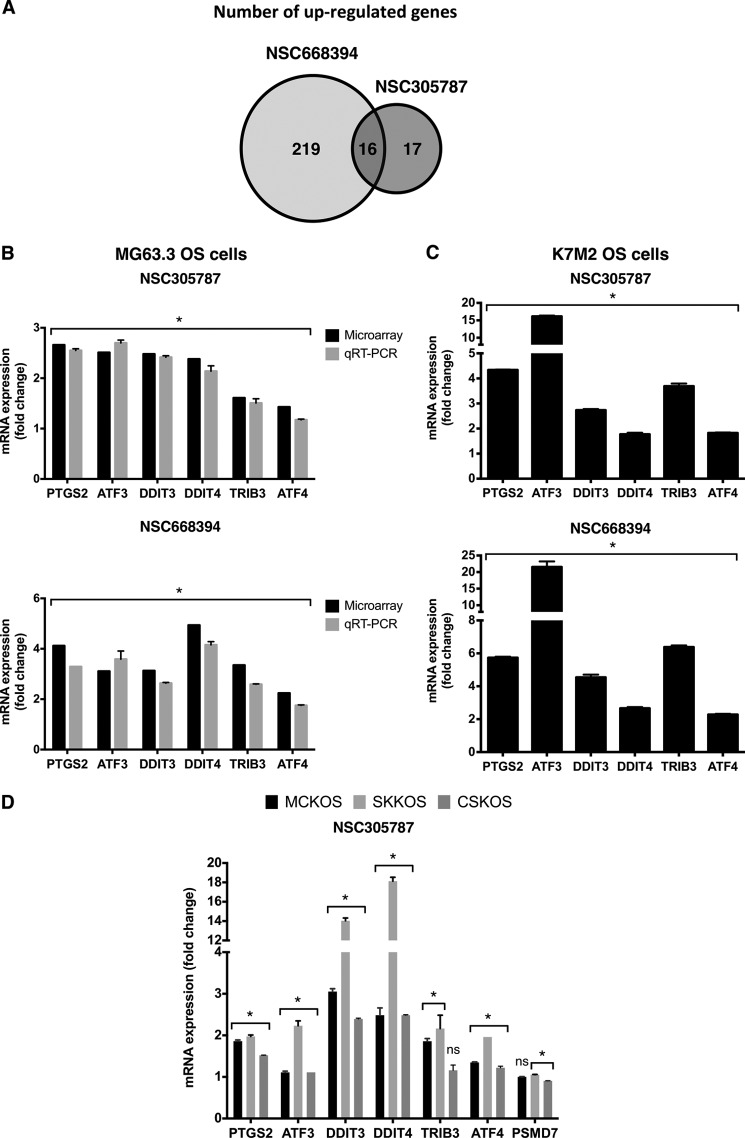
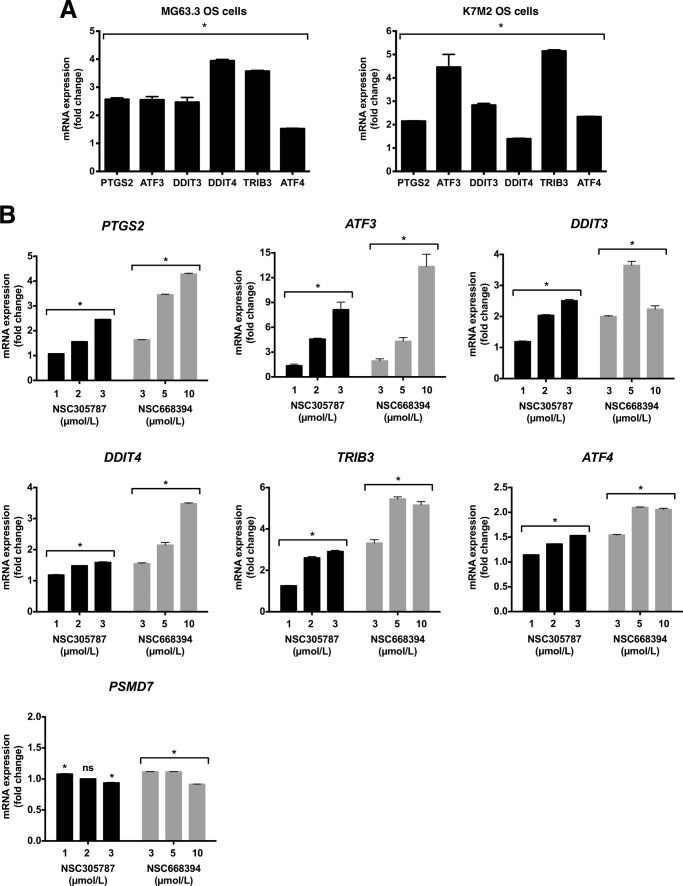
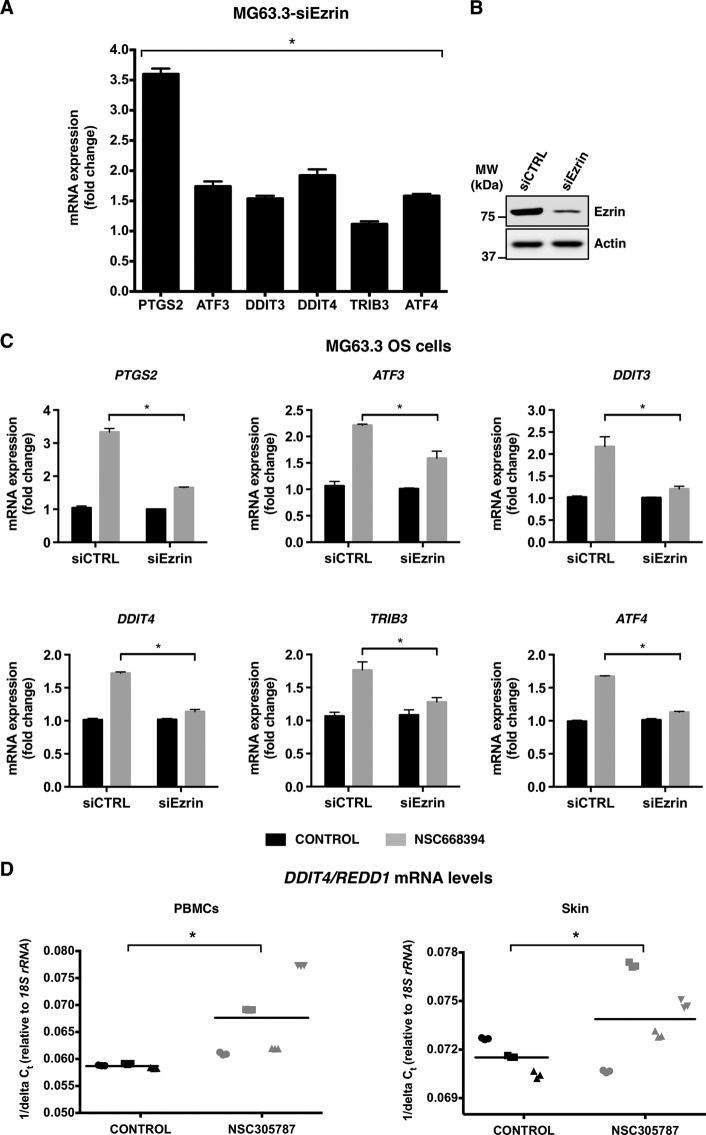
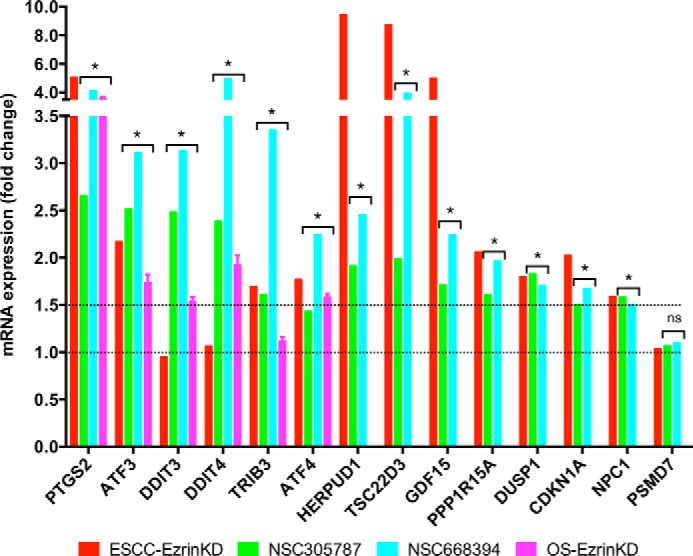
Ezrin is a member of the ERM (ezrin/radixin/moesin) family of proteins that links cortical cytoskeleton to the plasma membrane. High expression of ezrin correlates with poor prognosis and metastasis in osteosarcoma. In this study, to uncover specific cellular responses evoked by ezrin inhibition that can be used as a specific pharmacodynamic marker(s), we profiled global gene expression in osteosarcoma cells after treatment with small molecule ezrin inhibitors, NSC305787 and NSC668394. We identified and validated several up-regulated integrated stress response genes including PTGS2, ATF3, DDIT3, DDIT4, TRIB3, and ATF4 as novel ezrin-regulated transcripts. Analysis of transcriptional response in skin and peripheral blood mononuclear cells from NSC305787-treated mice compared with a control group revealed that, among those genes, the stress gene DDIT4/REDD1 may be used as a surrogate pharmacodynamic marker of ezrin inhibitor compound activity. In addition, we validated the anti-metastatic effects of NSC305787 in reducing the incidence of lung metastasis in a genetically engineered mouse model of osteosarcoma and evaluated the pharmacokinetics of NSC305787 and NSC668394 in mice. In conclusion, our findings suggest that cytoplasmic ezrin, previously considered a dormant and inactive protein, has important functions in regulating gene expression that may result in down-regulation of stress response genes.

Keywords: ezrin; gene expression; metastasis; osteosarcoma; small molecule; transgenic mice.


Figures

FIGURE 1.
FIGURE 1.
Histopathologic analysis of transgenic mice (Osx-Cre+p53fl/flpRBfl/fl) demonstrates typical pathological features of osteosarcoma. A, x-ray imaging of a representative animal demonstrating osteosarcoma of the hindlimb and spine in the coronal plane (left panel) and the sagittal plane (right panel). Arrows indicate osteosarcoma lesions. B, four representative hematoxylin and eosin images of Osx-Cre+p53fl/flpRBfl/fl mice show a histologically classical ostesarcoma morphology similar to that seen in human tumors, with different amounts of osteoid production along with osteoblastic areas. Diverse morphology was seen in different parts of the same tumor, as well as in different tumors from differing mice. In some cases, tumor showed extension and invasion into the surrounding muscle tissues (white arrows). Scale is indicated on each image.
FIGURE 2.
FIGURE 2.
Osx-Cre+p53fl/flpRBfl/fl mice develop lung metastases that are detectable at necropsy. Representative images of lung metastasis with low (left panels) and high (right panels) magnification. Lung metastasis in all animals showed the same histopathological features as the primary tumor in the same subject.
FIGURE 3.
FIGURE 3.
NSC305787 inhibits pulmonary metastasis in a transgenic mouse model of osteosarcoma (Osx-Cre+p53fl/flpRBfl/fl) and has a more favorable pharmacokinetic profile compared with NSC668394 in the mouse model. A, the incidence of lung metastasis in NSC305787-treated (n = 10; 240 μg/kg i.p. administration once daily, five times per week) and untreated (n = 13) mice were compared (*, p = 0.039, Fisher's exact test). B, no significant difference was observed in primary tumor growth between compound-treated (n = 10) and vehicle control animals (n = 13) (ns, non-significant; p = 0.14, Mann-Whitney U test). C and D, time course of NSC305787 and NSC668394 concentrations in female Balb/c mouse plasma following i.p. (C) and i.v. (D) administration at single doses of 240 and 226 μg/kg, respectively. Mean concentration ± S.D. from three animals was determined at each time point.
FIGURE 4.
FIGURE 4.
The small molecule inhibitors of ezrin up-regulate the integrated stress response-related genes. A, a Venn diagram showing number of up-regulated genes in response to either NSC305787 or NSC668394 treatment (p < 0.05, with a fold change cutoff of >1.5). B, validation of a set of genes identified from microarray analysis comparing MG63.3 human osteosarcoma cells treated with either NSC305787 or NSC668394 or vehicle control using real time qPCR. The cells were treated with 3.0 μmol/liter of either compound or vehicle control for 6 h, and mRNA levels of PTGS2, ATF3, DDIT3, DDIT4, TRIB3, and ATF4 were measured. The results were normalized to 18S rRNA levels and expressed as fold change over the control group. The values are presented as the means and standard deviations of triplicate determinations. (*, p < 0.05: for microarray analysis, statistical significance between treatment versus control group was determined using an ANOVA model (n = 5 biological replicates); for RT-qPCR experiments statistical significance between treatment versus control group (n = 3 technical replicates) was determined by an unpaired Student's t test). C, K7M2 mouse osteosarcoma cells were treated with 3.0 μmol/liter of either compound for 6 h, and expression levels of the selected integrated stress response signature genes were determined using mouse-specific primers as explained in B (*, p < 0.05, compared with control; using an unpaired Student's t test). D, MCKOS, SKKOS, and CSKOS canine osteosarcoma cells were treated with 5.0 μmol/liter of NSC305787 for 6 h, and expression levels of the selected integrated stress response signature genes were determined using canine-specific primers as explained in B except that GAPDH was used for normalization (*, p < 0.05, compared with control; using an unpaired Student's t test; ns, non-significant).
FIGURE 5.
FIGURE 5.
Pharmacological inhibition of ezrin by NSC305787 and NSC668394 up-regulates the expression of integrated stress response signature genes in a dose-dependent manner. A, human MG63.3 and mouse K7M2 osteosarcoma cells were treated with 20.0 μmol/liter MMV667492 or vehicle control for 6 h, and mRNA levels of PTGS2, ATF3, DDIT3, DDIT4, TRIB3, and ATF4 were measured by real time qPCR. The results were normalized to 18S rRNA levels and expressed as fold change over the control group. The values are presented as the means and standard deviations of triplicate determinations (*, p < 0.05, compared with control; using an unpaired Student's t test). B, K7M2 mouse osteosarcoma cells were treated with indicated concentrations of compounds, NSC305787 or NSC668394, or vehicle control for 6 h, and mRNA levels of PTGS2, ATF3, DDIT3, DDIT4, TRIB3, and ATF4 were measured by real time qPCR. The results were normalized to 18S rRNA levels and expressed as fold change over the control group. The values are presented as the means and standard deviations of triplicate determinations (*, p < 0.05, compared with control; using an unpaired Student's t test; ns, non-significant).
FIGURE 6.
FIGURE 6.
Suppression of ezrin expression leads to increased mRNA levels of downstream integrated stress response signaling effector genes and results in loss of transcriptional response to anti-ezrin compound. A, expression of ezrin protein was inhibited by siRNA targeting ezrin in human MG63.3 osteosarcoma cells and mRNA levels of a set of selected integrated stress response signature genes including PTGS2, ATF3, DDIT3, DDIT4, TRIB3, and ATF4 were measured by real time qPCR. The results were normalized to 18S rRNA levels and expressed as fold change over the control. The values are presented as the means and standard deviations of triplicate determinations (*, p < 0.05, compared with siControl; using an unpaired Student's t test). B, Western blot showing ezrin levels from A. The protein levels were detected from total cell lysates at 72 h after transfection of cells with siRNA for ezrin. MW, molecular mass. C, ezrin expression was inhibited by a siRNA in MG63.3 cells, and cells were treated with either 3.0 μmol/liter of NSC668394 or vehicle control for 6 h on the third day of transfection. The mRNA levels of PTGS2, ATF3, DDIT3, DDIT4, TRIB3, and ATF4 were measured by real time qPCR. The results were normalized to 18S rRNA levels and expressed as fold change over the vehicle control in both control siRNA and ezrin siRNA-transfected cells. The values are presented as the means and standard deviations of triplicate determinations (*, p < 0.05, compared with siControl; using an unpaired Student's t test). D, DDIT4/REDD1 gene may serve as a pharmacodynamic marker of response to ezrin inhibition by NSC305787 in vivo. DDIT4/REDD1 mRNA levels of PBMCs and skin were measured by real time qPCR after a short term i.p. treatment of CD-1 mice with NSC305787 at a dose of 240 μg/kg once daily for 3 consecutive days. The results were normalized to 18S rRNA levels and expressed as 1/ΔCt. Each sample was analyzed in triplicate, and each mouse in treatment and control group is designated by a specific symbol. Horizontal lines indicate mean values of all measurements in each group (*, p < 0.05, compared with control; using an unpaired Student's t test).
FIGURE 7.
FIGURE 7.
Suppression of ezrin expression and its pharmacological inhibition results in increased mRNA levels of integrated stress response signature genes in both osteosarcoma and ESCC. The published data on mRNA expression levels of integrated stress response signature genes in ESCC cells following ezrin depletion (42, 43) were compared with those generated in this work using specific molecule inhibitors of ezrin and siRNA-mediated silencing of ezrin (*, p < 0.05: for microarray analysis, statistical significance between treatment versus control group was determined using ANOVA model (n = 5 biological replicates); for RT-qPCR experiments statistical significance between treatment versus control group (n = 3 technical replicates) was determined by an unpaired Student's t test; ns, non-significant).

References

    1. Bretscher A., Edwards K., and Fehon R. G. (2002) ERM proteins and merlin: integrators at the cell cortex. Nat. Rev. Mol. Cell Biol. 3, 586–599 - PubMed
    1. Fehon R. G., McClatchey A. I., and Bretscher A. (2010) Organizing the cell cortex: the role of ERM proteins. Nat. Rev. Mol. Cell Biol. 11, 276–287 - PMC - PubMed
    1. Federici C., Brambilla D., Lozupone F., Matarrese P., de Milito A., Lugini L., Iessi E., Cecchetti S., Marino M., Perdicchio M., Logozzi M., Spada M., Malorni W., and Fais S. (2009) Pleiotropic function of ezrin in human metastatic melanomas. Int. J. Cancer 124, 2804–2812 - PubMed
    1. Leiphrakpam P. D., Rajput A., Mathiesen M., Agarwal E., Lazenby A. J., Are C., Brattain M. G., and Chowdhury S. (2014) Ezrin expression and cell survival regulation in colorectal cancer. Cell. Signal. 26, 868–879 - PMC - PubMed
    1. Köbel M., Langhammer T., Hüttelmaier S., Schmitt W. D., Kriese K., Dittmer J., Strauss H. G., Thomssen C., and Hauptmann S. (2006) Ezrin expression is related to poor prognosis in FIGO stage I endometrioid carcinomas. Mod. Pathol. 19, 581–587 - PubMed

Publication types

MeSH terms