. 2016 Aug;24(7):1187-98.
doi: 10.1038/mt.2016.87. Epub 2016 May 3.

Safe and Efficient Gene Therapy for Pyruvate Kinase Deficiency

Affiliations

Safe and Efficient Gene Therapy for Pyruvate Kinase Deficiency

Maria Garcia-Gomez et al. Mol Ther. 2016 Aug.

Abstract

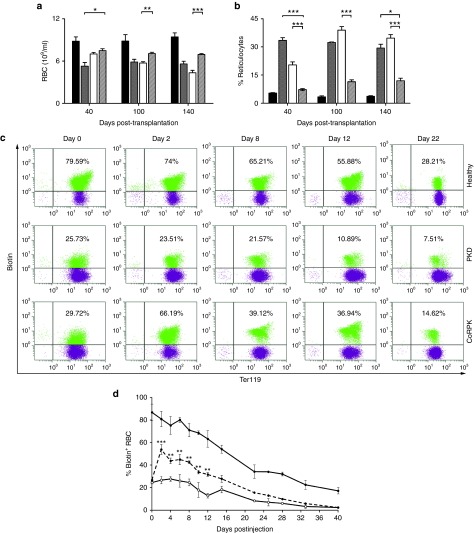
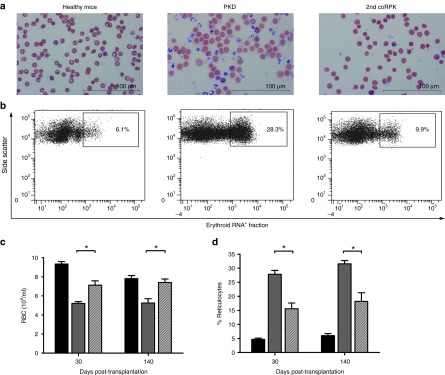
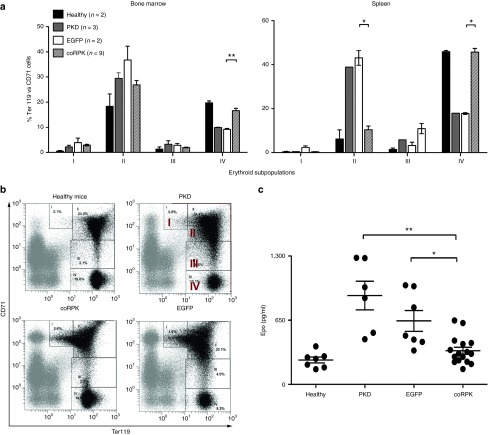
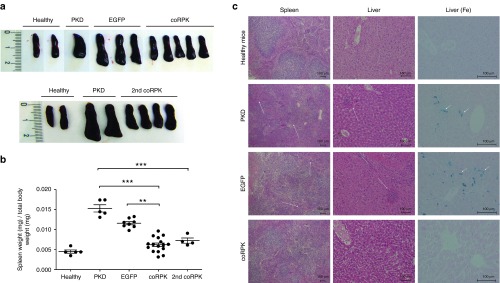
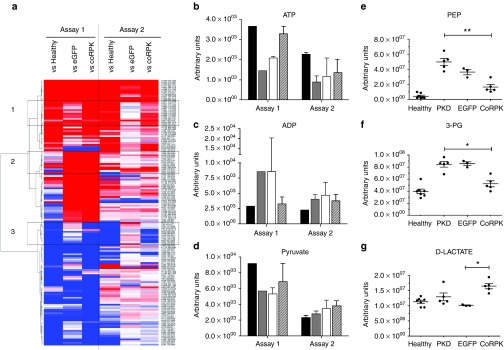
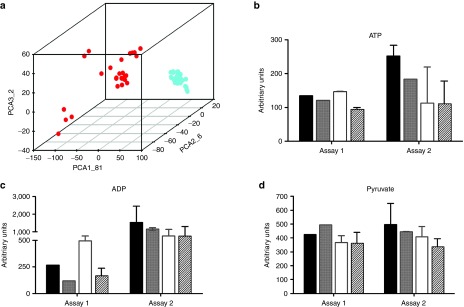
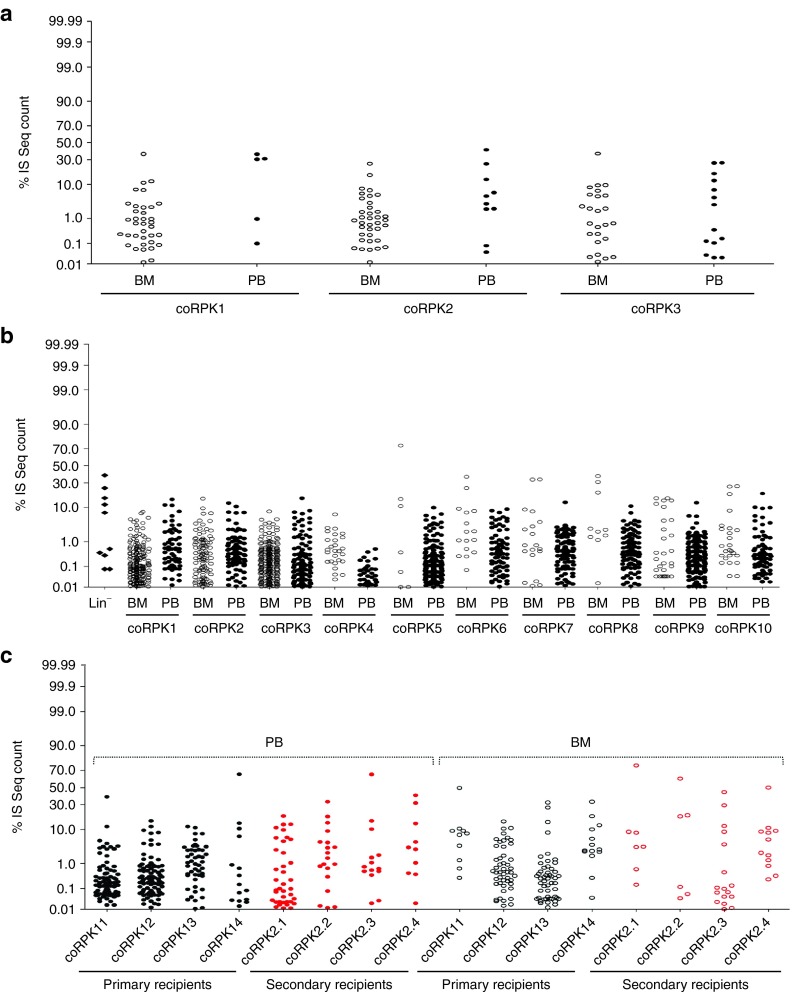
Pyruvate kinase deficiency (PKD) is a monogenic metabolic disease caused by mutations in the PKLR gene that leads to hemolytic anemia of variable symptomatology and that can be fatal during the neonatal period. PKD recessive inheritance trait and its curative treatment by allogeneic bone marrow transplantation provide an ideal scenario for developing gene therapy approaches. Here, we provide a preclinical gene therapy for PKD based on a lentiviral vector harboring the hPGK eukaryotic promoter that drives the expression of the PKLR cDNA. This therapeutic vector was used to transduce mouse PKD hematopoietic stem cells (HSCs) that were subsequently transplanted into myeloablated PKD mice. Ectopic RPK expression normalized the erythroid compartment correcting the hematological phenotype and reverting organ pathology. Metabolomic studies demonstrated functional correction of the glycolytic pathway in RBCs derived from genetically corrected PKD HSCs, with no metabolic disturbances in leukocytes. The analysis of the lentiviral insertion sites in the genome of transplanted hematopoietic cells demonstrated no evidence of genotoxicity in any of the transplanted animals. Overall, our results underscore the therapeutic potential of the hPGK-coRPK lentiviral vector and provide high expectations toward the gene therapy of PKD and other erythroid metabolic genetic disorders.


Figures

Figure 1
Figure 1
Correction of pyruvate kinase deficiency (PKD) phenotype in peripheral blood of primary recipients after genetic correction. (a) RBCs and (b) reticulocyte levels in healthy (black bar, n = 5) and PKD anemic mice (gray bar, n = 6), and PKD anemic mice that were tranplanted with EGFP (white bar, n = 9) or coRPK-transduced cells (scratched bar, n = 17). Data are represented as the average ± SEM and were analyzed by nonparametric Kruskal-Wallis test. (c) Flow cytometry strategy used to detect the biotin-labeled RBCs throughout the time and (d) RBC survival kinetics in healthy (black dots, n = 2), anemic (white dots, n = 2) and genetically corrected mice (discontinuous line, n = 4). Data are represented as the average ± standard error of the mean and were analyzed by two-way analysis of variance test. Healthy, nontransplanted control mice; PKD, nontransplanted PKD mice; coRPK, PKD mice expressing the therapeutic transgene.
Figure 2
Figure 2
Pyruvate kinase deficiency phenotype correction in secondary transplanted mice. (a) Brilliant Cresyl blue staining of blood smears from nontransplanted mice and secondary (2nd coRPK) recipients to identify reticulocyte population (in blue). (b) Flow cytometry analysis of reticulocyte levels in peripheral blood. (c) RBCs and (d) reticulocyte percentage in secondary transplanted mice expressing the coRPK transgene (scratched bar, n = 4), in healthy mice (black bar, n = 3) and in anemic control mice (gray bar, n = 3). Data are represented the average ± standard error of the mean and were analyzed by nonparametric two-tailed Mann-Whitney test.
Figure 3
Figure 3
Normalization of the erythroid differentiation pattern in genetically corrected mice. (a) Percentages of the different erythroid subpopulation in bone marrow and spleen at 140 days after transplant. (b) Representative dot plots of the flow cytometry strategy used. The expression intensity of the CD71 and Ter119 markers allows for identifying four erythroid subpopulations: population I: early proerythroblasts (Ter119med CD71high), population II: basophilic erythroblasts (Ter119high CD71high), population III: late basophilic and polychromatophilic erythroblasts (Ter119high CD71med), and population IV: orthochromatophilic erythroblasts, reticulocytes and mature erythroid cells (Ter119high CD71low). (c) Plasma Epo levels measured by enzyme-linked immunosorbent assay (ELISA) in nontransplanted and transplanted mice. Dots represent values of individual mice. Lines represent average ± standard error of the mean and were analyzed by nonparametric Kruskal-Wallis test. Healthy, nontransplanted control mice; PKD, nontransplanted PKD mice; EGFP, PKD mice expressing the EGFP transgene; coRPK, PKD mice expressing the therapeutic transgene. PKD, pyruvate kinase deficiency.
Figure 4
Figure 4
Reversion of splenomegaly and organ pathology in genetically corrected mice at 140 days post-transplantation. (a) Pictures of representative spleens and (b) ratio of spleen weight to total body weight from primary and secondary transplanted pyruvate kinase deficiency (PKD) mice. Dots represent values of individual mice. Lines represent average ± standard error of the mean per group. Data were analyzed by nonparametric Kruskal-Wallis test. (c) Histological study of spleen and liver from primary transplanted PKD mice. First and second column show the representative histology sections of spleen and liver stained with hematoxylin-eosin and photographed using a 4 and 10× objective, respectively, in a light microscope. Arrows point to erythroid cell clusters indicative of extramedullary erythropoiesis. Third column shows Prussian blue staining (Fe) of liver sections to detect iron deposits indicated by arrowheads. Photographs were taken using a 20× objective. Group legends as in Figure 3. 2nd coRPK, secondary recipients.
Figure 5
Figure 5
Metabolic profiling in RBC samples from mice transplanted with genetically modified cells. Analysis of significant metabolic profile changes in healthy and transplanted mice by comparison to pyruvate kinase deficiency (PKD) animals in two independent experiments. (a) Complete RBC heat map obtained by untargeted profiling, where higher and lower metabolite levels are represented in red and blue respectively. Metabolites listed have at least one comparison that is significant using the following criteria: absolute fold change >1.5; minimal signal >2,000; adjusted P value < 0.01. Black boxes highlight cluster of metabolite changes with distinct profile among the groups. (b–d) ATP, ADP, and pyruvate levels in RBCs, respectively, measured by untargeted profiling by comparison to PKD mice at 140 days after transplant. Assay 1: Healthy mice (black bars) n = 1, PKD (gray bars) n = 1, hPGK-EGFP (white bars) n = 2, hPGK-coRPK (scratched bars) n = 3. Assay 2: Healthy mice n = 2, PKD n = 2, hPGK-EGFP n = 6, hPGK-coRPK n = 10. (e–g) RBC targeted metabolic profiling of a selected number of metabolites involved in the glycolytic pathway (phosphoenolpyruvate, 3-phosphoglyceric acid and D-lactic acid, respectively) at 280 days post-transplantation. Dots represent values of individual mice. Lines represent average ± standard error of the mean and were analyzed by nonparametric Kruskal-Wallis test. Assay 2: Healthy mice n = 7, PKD n = 5, hPGK-EGFP n = 3, hPGK-coRPK n = 5.
Figure 6
Figure 6
Untargeted metabolic profiling in WBC samples from mice transplanted with genetically modified cells. (a) Principal component analysis of untargeted metabolite profile in RBCs (red dots) and WBCs (blue dots) in control and transplanted mice. (b–d) ATP, ADP, and pyruvate levels, respectively, in WBCs by comparison to pyruvate kinase deficiency (PKD) mice. Assay 1: healthy mice (black bars) n = 1, PKD (gray bars) n = 1, hPGK-EGFP (white bars) n = 2, hPGK-coRPK (scratched bars) n = 3. Assay 2: healthy mice n = 2, PKD n = 2, hPGK-EGFP n = 6, hPGK-coRPK n = 10. Data represent the average ± standard error of the mean per group and were analyzed by nonparametric Kruskal-Wallis test.
Figure 7
Figure 7
Clonal abundance analysis of coRPK-LV-transduced cells. Dots plot representation of clonal abundance of pooled integrations in each mouse from assays 1 (a) and 2 (b,c). The relative percentage (y-axis) for each integration site is relative to the total number of sequences reads obtained in each dataset. BM, bone marrow; IS, integration site; PB, peripheral blood; coRPK1-14, mice transplanted with hematopoietic cells transduced with the therapeutic vector. coRPK 2.1-2.4, secondary recipients transplanted with BM cells from coRPK 11-14 primary mice.

References

    1. Zanella, A, Bianchi, P and Fermo, E (2007). Pyruvate kinase deficiency. Haematologica 92: 721–723. - PubMed
    1. Pissard, S, Max-Audit, I, Skopinski, L, Vasson, A, Vivien, P, Bimet, C et al. (2006). Pyruvate kinase deficiency in France: a 3-year study reveals 27 new mutations. Br J Haematol 133: 683–689. - PubMed
    1. Gilsanz, F, Vega, MA, Gómez-Castillo, E, Ruiz-Balda, JA and Omeñaca, F (1993). Fetal anaemia due to pyruvate kinase deficiency. Arch Dis Child 69(5 Spec No): 523–524. - PMC - PubMed
    1. Beutler, E and Gelbart, T (2000). Estimating the prevalence of pyruvate kinase deficiency from the gene frequency in the general white population. Blood 95: 3585–3588. - PubMed
    1. Tanphaichitr, VS, Suvatte, V, Issaragrisil, S, Mahasandana, C, Veerakul, G, Chongkolwatana, V et al. (2000). Successful bone marrow transplantation in a child with red blood cell pyruvate kinase deficiency. Bone Marrow Transplant 26: 689–690. - PubMed

Publication types

MeSH terms

Substances

Supplementary concepts