

Individual and Neighborhood Socioeconomic Status and the Association between Air Pollution and Cardiovascular Disease
- PMID: 27138533
- PMCID: PMC5132637
- DOI: 10.1289/EHP199
Individual and Neighborhood Socioeconomic Status and the Association between Air Pollution and Cardiovascular Disease
Abstract
Background: Long-term fine particulate matter (PM2.5) exposure is linked with cardiovascular disease, and disadvantaged status may increase susceptibility to air pollution-related health effects. In addition, there are concerns that this association may be partially explained by confounding by socioeconomic status (SES).
Objectives: We examined the roles that individual- and neighborhood-level SES (NSES) play in the association between PM2.5 exposure and cardiovascular disease.
Methods: The study population comprised 51,754 postmenopausal women from the Women's Health Initiative Observational Study. PM2.5 concentrations were predicted at participant residences using fine-scale regionalized universal kriging models. We assessed individual-level SES and NSES (Census-tract level) across several SES domains including education, occupation, and income/wealth, as well as through an NSES score, which captures several important dimensions of SES. Cox proportional-hazards regression adjusted for SES factors and other covariates to determine the risk of a first cardiovascular event.
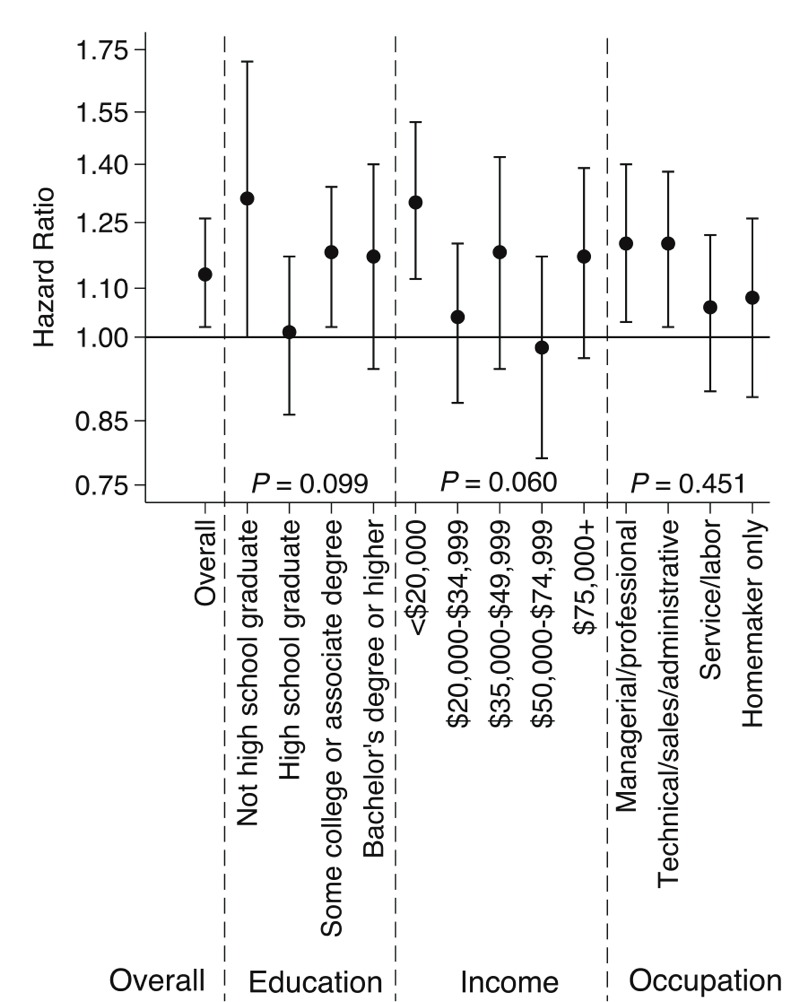
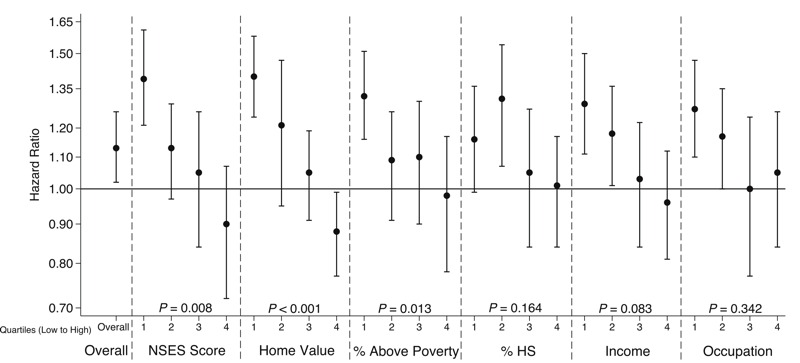
Results: A 5 μg/m3 higher exposure to PM2.5 was associated with a 13% increased risk of cardiovascular event [hazard ratio (HR) 1.13; 95% confidence interval (CI): 1.02, 1.26]. Adjustment for SES factors did not meaningfully affect the risk estimate. Higher risk estimates were observed among participants living in low-SES neighborhoods. The most and least disadvantaged quartiles of the NSES score had HRs of 1.39 (95% CI: 1.21, 1.61) and 0.90 (95% CI: 0.72, 1.07), respectively.
Conclusions: Women with lower NSES may be more susceptible to air pollution-related health effects. The association between air pollution and cardiovascular disease was not explained by confounding from individual-level SES or NSES. Citation: Chi GC, Hajat A, Bird CE, Cullen MR, Griffin BA, Miller KA, Shih RA, Stefanick ML, Vedal S, Whitsel EA, Kaufman JD. 2016. Individual and neighborhood socioeconomic status and the association between air pollution and cardiovascular disease. Environ Health Perspect 124:1840-1847; http://dx.doi.org/10.1289/EHP199.
Conflict of interest statement
The contents of this publication are solely the responsibility of the grantee and do not necessarily represent the official views of the U.S. EPA or the NIH. Further, the U.S. EPA does not endorse the purchase of any commercial products or services mentioned in the publication. The authors declare they have no actual or potential competing financial interests.
Figures
Comment in
-
Comment on "Individual and Neighborhood Socioeconomic Status and the Association between Air Pollution and Cardiovascular Disease".Environ Health Perspect. 2017 Jan 1;125(1):A15. doi: 10.1289/EHP852. Environ Health Perspect. 2017. PMID: 28055945 Free PMC article. No abstract available.
-
Response to "Comment on 'Individual and Neighborhood Socioeconomic Status and the Association between Air Pollution and Cardiovascular Disease'".Environ Health Perspect. 2017 Jan 1;125(1):A16. doi: 10.1289/EHP1268. Environ Health Perspect. 2017. PMID: 28055950 Free PMC article. No abstract available.
References
-
- Abrahamowicz M, Schopflocher T, Leffondré K, du Berger R, Krewski D. 2003. Flexible modeling of exposure-response relationship between long-term average levels of particulate air pollution and mortality in the American Cancer Society study. J Toxicol Environ Health A 66 1625 1654, doi: 10.1080/15287390306426 - DOI - PubMed
-
- Benjamini Y, Hochberg Y. Controlling the false discovery rate: a practical and powerful approach to multiple testing. J R Stat Soc Series B Stat Methodol. 1995;57:289–300.
-
- Bird CE, Shih RA, Eibner C, Griffin BA, Slaughter ME, Whitsel EA, et al. Neighborhood socioeconomic status and incident coronary heart disease among women [Abstact]. J Gen Intern Med. 2009;24(suppl 1):S127.
Publication types
MeSH terms
Grants and funding
- HHSN268201100001I/HL/NHLBI NIH HHS/United States
- R01 ES012238/ES/NIEHS NIH HHS/United States
- HHSN268201100004I/HL/NHLBI NIH HHS/United States
- K24 ES013195/ES/NIEHS NIH HHS/United States
- R00 ES023498/ES/NIEHS NIH HHS/United States
- R01 HL084425/HL/NHLBI NIH HHS/United States
- P50 ES015915/ES/NIEHS NIH HHS/United States
- P30 ES007033/ES/NIEHS NIH HHS/United States
- HHSN271201100004C/AG/NIA NIH HHS/United States
- HHSN268201100002C/WH/WHI NIH HHS/United States
- K99 ES023498/ES/NIEHS NIH HHS/United States
- F31 ES025475/ES/NIEHS NIH HHS/United States
- HHSN268201100002I/HL/NHLBI NIH HHS/United States
- HHSN268201100001C/WH/WHI NIH HHS/United States
- HHSN268201100004C/WH/WHI NIH HHS/United States
LinkOut - more resources
Full Text Sources
Other Literature Sources
Medical
Miscellaneous