. 2016 Apr 30;11(1):36.
doi: 10.1186/s13024-016-0102-7.

Targeting TDP-43 phosphorylation by Casein Kinase-1δ inhibitors: a novel strategy for the treatment of frontotemporal dementia

Affiliations

Targeting TDP-43 phosphorylation by Casein Kinase-1δ inhibitors: a novel strategy for the treatment of frontotemporal dementia

Carolina Alquezar et al. Mol Neurodegener. .

Abstract

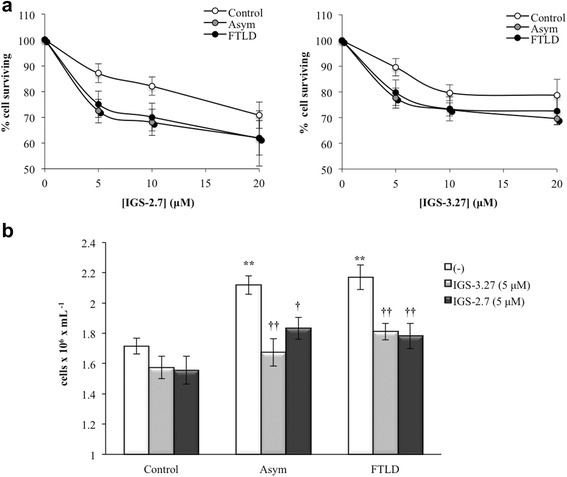
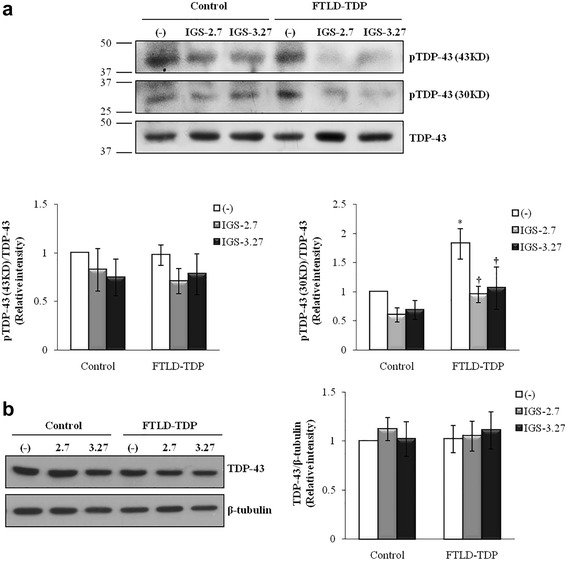
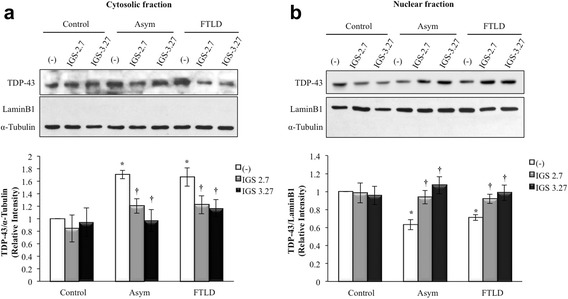
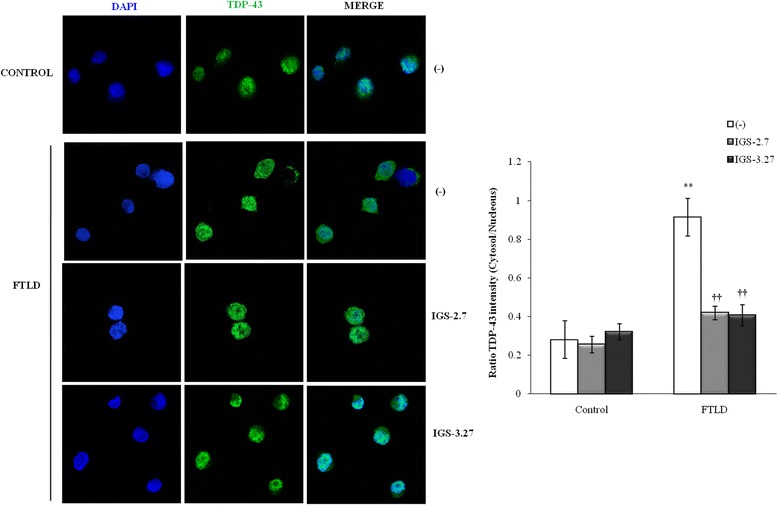
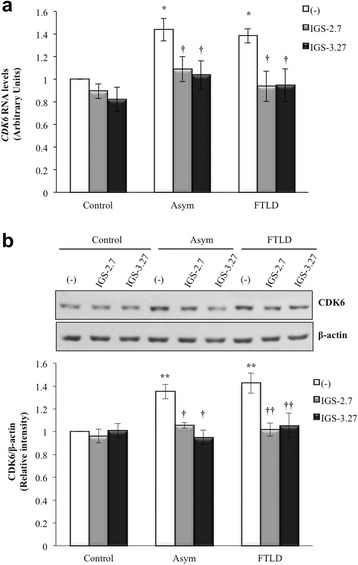
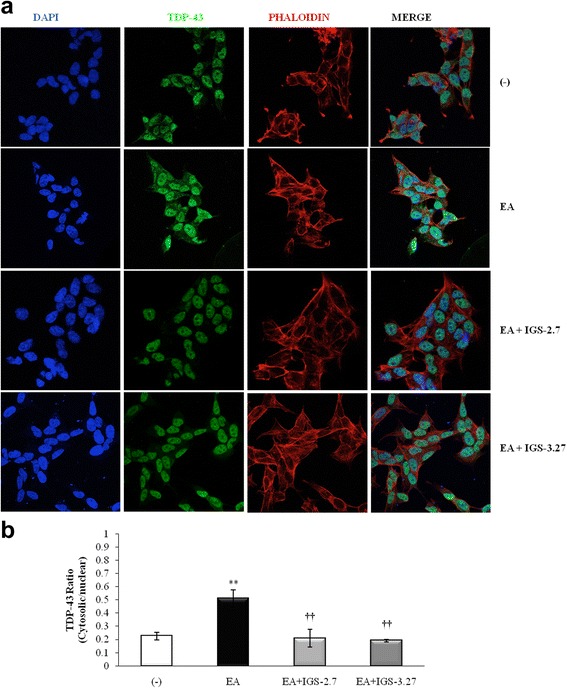
Background: Mutations in the progranulin gene (GRN) are the most common cause of frontotemporal lobar degeneration with TDP-43 inclusions (FTLD-TDP). TDP-43 pathology is characterized by the hyperphosphorylation of the protein at Serine 409/410 residues. Casein kinase-1δ (CK-1δ) was reported to phosphorylate TDP-43 directly. Previous works from our laboratory described the presence of CDK6/pRb-dependent cell cycle alterations, and cytosolic accumulation of TDP-43 protein in lymphoblast from FTLD-TDP patients carriers of a loss-of function mutation in GRN gene (c.709-1G > A). In this work, we have investigated the effects of two brain penetrant CK-1δ inhibitors (IGS-2.7 and IGS-3.27) designed and synthetized in our laboratory on cell proliferation, TDP-43 phosphorylation and subcellular localization, as well as their effects on the known nuclear TDP-43 function repressing the expression of CDK6.

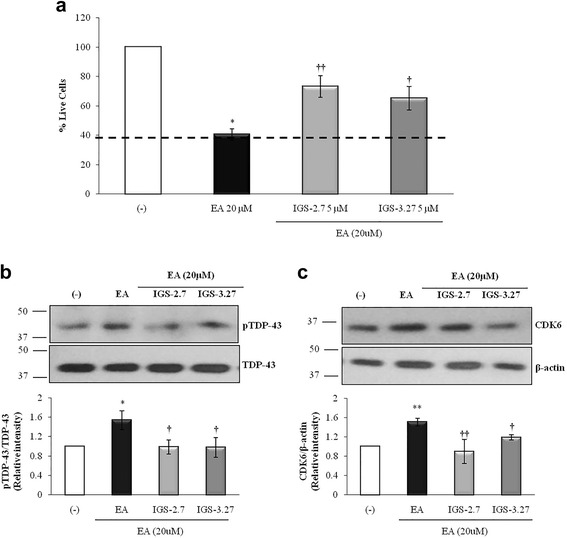
Results: We report here that both CK-1δ inhibitors (IGS-2.7 and IGS-3.27) normalized the proliferative activity of PGRN-deficient lymphoblasts by preventing the phosphorylation of TDP-43 fragments, its nucleo-cytosol translocation and the overactivation of the CDK6/pRb cascade. Moreover, ours results show neuroprotective effects of CK-1δ inhibitors in a neuronal cell model of induced TDP-43 phosphorylation.

Conclusions: Our results suggest that modulating CK-1δ activity could be considered a novel therapeutic approach for the treatment of FTLD-TDP and other TDP-43 proteinopathies.

Keywords: CDK6; CK-1δ; Cell proliferation; FTLD-TDP; Lymphocytes; TDP-43.


Figures

Fig. 1
Fig. 1
Effects of CK1-δ inhibitors on the proliferation of lymphoblasts from control and c.709-1G > A GRN mutation carriers individuals. Immortalized lymphocytes from control and carriers of a GRN mutation, asymptomatic or FTLD-TDP patients were seeded at an initial density of 1 × 10⁶ × ml−1 in the absence or in presence of two CK1-δ activity inhibitors, IGS-2.7 and IGS-3.27, for 72 h. a For the MTT assay a total of 100,000 cells per well were seeded in a 96-well plate in presence of increasing doses (0–20 μM) of both drugs. Results represent the % of cell survival of treated cells referred to untreated ones. b Effect of the treatment with IGS-2.7 and IGS-3.27 (5 μM) on proliferation of control and PGRN deficient lymphoblasts. Aliquots were taken for cell counting 72 h after the drug administration. Data shown are the mean ± SEM of 6 independent experiments carried out with all the cell lines used in this studio (**p < 0.01 significantly different from control cells. ††p < 0.01 significantly different from untreated cells; †p < 0.01 significantly different from untreated cells)
Fig. 2
Fig. 2
Cell cycle analysis of control and FTLD-TDP lymphoblast after treatment with CK1-δ inhibitors. Immortalized lymphocytes from control and GRN mutation-related FTLD individuals were seeded at an initial density of 1 × 10⁶ × ml−1 and cultured in RPMI medium in absence or presence of IGS-2.7 and IGS-3.27 (5 μM). 36 h after drugs addition, cells were harvested, fixed, and analyzed by flow cytometry as described under Methods. The mean ± SEM of the percentage of cells in the different cell cycle phases of four independent experiments is indicated for each condition
Fig. 3
Fig. 3
Effects of CK-1δ inhibitors on TDP-43 phosphorylation. Immortalized lymphocytes from control and GRN mutation-related FTLD individuals were seeded at an initial density of 1 × 10⁶ × ml−1 in absence or presence of IGS-2.7 and IGS-3.27 (5 μM). 24 h after drugs addition, cells were harvested and processed for Western blotting analysis. a Representative immunoblot showing the effect of both CK-1δ inhibitors decreasing the phosphorylation status of truncated (30KD) TDP-43 in PGRN deficient lymphoblasts. The plots bellow represent the quantifications of the bands of 43 KD (left) and 30 KD (right) of pTDP-43 normalized by Total-TDP-43. b The image represents the levels of total TDP-43 protein in control and FTLD-TDP patients (left panel). Quantification of the TDP-43 band normalized with the β-tubulin levels is presented in the right panel. The densitometric analyses represent the mean ± SEM of different observations carried out in four cell lines from each group (*p < 0.05 significantly different from control cells. †p < 0.05 significantly different from untreated cells)
Fig. 4
Fig. 4
Effects of CK-1δ inhibitors on the subcellular localization of TDP-43 of control and GRN mutation lymphoblasts. Control and GRN mutation carrier lymphoblasts were seeded at an initial density of 1 × 106 cells × ml−1 and incubated in presence or absence of IGS-2.7 and IGS-3.27 (5 μM) for 24 h. After treatment, lymphoblasts were collected and lysed to obtain the cytosolic (a) and nuclear (b) fragments that were analyzed by Western blotting. α-tubulin and LaminB1 antibodies were used as loading and purity control of the cytosolic and nuclear fractions respectively. A representative experiment is shown. Densitometric analyses represent mean ± SEM of different observations carried out in seven cell lines from each group (*p < 0.05 significantly different from control cells. †p < 0.05 significantly different from untreated cells)
Fig. 5
Fig. 5
Confocal microscopy analysis of the subcellular localization of TDP-43 after CK-1δ inhibitors treatment of lymphoblast from control and FTLD-TDP patients. Lymphoblasts were seeded at 106 cells × ml−1 and incubated in presence or absence of IGS-2.7 and IGS-3.27 (5 μM) for 24 h. TDP-43 protein localization was assessed by confocal laser scanning microscopy. Cells were stained with anti- TDP-43 antibody followed by secondary antibody labeled with Alexa Fluor 488. DAPI was included in the mounting media to stain the nucleus. Merged images show that the treatment with both drugs prevent the higher cytosolic localization of TPD-43 protein in FTLD-TDP patients. Quantitative analyses of TDP-43 redistribution are shown in the right panel. Relative fluorescence intensity of TDP-43 inside and outside nuclei was determined in 18 cells from four different fields in each condition. Magnification (63x). Values shown are the mean ± SEM. (**p < 0.01 significantly different from control cells. ††p < 0.01 significantly different from FTLD untreated cells)
Fig. 6
Fig. 6
Effects of CK-1δ inhibitors on CDK6 expression levels. Immortalized lymphocytes from control and c.709-1G > A GRN mutation carriers, were seeded at an initial density of 1 × 10⁶ × ml−1 and cultured in RPMI medium containing 10 % FBS in the absence or in the presence of IGS-2.7 and IGS-3.27 (5 μM). 24 h later cells were harvested to isolate RNA and to prepare cell lysates. a) CDK6 mRNA expression levels were analyzed by quantitative RT-PCR. Data shown are the mean ± SEM of different observations using five controls, five asymptomatic and five FTLD-TDP patients. b) Representative immunoblot showing CDK6 protein content after drugs treatment. Densitometric measurements were performed on individual immunoblots and values indicate the mean of CDK6 levels normalized with the corresponding β-actin levels ± SEM for experiments carried out with seven different cell lines for each group (*p < 0.05 and **p < 0.01 significantly different from control cells; †p < 0.05 and ††p < 0.01 significantly different from untreated cells)
Fig. 7
Fig. 7
Neuroprotective effects of CK-1δ inhibitors in ethacrynic acid pre-treated SH-SY5Y neuroblastoma cells. Neuroblastoma SH-SY5Y cells were exposed to 20 μM EA for 12 h in the presence or in the absence of 5 μM of IGS-2.7 and IGS-3.27. a Number of viable cells after drug treatments measured by the MTT assay. Each data point represents the mean ± SEM of three replications in four different experiments (*p < 0.05 significantly different from SH-SY5Y untreated cells; †p < 0.05 and ††p < 0.01 significantly different from EA-treated cells). b Representative immunoblot showing the levels of pTDP-43 protein before and after drugs treatment. c CDK6 protein levels assessed by Western blotting. Representative immunoblot is shown. The densitometric data represent the mean ± SEM of 5 different experiments (*p < 0.05 and **p < 0.01 significantly different from SH-SY5Y untreated cells; †p < 0.05 and ††p < 0.01 significantly different from EA-treated cells)
Fig. 8
Fig. 8
Effects of CK-1δ inhibitors on the subcellular localization of TDP-43 in ethacrynic acid pre-treated SH-SY5Yneuroblastoma cells. a Neuroblastoma SH-SY5Y cells were seeded in coverslips and exposed to 20 μM EA for 12 h in the presence or in the absence of 5 μM of IGS-2.7 and IGS-3.27. TDP-43 protein localization was assessed by confocal laser scanning microscopy. Cells were stained with anti-TDP-43 antibody followed by secondary antibody labeled with Alexa Fluor 488. DAPI (blue) and phalloidin (red) were used for nuclear or cytosolic staining respectively. b Quantitative analyses of TDP-43 redistribution. Relative fluoresecence intensity of TDP-43 staining inside and outside nuclei were determined on 30 different cells from four separate fields, in each condition. Values are the mean ± SEM (magnification 63x). (**p < 0.01 significantly different from SH-SY5Y untreated cells; ††p < 0.01 significantly different from EA-treated cells)

References

    1. Neary D, Snowden JS, Gustafson L, Passant U, Stuss D, Black S, Freedman M, Kertesz A, Robert PH, Albert M, et al. Frontotemporal lobar degeneration: a consensus on clinical diagnostic criteria. Neurology. 1998;51:1546–54. doi: 10.1212/WNL.51.6.1546. - DOI - PubMed
    1. Rabinovici GD, Miller BL. Frontotemporal lobar degeneration: epidemiology, pathophysiology, diagnosis and management. CNS Drugs. 2010;24:375–98. doi: 10.2165/11533100-000000000-00000. - DOI - PMC - PubMed
    1. Rascovsky K, Hodges JR, Knopman D, Mendez MF, Kramer JH, Neuhaus J, van Swieten JC, Seelaar H, Dopper EG, Onyike CU, et al. Sensitivity of revised diagnostic criteria for the behavioural variant of frontotemporal dementia. Brain. 2011;134:2456–77. doi: 10.1093/brain/awr179. - DOI - PMC - PubMed
    1. Baker M, Mackenzie IR, Pickering-Brown SM, Gass J, Rademakers R, Lindholm C, Snowden J, Adamson J, Sadovnick AD, Rollinson S, et al. Mutations in progranulin cause tau-negative frontotemporal dementia linked to chromosome 17. Nature. 2006;442:916–9. doi: 10.1038/nature05016. - DOI - PubMed
    1. Cruts M, Gijselinck I, van der Zee J, Engelborghs S, Wils H, Pirici D, Rademakers R, Vandenberghe R, Dermaut B, Martin JJ, et al. Null mutations in progranulin cause ubiquitin-positive frontotemporal dementia linked to chromosome 17q21. Nature. 2006;442:920–4. doi: 10.1038/nature05017. - DOI - PubMed

Publication types

MeSH terms

Substances