Randomized Controlled Trial
. 2016 Jun;16(2):165-72.
doi: 10.1007/s40268-016-0126-z.

Characterisation of Population Pharmacokinetics and Endogenous Follicle-Stimulating Hormone (FSH) Levels After Multiple Dosing of a Recombinant Human FSH (FE 999049) in Healthy Women

Affiliations
Randomized Controlled Trial

Characterisation of Population Pharmacokinetics and Endogenous Follicle-Stimulating Hormone (FSH) Levels After Multiple Dosing of a Recombinant Human FSH (FE 999049) in Healthy Women

Trine Høyer Rose et al. Drugs R D. 2016 Jun.

Abstract

Objective: The aim of this study was to characterise the population pharmacokinetics of FE 999049, a novel recombinant human follicle-stimulating hormone (FSH), after multiple dosing in healthy women, taking into account endogenous FSH levels and the reproductive hormone dynamics.

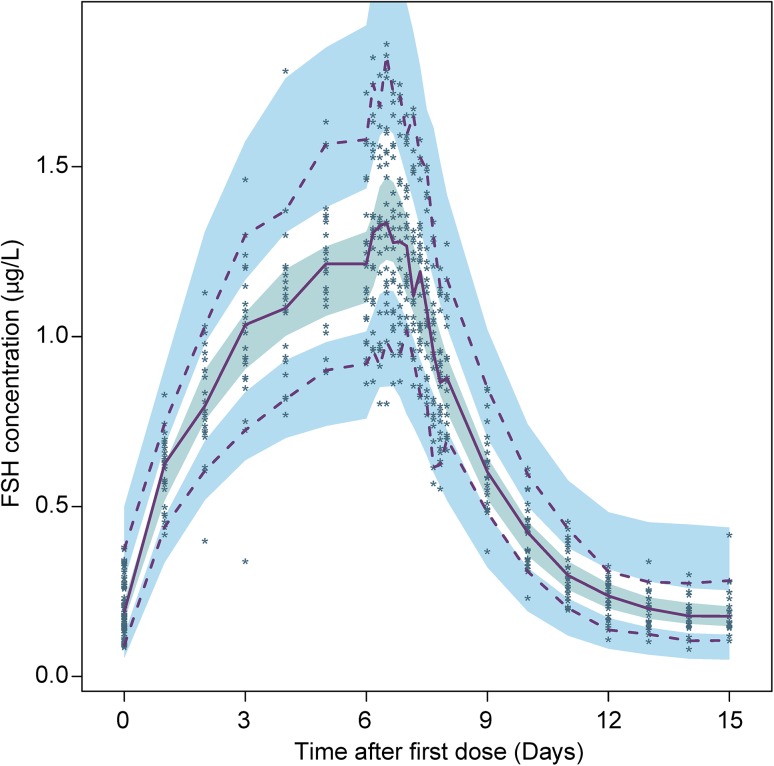
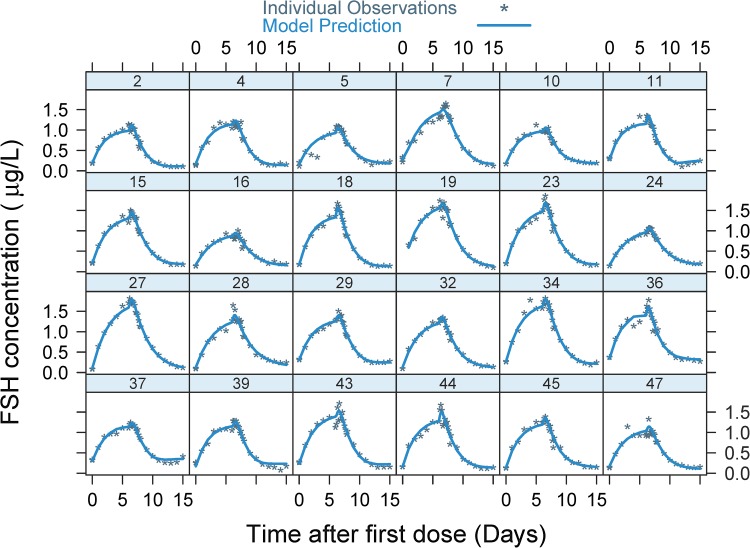
Methods: Longitudinal measurements of FSH, luteinising hormone, progesterone, estradiol, and inhibin B levels were collected after repeated subcutaneous dosing with 225 IU of FE 999049 in 24 gonadotropin downregulated healthy women. The FSH data were described using nonlinear mixed-effects modelling.

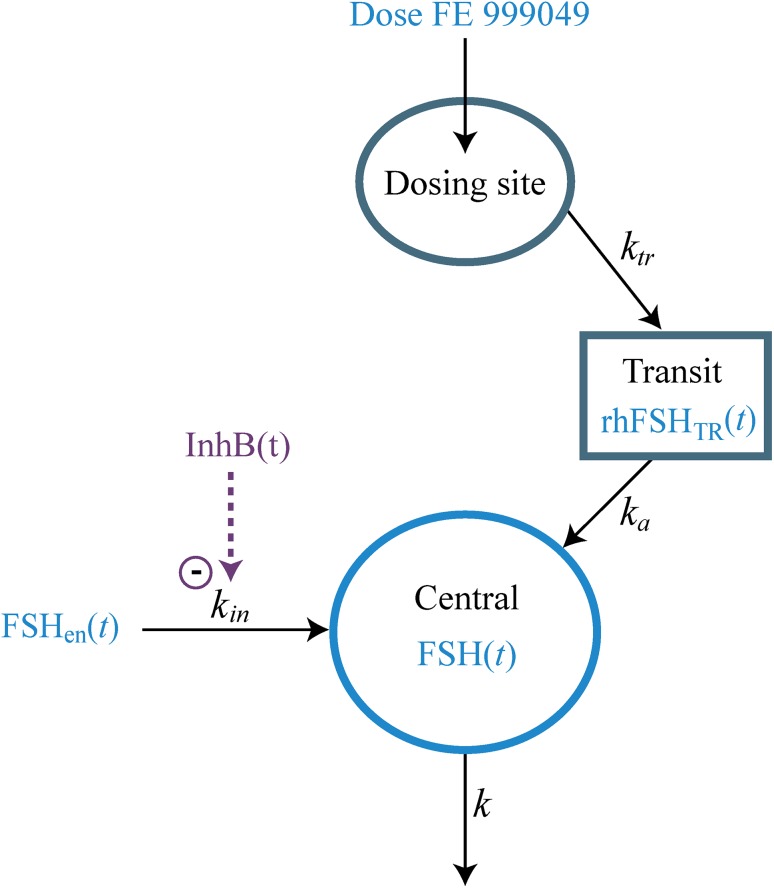
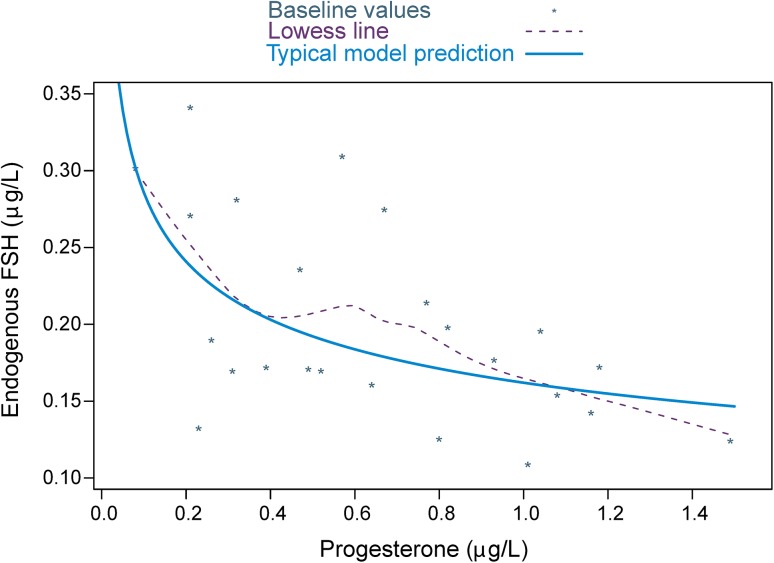
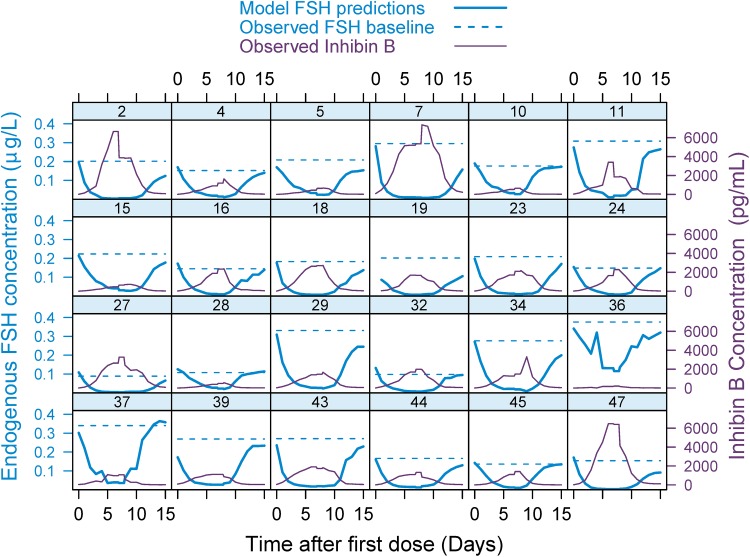
Results: The measured FSH levels were modelled as a sum of endogenous FSH and FE 999049. The FE 999049 population pharmacokinetics were best described using a one-compartment model with first-order absorption and elimination, and a transit model for delayed absorption. The apparent clearance and volume of distribution increased with body weight in accordance with an allometrically scaled power exponent of 0.75 and 1, respectively. Endogenous FSH levels were lower in individuals with higher progesterone levels at baseline and were further suppressed over time with increasing inhibin B levels.

Conclusions: This characterisation of FE 999049 population pharmacokinetics after repeated dosing is in line with previous findings after single-dose administration. The results provide a basis for study design and data evaluation in the future development of recombinant FSH products, and show it can be of importance to account for endogenous FSH levels and its variation over time for accurate estimation of exogenously administered FSH pharmacokinetic parameters. Thus, correcting FSH concentrations by the observed endogenous FSH baseline value at all time points may be incorrect.


Figures

Fig. 1
Fig. 1
Compartment diagram illustrating the pharmacokinetic model for FE 999049 with a contribution of endogenous FSH to the central compartment. FSH follicle-stimulating hormone, rhFSH recombinant human FSH, FSH en (t) endogenous FSH amount, InhB(t) inhibin B level, rhFSH TR (t) rhFSH amount in the transit compartment, FSH(t) total FSH amount in the central compartment, k in endogenous FSH production rate, k tr absorption rate from the dosing site, k a absorption rate from the transit compartment, k elimination rate
Fig. 2
Fig. 2
The relationship between endogenous FSH and progesterone at baseline. Points are individual-predicted FSHbl values and observed progesterone baseline values with a smooth LOWESS trend line (broken line). The solid line is the power function used in the model describing the typical population relationship for the effect of progesterone baseline at the parameter FSHbl. FSH follicle-stimulating hormone, FSH b1 endogenous FSH baseline
Fig. 3
Fig. 3
Visual predictive check for the final model, showing the individual observed FSH concentrations (points) and the 2.5th, 50th, and 97.5th percentiles of observations (lines). The shaded areas are the 95 % confidence intervals for the 2.5th, 50th, and 97.5th percentiles of the simulations. FSH follicle-stimulating hormone
Fig. 4
Fig. 4
Individual model fit with observed (points) and predicted (lines) total FSH concentrations versus time. The number at each subplot is the subject identification number. FSH follicle-stimulating hormone
Fig. 5
Fig. 5
Individual hormone concentration profiles over time. The broken blue line indicates the observed endogenous FSH baseline level when assuming it to be constant throughout the trial, and the solid blue line is the model-predicted endogenous FSH level when accounting for the suppression caused by the observed inhibin B levels (purple line) over time, as identified by the model. The number at each subplot is the subject identification number. FSH follicle-stimulating hormone

References

    1. Macklon NS, Stouffer RL, Giudice LC, Fauser BC. The science behind 25 years of ovarian stimulation for in vitro fertilization. Endocr Rev. 2006;27:170–207. doi: 10.1210/er.2005-0015. - DOI - PubMed
    1. Rose TH, Röshammar D, Erichsen L, Grundemar L, Ottesen JT. Population pharmacokinetic modelling of FE 999049, a recombinant human follicle-stimulating hormone, in healthy women after single ascending doses. Drugs R D. 2016 - PMC - PubMed
    1. Olsson H, Sandström R, Grundemar L. Different pharmacokinetic and pharmacodynamic properties of recombinant follicle-stimulating hormone (rFSH) derived from a human cell line compared with rFSH from a non-human cell line. J Clin Pharmacol. 2014;54:1299–1307. doi: 10.1002/jcph.328. - DOI - PubMed
    1. Beal S, Sheiner LB, Boeckmann A, Bauer RJ. NONMEM user’s guides (1989-2011) Ellicott City: Icon Development Solutions; 2011.
    1. R Development Core Team. R: a language and environment for statistical computing. Vienna: R Foundation for Statistical Computing; 2010.

Publication types

LinkOut - more resources