. 2016 May 3:7:11435.
doi: 10.1038/ncomms11435.

Experimental evolution reveals that high relatedness protects multicellular cooperation from cheaters

Affiliations

Experimental evolution reveals that high relatedness protects multicellular cooperation from cheaters

Eric Bastiaans et al. Nat Commun. .

Abstract

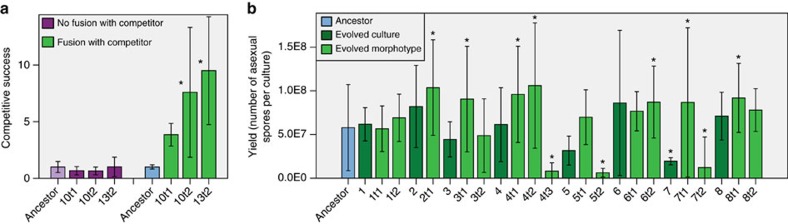
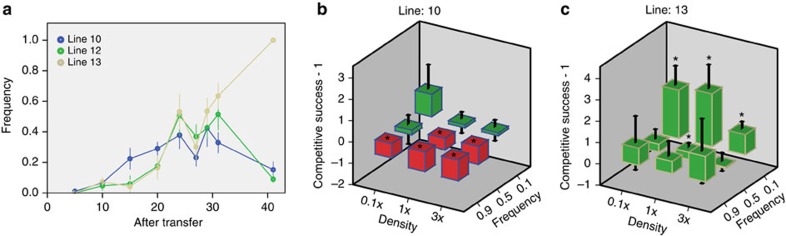
In multicellular organisms, there is a potential risk that cheating mutants gain access to the germline. Development from a single-celled zygote resets relatedness among cells to its maximum value each generation, which should accomplish segregation of cheating mutants from non-cheaters and thereby protect multicellular cooperation. Here we provide the crucial direct comparison between high- and low-relatedness conditions to test this hypothesis. We allow two variants of the fungus Neurospora crassa to evolve, one with and one without the ability to form chimeras with other individuals, thus generating two relatedness levels. While multicellular cooperation remains high in the high-relatedness lines, it significantly decreases in all replicate low-relatedness lines, resulting in an average threefold decrease in spore yield. This reduction is caused by cheating mutants with reduced investment in somatic functions, but increased competitive success when fusing with non-cheaters. Our experiments demonstrate that high genetic relatedness is crucial to sustain multicellular cooperation.


Figures

Figure 1
Figure 1. Experimental setup and the consequences of relatedness for cheating.
(a) Experimental setup. For each evolution line, asexual spores were inoculated on agar and after 3 days growth all newly formed asexual spores were collected (∼1 × 10⁸ spores), of which 1% were inoculated on a fresh tube. This cycle was repeated for 31 generations. (b) Eight replicate evolution lines were started from a single asexual spore of the standard lab strain (low-relatedness treatment), and eight lines from a spore of the fusion mutant (high-relatedness treatment). (c) Fusion between germinating spores results in mixing of cytoplasm and nuclei, thereby lowering relatedness among the nuclei within a colony (lower panel). Low relatedness facilitates selection at the level of the nuclei within the colony, which may favour variants with an increased probability to reproduce, even if they negatively impact total spore production. Such cheater morphotypes owe their increased fitness to fusion with non-cheating genotypes. If fusion is not possible, the nuclei from different individuals remain separated, thereby maintaining high relatedness among nuclei within an individual (upper panel). High relatedness implies that selection primarily acts among different individuals, disfavouring cheating mutants, as each genotype will be held accountable for its contribution to somatic functions required to produce the optimal number of spores.
Figure 2
Figure 2. Yield of the evolved lines and of morphotypes found within these lines.
(a) Under high-relatedness conditions high spore production is maintained, while under low-relatedness conditions spore yield drops. Column chart comparing the average yield of eight evolved lines per treatment before and after an estimated 205 asexual generations. Significant changes in yield during evolution (Mann–Whitney's U-test; *P<0.05) are indicated. Error bars depict 95% confidence intervals (n=3 for ancestor, n=24 for evolved). (b) Evolution under low-relatedness conditions results in the selection of different morphotypes within all eight lines. Typical photo of a Petri dish with 1-week-old colonies grown from asexual spores of a culture of line 13 evolved for 31 transfers under low-relatedness conditions. Bright-orange colonies are sporulating, similar to the ancestral phenotype, while the pale colonies have reduced sporulation. (c) Yield of evolved low-relatedness lines and of the different morphotypes within lines. Column chart comparing asexual spore yields of the low-relatedness lines and of their morphotypes and the ancestral genotype. The first number of labels on the x-axis refers to the evolved cultures after 31 transfers (9–16) and the second number to the morphotypes within these lines (9t1–16t3; and to the ancestral culture). Significant differences with the ancestor (Tukey's post hoc test *P<0.05) are indicated. Error bars depict 95% confidence intervals (n=3).
Figure 3
Figure 3. Spore yield and linear growth rate.
Comparison between average asexual spore yield (n=3) and average linear growth rate of the morphotypes (n=3) isolated from the lines evolved under low-relatedness conditions. A significant positive relationship was found between yield and linear growth rate for these types (linear regression, F1,18=29.62, P<0.0005).
Figure 4
Figure 4. Aspects of competitive success of morphotypes found within evolution lines.
Tests of statistical significance of linear regression are in the graphs. (a) Competitive success of evolved morphotypes has increased relative to the ancestor. Column chart comparing normalized competitive success of the morphotypes evolved under low relatedness relative to the ancestral strain. Significant differences with the ancestor (Tukey's post hoc test *P<0.05) are indicated. Error bars depict 95% confidence intervals (n=3). (b) There is a highly significant negative correlation between yield in monoculture and competitive success. The graph shows average asexual spore yield (n=3) in monoculture plotted against average competitive success (n=3) relative to the ancestral strain. (c) Competitive success only marginally depends on yield of the evolved type in competition. The graph shows the relation between the averages (n=3) of competitive success and corrected yield of the evolved type in competition. The yield is corrected for small deviations in the inoculation frequency from the intended 0.1. (d) Competitive success is significantly negatively correlated with the yield of the ancestral type in competition. The graph shows the relation between the averages (n=3) of competitive success and the corrected yield of the ancestral type it is competing with. The yield is corrected for small deviations in the inoculation frequency from the intended 0.9. (e) There is a highly significant positive correlation between yield in monoculture and the yield of the ancestral competitor in the competition. The graph shows the relation between the average (n=3) of corrected yield of the evolved type in monoculture and the average of the corrected yield of the ancestral competitor it is competing with. Corrected yield is corrected for deviations in the inoculation frequency from the intended 0.9. (f) There is no significant correlation between the yield of the morphotypes in monoculture and their yield in competition. The graph shows the relation between the average (n=3) of corrected yield of the evolved type in competition and its yield in monoculture. Corrected yield is corrected for deviations in the inoculation frequency from the intended 0.1.
Figure 5
Figure 5. Consequences of restriction to somatic fusion on cheating.
(a) Increased competitive success depends on somatic fusion. The column chart shows normalized competitive success of three selected morphotypes evolved under low-relatedness conditions relative to an ancestral strain with a different allotype with which fusion is not possible. For comparison, competitive success of the same morphotypes relative to the ancestral strain with which fusion is possible is depicted in the right-hand graph. Significant differences with the ancestor (Tukey's post hoc test *P<0.05) are indicated. Error bars depict 95% confidence intervals (n=3). (b) Column chart comparing asexual spore yields of the high-relatedness lines and the morphotypes within these lines with the yield of the ancestral type. No significant differences with the ancestor were found using a Tukey's post hoc test; significant differences with the ancestor using the less conservative LSD post hoc test (*P<0.05) are indicated. Error bars depict 95% confidence intervals (n=3).
Figure 6
Figure 6. Frequency and density dependence of competitive success of cheaters.
(a) Line chart showing the frequency changes of the cheater morphotypes during the evolution experiment in three lines. (b,c) Column diagrams showing competitive success of the cheater morphotypes relative to the social morphotypes from line 10 and 13 as a function of inoculation density (x-axis) and inoculation frequency (z-axis). On the y-axis competitive success—1 is depicted, so that positive (green bars) and negative values (red bars) represent a selective advantage or disadvantage to the competitor, respectively. Competitive success is measured for different inoculation densities (x-axis) and different starting frequencies (z-axis). Starting density 1 × is the density representative for the first few transfers of the evolution experiment (4 × 10⁷ spores per ml). The other starting densities are three times concentrated (3 × ) and 10 times diluted (0.1 × ) relative to 1 × . Significant differences from 0 (t-test *P<0.05) are indicated. Error bars depict 95% confidence intervals (n=3).

Similar articles

Cited by

References

    1. Buss L. The Evolution of Individuality Princeton University Press (1987).
    1. Maynard Smith J. & Szathmary E. The Major Transitions in Evolution Oxford University Press (1995).
    1. Queller D. C. Relatedness and the fraternal major transitions. Philos. Trans. Biol. Sci. 355, 1647–1655 (2000). - PMC - PubMed
    1. Bonner J. On the origin of differentiation. J. Biosci. 28, 523–528 (2003). - PubMed
    1. Michod R. E. Evolution of individuality during the transition from unicellular to multicellular life. Proc. Natl Acad. Sci. 104, 8613–8618 (2007). - PMC - PubMed

Publication types

LinkOut - more resources