. 2016 May 30;213(6):979-92.
doi: 10.1084/jem.20152013. Epub 2016 May 2.

Single-cell transcriptional analysis of normal, aberrant, and malignant hematopoiesis in zebrafish

Affiliations

Single-cell transcriptional analysis of normal, aberrant, and malignant hematopoiesis in zebrafish

Finola E Moore et al. J Exp Med. .

Abstract

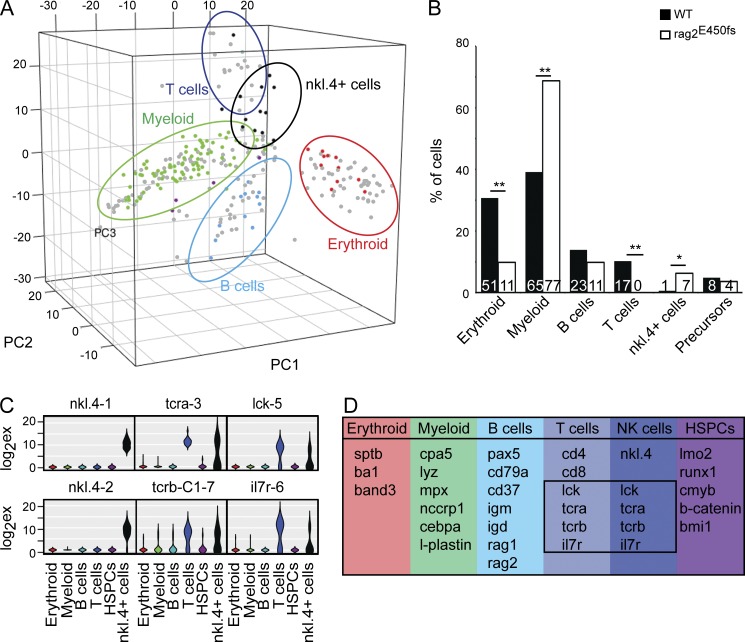
Hematopoiesis culminates in the production of functionally heterogeneous blood cell types. In zebrafish, the lack of cell surface antibodies has compelled researchers to use fluorescent transgenic reporter lines to label specific blood cell fractions. However, these approaches are limited by the availability of transgenic lines and fluorescent protein combinations that can be distinguished. Here, we have transcriptionally profiled single hematopoietic cells from zebrafish to define erythroid, myeloid, B, and T cell lineages. We also used our approach to identify hematopoietic stem and progenitor cells and a novel NK-lysin 4(+) cell type, representing a putative cytotoxic T/NK cell. Our platform also quantified hematopoietic defects in rag2(E450fs) mutant fish and showed that these fish have reduced T cells with a subsequent expansion of NK-lysin 4(+) cells and myeloid cells. These data suggest compensatory regulation of the innate immune system in rag2(E450fs) mutant zebrafish. Finally, analysis of Myc-induced T cell acute lymphoblastic leukemia showed that cells are arrested at the CD4(+)/CD8(+) cortical thymocyte stage and that a subset of leukemia cells inappropriately reexpress stem cell genes, including bmi1 and cmyb In total, our experiments provide new tools and biological insights into single-cell heterogeneity found in zebrafish blood and leukemia.


Figures

Figure 1.
Figure 1.
Single-cell qPCR delineates four major blood cell lineages from adult zebrafish marrow. (A) Unsupervised hierarchical clustering after gene expression analysis of single blood cells isolated from the whole kidney marrow. Heat map shows high transcript expression in red and low/absent expression in blue. Four major clusters were identified, including the following: erythroid (red), myeloid (green), B cells (light blue), and T cells (dark blue). Select lineage-specific genes are shown on the right. n = 166 WKM cells combined from two animals. (B) WGCNA-identified genes that were expressed together in single cells. Each row and column corresponds to a specific gene primer set. The heat map represents WCGNA adjacency dissimilarity values in the range between 0 (low topological overlap, light yellow) and 1 (high topological overlap, dark red). (C) The genes in each lineage module from WGCNA are noted. (D) Violin plots show the distribution of gene expression of single cells. Cells types were assigned based on hierarchical clustering and assessed for transcript expression of well-known blood cell lineage genes. By ANOVA, ba1 (P = 5.67 × 10−168), slc4a1a/band3 (P = 8.88 × 10−64), sptb (P = 1.57 × 10−43), mpx (P = 4.31 × 10−73), lyz (P = 2.70 × 10−71), cpa5 (P = 1.67 × 10−62), pax5 (P = 1.45 × 10−43), cd37 (P = 1.19 × 10−82), cd79a (P = 1.30 × 10−79), tcra (P = 3.24 × 10−116, lck (P = 2.64 × 10⁻³⁰), and il7r/cd127 (P = 4.48 × 10⁻²⁴).
Figure 2.
Figure 2.
Single cells isolated from lineage-restricted transgenic reporter lines segregate together after hierarchical clustering. (A) FACS analysis (left) and cytospins of sorted transgenic blood populations (right). Bars, 25 µm. (B) Unsupervised hierarchical clustering after single-cell gene expression analysis. Cell identity is shown above the heat map: peripheral blood cells (pink, n = 20 cells) and sorted fluorescent WKM cells from gata1:dsRed (red, n = 24 cells), mpx:GFP (green, n = 48 cells), rag2:dsRed (light blue, n = 49 cells), or lck:GFP (dark blue, n = 83 cells). Cells shown are from a single representative animal. Yellow shading denotes cells that failed to cluster into known lineages described by our qPCR panel.
Figure 3.
Figure 3.
Unlabeled marrow cells cluster efficiently with single cells isolated from transgenic reporter lines. (A) Principal component analysis identifies four major blood lineages in WKM. Filled circles are unlabeled WKM, open circles are peripheral red blood cells. Cells isolated from transgenic reporter lines (gata1:dsRed, red; mpx:GFP, green; rag2:dsRed, light blue; or lck:GFP, dark blue) are denoted by an x. (B) Blood cells from transgenic fish reside within expected cell lineages as defined by hierarchical clustering with unlabeled marrow. (C) Violin plots confirm that cells assigned to specific hierarchical clusters have high expression of cell lineage–restricted genes. Unlabeled peripheral RBCs (per RBC) and marrow cells (erythroid, myeloid, B cells, and T cells). Sorted transgenic cells denoted by promoter.
Figure 4.
Figure 4.
Identification of CD41:GFPlow hematopoietic stem and precursor cells. (A) Unsupervised hierarchical clustering comparing gene expression of unlabeled WKM and Tg(CD41:GFP)low cells. Six major lineages were identified including erythroid (red), myeloid (green), B cells (light blue), T cells (dark blue), myeloid-associated CD41:GFPlow cells (denoted by light purple shading in dendogram), and HSPCs (purple). The cell identity of each sorted cell is shown as rectangles immediately below the dendograms, unlabeled WKM (black), and Tg(CD41:GFP)low (purple). n = 166 WT WKM cells (combined from two animals) and n = 85 CD41:GFPlow WKM cells from a single animal. (B) Pie charts showing proportion of blood lineages in Tg(CD41:GFP)low cells when compared with unlabeled WKM cells. (C) Principal component analysis of unlabeled WKM and Tg(CD41:GFP)low cells. (D) Violin plots show the distribution of gene expression of single cells. Cells types were assigned based on hierarchical clustering and assessed for transcript expression of well-known blood cell lineage genes.
Figure 5.
Figure 5.
rag2E450fsmutant zebrafish have reduced T cells and expanded myeloid and nkl.4+ cells. (A) Principal component analysis showing loss of T cells from the WKM of rag2E450fs mutant zebrafish and expansion of nkl.4+ cells (black). WT and rag2E450fs WKM were included in PCA. For visualization, cells from rag2E450fs WKM are shown in color, and WT WKM cells are greyed circles. (B) Quantification of blood cell types from the marrow of WT and rag2E450fs mutant zebrafish. Counts were based on single-cell PCR gene expression and assignments based on hierarchical clustering defined in Fig. 3. *, P = 0.0081; **, P = 0.0001, by Fisher’s exact test. The numbers of cells per lineage are noted within the bar graph. n = 166 WT WKM cells and n = 112 rag2E450fs WKM cells combined from two animals. (C) Violin plots show the distribution of gene expression in nkl.4+ cells. (D) Genes expressed within each cell type.
Figure 6.
Figure 6.
Zebrafish Myc-induced T-ALLs are arrested at the CD4+/CD8+ cortical thymocyte stage and reexpress stem cell genes. (A) Merged bright field and fluorescent images of Tg(rag2:dsRed) zebrafish (top left) or fluorescent leukemic fish. LPC frequency for each individual T-ALL is denoted in bottom left corner of each image, and clone name is denoted in the top left corner. The white arrowhead designates thymus. Bars, 2.5 mm. (B) May-Grunwald staining of representative T-ALL cells (left) and normal WKM (right; red blood cell, red arrow; myeloid cell, green arrow, and lymphocyte, blue arrow). Bars, 25 µm. (C) Kaplan-Meier analysis of leukemia onset in transplanted zebrafish. Number designations correspond to leukemias described by Blackburn et al. (2014). (D) Percentage of T cells that express CD4 and CD8 in normal rag2:dsRed+ thymic T cells and fluorescent-labeled T-ALLs. ***, P = 0.0001, by Fisher’s exact test. (E) Principal component analysis identified three distinct clusters of cells that include the following: mature T cells (Tg(lck:GFP) dark blue, n = 83 cells), thymocytes (Tg(rag2:dsRed) light blue, n = 77 cells from a single animal), and T-ALLs (pink, n = 250 cells, combined from three independent leukemias). (F) WGCNA of T-ALLs revealed that stem cell genes are reexpressed in T-ALLs and expressed together. Each row and column corresponds to a specific gene primer set. The heat map represents WCGNA adjacency dissimilarity values in the range between 0 (low topological overlap, light yellow) and 1 (high topological overlap, dark red). Red lettering denotes genes shown in G. (G) Violin plots show the distribution of transcript expression for genes involved in T cell differentiation and stem cells. ***, P = 0.0001, by Fisher’s exact test.

References

    1. Amir el A.D., Davis K.L., Tadmor M.D., Simonds E.F., Levine J.H., Bendall S.C., Shenfeld D.K., Krishnaswamy S., Nolan G.P., and Pe’er D.. 2013. viSNE enables visualization of high dimensional single-cell data and reveals phenotypic heterogeneity of leukemia. Nat. Biotechnol. 31:545–552. 10.1038/nbt.2594 - DOI - PMC - PubMed
    1. Andersson M., Gunne H., Agerberth B., Boman A., Bergman T., Sillard R., Jörnvall H., Mutt V., Olsson B., Wigzell H., et al. . 1995. NK-lysin, a novel effector peptide of cytotoxic T and NK cells. Structure and cDNA cloning of the porcine form, induction by interleukin 2, antibacterial and antitumour activity. EMBO J. 14:1615–1625. - PMC - PubMed
    1. Bendall S.C., Simonds E.F., Qiu P., Amir el A.D., Krutzik P.O., Finck R., Bruggner R.V., Melamed R., Trejo A., Ornatsky O.I., et al. . 2011. Single-cell mass cytometry of differential immune and drug responses across a human hematopoietic continuum. Science. 332:687–696. 10.1126/science.1198704 - DOI - PMC - PubMed
    1. Bendall S.C., Davis K.L., Amir A.D., Tadmor M.D., Simonds E.F., Chen T.J., Shenfeld D.K., Nolan G.P., and Pe’er D.. 2014. Single-cell trajectory detection uncovers progression and regulatory coordination in human B cell development. Cell. 157:714–725. 10.1016/j.cell.2014.04.005 - DOI - PMC - PubMed
    1. Bertrand J.Y., Kim A.D., Teng S., and Traver D.. 2008. CD41+ cmyb+ precursors colonize the zebrafish pronephros by a novel migration route to initiate adult hematopoiesis. Development. 135:1853–1862. 10.1242/dev.015297 - DOI - PMC - PubMed

Publication types

MeSH terms